Dynamic Daily Levels & FlipsDaily levels to be entered manually. those levels are based on night and morning session. I use the level that Roger Scott is providing in his morning pre watch show. I use this levels on etf's only指标由duodom提供12
SYP Daily SweepTired of drawing the same horizontal lines every single day? Welcome to your new favorite automated setup. We all know the market is just one big hunt for liquidity. This indicator is specifically designed to map out exactly where the "Smart Money" is looking, turning your chart into a literal roadmap for high-probability setups. Stop guessing, start printing! 🖨️💵✨ Here is what this all-in-one toolkit does for you automatically every day at UTC 00:00 (Daily Open): 🔥 CORE FEATURES 1. True FRV指标由PSY921215提供已更新 40
NY Session VWAP with AngleIndicator Title: NY Session VWAP with Real-Time Slope (Angle)📊 Overview This indicator provides a specialized Volume Weighted Average Price (VWAP) specifically anchored to the New York Session. Unlike standard VWAPs that reset at the daily open, this tool is designed for intraday traders who focus on the high-liquidity NY window, allowing for a "fresh" calculation of institutional value from the opening bell of the New York exchange.What sets this script apart is the integrated Slope Angle c指标由Danish7421提供24
BTC Power Law BandsBTC Power Law Bands This indicator applies a Power Law model to Bitcoin’s price, based on the log-log relationship between time and market value. The core idea is that Bitcoin does not grow randomly, but instead follows a long-term statistical corridor where price oscillates around a structural trend. - The central line represents the estimated fair value over time - Upper bands highlight potential overvaluation and euphoria zones - Lower bands highlight undervaluation and asymmetric opportun指标由renatoUlianov444提供35
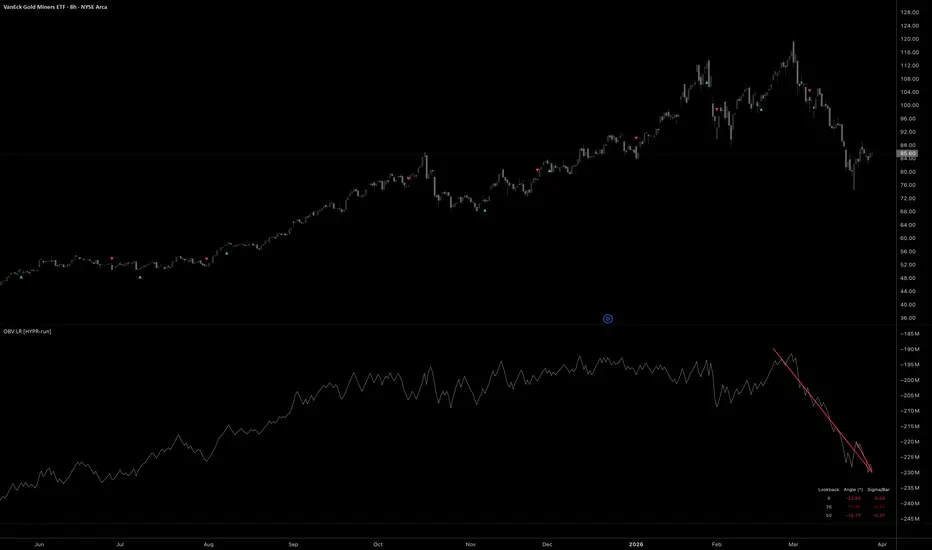
OBV Linear Regression Multi-Slope [HYPR-run]DESCRIPTION: Three linear regression slopes fitted to On-Balance Volume. Measures whether accumulation or distribution is accelerating, decelerating, or reversing across short, medium, and long lookbacks simultaneously. Raw OBV tells you the cumulative direction of volume flow. Fitting a linear regression to it gives you the rate of change: the slope. Three slopes at different lookbacks show the structure of volume commitment. When all three agree, volume flow is structurally committed in one di指标由HYPR-run提供已更新 32
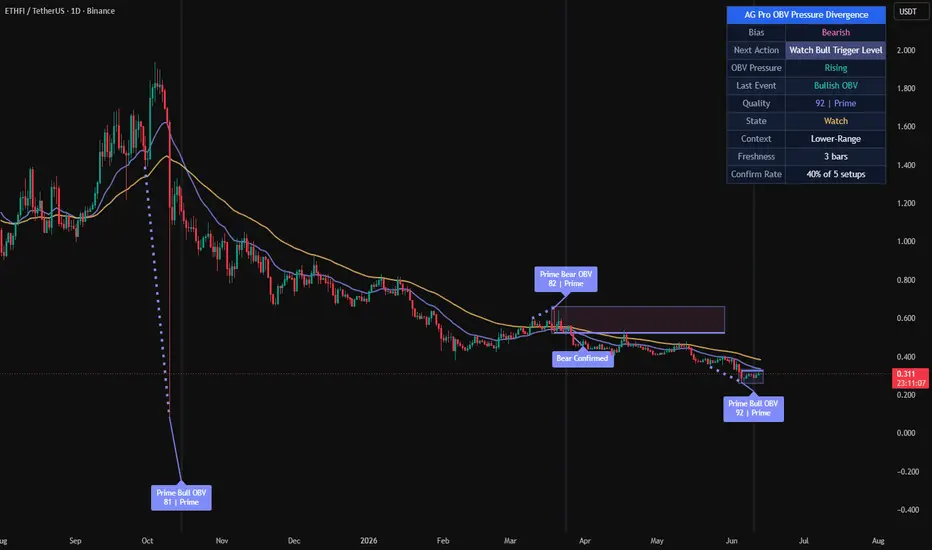
AG Pro OBV Pressure Divergence [AGPro Series]AG Pro OBV Pressure Divergence Overview AG Pro OBV Pressure Divergence is a context-aware divergence quality map built around the relationship between price structure and On-Balance Volume pressure. The script is designed to identify bullish and bearish divergence events, then rank those events by participation quality, structural context, and follow-through behavior. Instead of treating every divergence as equally important, it separates weaker pressure disagreements from more meaningful s指标由AGProLabs提供已更新 3173
Moving Average ExponentialTriple EMA Ribbon Indicator (Short, Medium, Long-Term) This indicator is a classic Exponential Moving Average (EMA) ribbon designed for TradingView, fully upgraded to Pine Script v6. It plots three distinct EMAs on the chart simultaneously, helping traders quickly identify market trends, dynamic support/resistance levels, and potential entry or exit signals across different time horizons. Key Features Three-Tier Trend Analysis: The indicator combines three EMAs with default lengths of 21 (Short-指标由dylancui9提供5
RSI AND Multi EMA 1. The Core Concept: RSI EMA SmoothingStandard RSI can be jagged and prone to false spikes. By applying an EMA (typically a 13 or 21-period) to the RSI line itself, you create a signal line that represents the "average momentum."RSI > RSI EMA: Upward momentum is accelerating.RSI < RSI EMA: Downward momentum is accelerating. 2. The Multi-Timeframe (MTF) FilterTo identify "false" moves, you compare a lower timeframe (e.g., 15-minute or 1-hour) with a higher timeframe (e.g., 4-hour or Daily).A. Id指标由akghuf19ag24提供125
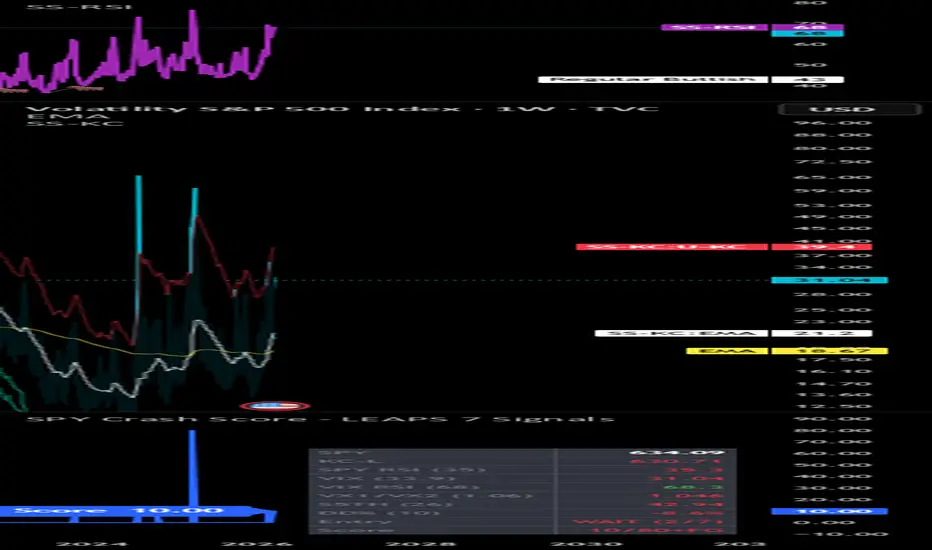
SS Keltner LineA customised Keltner Channel indicator designed for crash detection and mean-reversion entries on SPY and broad market indices. Unlike standard Keltner Channel implementations, this version uses an asymmetric band structure — a wider upper band for overbought detection and two tiered lower bands to distinguish between moderate and deep oversold conditions. Band structure: Upper band — EMA + 2.75 × ATR(10) — blue. Overbought / extended zone Basis — 20-period EMA — yellow. Mean reversion target /指标由surajsajeev1988提供2
SPY Crash Score - LEAPS 7 SignalsA systematic trading decision tool for timing long-dated SPY call options (LEAPS) during market crashes. Built around a 7-signal, 100-point scoring framework backtested over 10 years (2016–2026) with a 100% win rate at threshold entries. How it works: Enter 8 weekly values from TradingView every Sunday — SPY close, Keltner Channel lower band, SPY RSI, CNN Fear & Greed index, VIX level, VIX RSI, VX1!/VX2! ratio, and S5TH breadth reading. The tool scores each signal against calibrated thresholds d指标由surajsajeev1988提供7
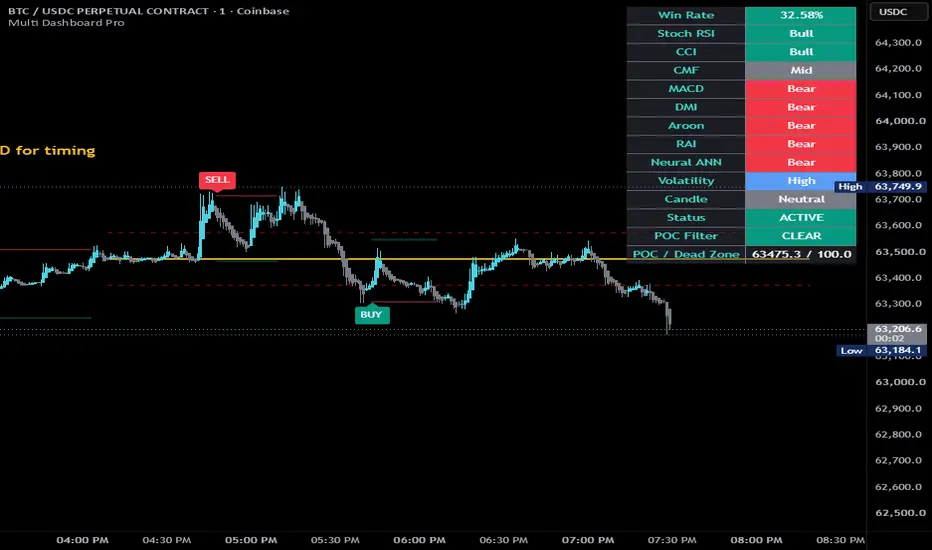
Multi-Indicator Dashboard + Signals + WinRateQuick Reference for Your Charts: The 10 Dots (Bottom): These are your "Confluence Radar." When they all turn Green (Bullish) or Red (Bearish) at the same time, a BUY or SELL label will appear. The Dashboard Table: Gives you the precise "why" behind every signal. You can check individual indicator states (like "Oversold" or "Neural ANN Bull") and track your performance metrics in real-time. Active Trade Management: Watch the Red (SL) and Green (TP) lines on your chart. If you have Break Even turn指标由milesdefendersclub提供已更新 175
Super SMA 5 8 13 + EMA 20/200 Regime Filter (ALIZET)Love this indicator. Super SMA 5 8 13 + EMA 20/200 Regime Filter (ALIZET) is a trend‑following indicator that combines the classic 5‑8‑13 moving average setup with a 20/200 EMA regime filter. It plots SMA 5/8/13 for short‑term momentum and EMA 20/200 to define market environment (bullish, bearish, or both). Buy signals trigger when SMA 5 crosses above SMA 13 under the selected regime; sell signals trigger when SMA 5 crosses below SMA 8 and SMA 13. The “Regime Filter” input lets you limit signal指标由afdzjr69提供173
Dual MA Crossover + Volatility FilterOverview The Dual MA Crossover + Volatility Filter is a comprehensive, trend-following framework designed primarily for futures and high-liquidity assets. Unlike standard moving average strategies that suffer during "choppy" or sideways markets, this system employs a multi-layered filtering process to ensure trades are only taken when momentum, volatility, and timing are in alignment. Core Logic The strategy triggers a signal when a Fast Moving Average crosses a Slow Moving Average. However, th策略由Danish7421提供5
Triple Signal + Market DashboardTriple Signal Logic: Combines Stochastic RSI, Trend CCI, and Chaikin Money Flow. It triggers a BUY or SELL signal when all three reach their oversold or overbought levels within your chosen lookback window. Market Condition Dashboard: A real-time table showing: Individual indicator states (Oversold, Overbought, or Neutral). Overall Market Condition (Strong Bullish, Bullish, Strong Bearish, Bearish, or Neutral) based on price relation to the 200 EMA and indicator alignment. Webhook Alerts: The sc指标由milesdefendersclub提供已更新 77
Triple Signal + Market DashboardTriple Signal Logic: Combines Stochastic RSI, Trend CCI, and Chaikin Money Flow. It triggers a BUY or SELL signal when all three reach their oversold or overbought levels within your chosen lookback window. Market Condition Dashboard: A real-time table showing: Individual indicator states (Oversold, Overbought, or Neutral). Overall Market Condition (Strong Bullish, Bullish, Strong Bearish, Bearish, or Neutral) based on price relation to the 200 EMA and indicator alignment. Webhook Alerts: The sc指标由milesdefendersclub提供已更新 10
KIMCHI_PREMIUM(UPBIT/COINBASE)**KIMCHI PREMIUM (UPBIT / COINBASE)** This indicator measures the Kimchi Premium — the price difference between Bitcoin traded on a Korean exchange (Upbit, KRW pair) and a global USD-based reference (Coinbase BTCUSD), adjusted for the USD/KRW exchange rate. --- ### 🔍 Concept The Kimchi Premium is calculated as: * **KRW Price** → Upbit BTC/KRW * **USD Price** → Coinbase BTC/USD * **USDKRW** → Exchange rate This ensures that the comparison is normalized into the same currency (KRW), allow指标由Easthill-提供0
SMA Cross Toggle & Trend Logic This script uses two Simple Moving Averages (SMA) to detect trend shifts through crossover events. 1. What the SMA Cross Represents A crossover occurs when the relative position of the fast and slow SMA changes: Bullish Cross → Fast SMA moves above Slow SMA Bearish Cross → Fast SMA moves below Slow SMA This marks a change in directional dominance, not just price movement. 2. Cross Visualization (Toggle: plot.style_cross) The script provides a toggle to display crosses directly on the SMA指标由akghuf19ag24提供111
Smart MCDX FINAL PROSmart MCDX FINAL PRO is a clean and optimized interpretation of the Smart Money Concept using volume-weighted pressure. It visualizes the interaction between Banker (Smart Money), Hot Money, and Retail flow, while providing clear trend context, timing signals, and multi-timeframe confirmation. 🔍 Core Concept This indicator is built around one key idea: Markets move when Smart Money (Banker) takes control. 🔴 Banker (Red) → Institutional / Smart Money pressure 🟡 Hot Money (Yellow) → Transition指标由Sachse-1980提供92
MARKET PULSE Read the Energy, Not the Direction👉 Join the community, ask questions, share setups: discord.gg/8H4qdBDaEu MARKET PULSE — Read the Energy, Not the Direction Every indicator you've ever used tells you the same thing: which way price might go. RSI, MACD, stochastics — they're all measuring direction in different ways. Market Pulse does something fundamentally different. It measures the energy state of the market — the rhythm underneath price that exists before any move happens. The concept is simple: markets breathe. Before every 指标由dtprecision提供17
Volumetric Order Blocks - BensonDeveloped a script that identifies Order Blocks (OBs) and analyzes the volume profile within them. It calculates the Buy and Sell volume percentages for the candle that forms the block, displaying these metrics directly on the chart using boxes and labels. Key Features: Order Block Detection: Identifies Bullish OBs (the last bearish candle before a strong bullish break) and Bearish OBs (the last bullish candle before a strong bearish break). Volumetric Analysis: Calculates Buy and Sell volume p指标由bensontataprofile提供2238
TPrecision MARKET PULSE Read the Energy, Not the DirectionHere's the full TradingView description text, ready to paste: MARKET PULSE — Read the Energy, Not the Direction Every indicator you've ever used tells you the same thing: which way price might go. RSI, MACD, stochastics — they're all measuring direction in different ways. Market Pulse does something fundamentally different. It measures the energy state of the market — the rhythm underneath price that exists before any move happens. The concept is simple: markets breathe. Before every significan指标由dtprecision提供已更新 16
river 10 min **This strategy was specially developed for the RIVERUSDT pair, combining advanced moving average techniques with continuous optimization to capture high-quality trading opportunities. It is designed to enhance trend detection, improve entry timing, and adapt more effectively to changing market conditions. The result is a more refined and dynamic trading approach aimed at maximizing potential performance while maintaining a structured and disciplined methodology.** אם אתה רוצה, אכתוב לך עכשיו策略由lazyk42提供14
3A Setup + Order Flow3A Setup + Order Flow Indicator Combines Fabio's 3A Strategy (Absorption + Accumulation + Aggression) with Order Flow volume analysis. ━━━━━━━━━━━━━━━━━━━━ 📊 ORDER FLOW BUBBLES ━━━━━━━━━━━━━━━━━━━━ Volume bubbles sized by relative volume vs moving average: • 🟢 Green = Buy Dominant (strong bullish body or long lower wick) • ⚫ Black = Sell Dominant (strong bearish body or long upper wick) • 🟡 Yellow = Neutral (high volume but no clear direction) Bubble size: Small → Normal → Large → Huge Base指标由smalldon提供已更新 80
Blanco V3 (PRO MTF System)**Blanco V3 – Advanced Precision Trading System** Blanco V3 is the next evolution of the Blanco series, designed to deliver **precision entries, stronger confirmations, and cleaner decision-making**. It builds on the foundation of Blanco V1 and V2 by enhancing timing, filtering noise, and introducing smarter multi-timeframe alignment. At its core, Blanco V3 uses a **Zero Lag EMA (ZLEMA)** to reduce delay and detect trend direction faster than traditional indicators. Combined with advanced filt指标由blancoaby01提供51