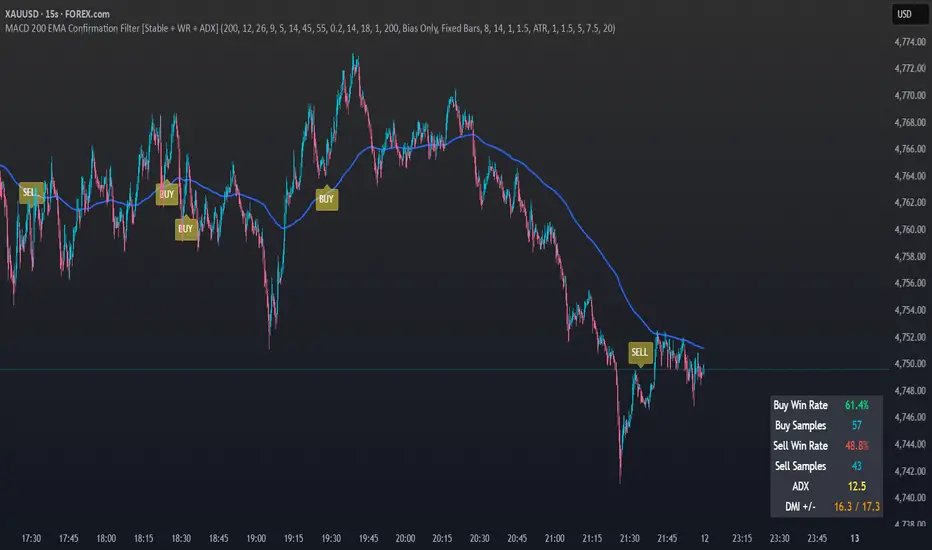
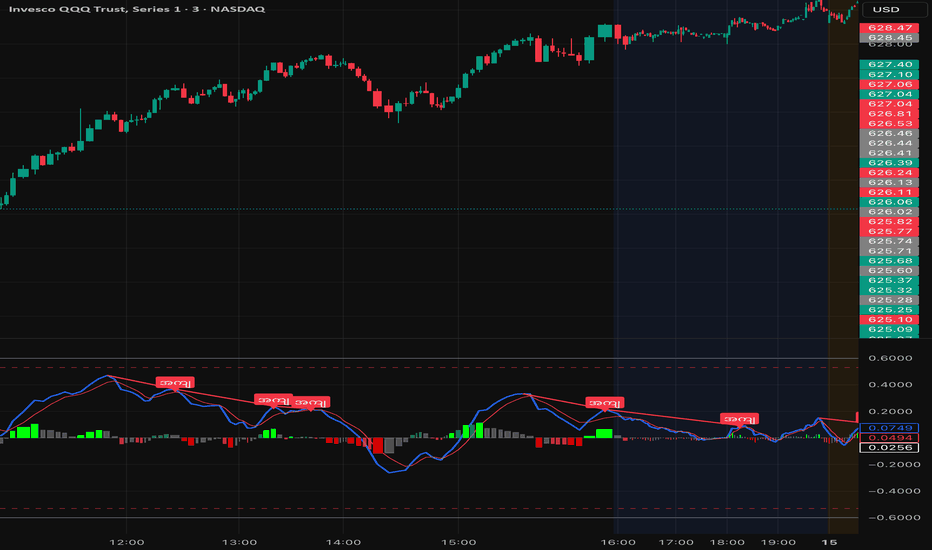
MACD Oscillator with RSI Release Note: Multi-Layered Smoothed MACD + RSI & Volume Filter
Overview
This indicator is a sophisticated evolution of the classic MACD, specifically engineered for traders who require high-precision momentum analysis. By combining Smoothing Algorithms, Relative Strength (RSI), and Volume Validation, it filters out market "noise" and highlights true institutional momentum shifts.
Key Features
1. Advanced Smoothing (HMA/EMA)
Standard MACD lines can be "choppy" in volatile markets. This version includes a built-in Hull Moving Average (HMA) and EMA smoothing toggle.
• Benefit: Eliminates "fake" crossovers while maintaining a snappy response to price action, ideal for scalping or day trading.
2. 6-Color Volume-Weighted Histogram
The histogram doesn't just show momentum; it shows the conviction behind it.
• Bright Green/Red: Momentum is growing AND volume is above the 20-period average (Institutional Buying/Selling).
• Teal/Maroon: Momentum is growing on standard volume.
• Faded Colors: Momentum is beginning to shift or "dry up," providing an early exit signal.
3. Embedded & Normalized RSI
An RSI line is embedded directly into the MACD pane, normalized to the same scale.
• Context: Quickly identify if a MACD crossover is happening in Overbought (0.4/RSI 70) or Oversold (-0.4/RSI 30) territory without switching panes.
4. Automated Rolling Divergence
The script features a custom divergence engine that tracks price action against the smoothed MACD.
• Visuals: Automatically draws Bearish (Red) and Bullish (Green) divergence lines and plots Burmese-labeled signals (အရောင်း / အဝယ်) for immediate recognition.
5. Institutional Thresholds
Horizontal lines are set at 0.4 and 0.5 levels. These act as "Extreme Momentum" zones, helping traders identify when a move is likely overextended and due for a mean reversion.
How to Use
• The High-Probability Entry: Look for a MACD crossover accompanied by Bright Green/Red histogram bars and Divergence confirmation.
• The Early Exit: Watch for the histogram to transition to a faded color, indicating that the trend is losing volume support even if the price is still moving.
Settings
• Smoothing Type: Choose between None, EMA, or HMA.
• Smooth Length: Adjust the "snappiness" of the line.
• Show RSI: Toggle the embedded RSI line on/off.
• Show Lines: Toggle the visual divergence connecting lines.
Technical Details
• Version: Pine Script v6
• Scaling: Normalized to accommodate both MACD and RSI data.
• Best Timeframes: Optimized for 1m, 3m, and 5m charts.
Disclaimer: Trading involves risk. This tool is for educational and analytical purposes and should be used in conjunction with a complete trading plan. 指标
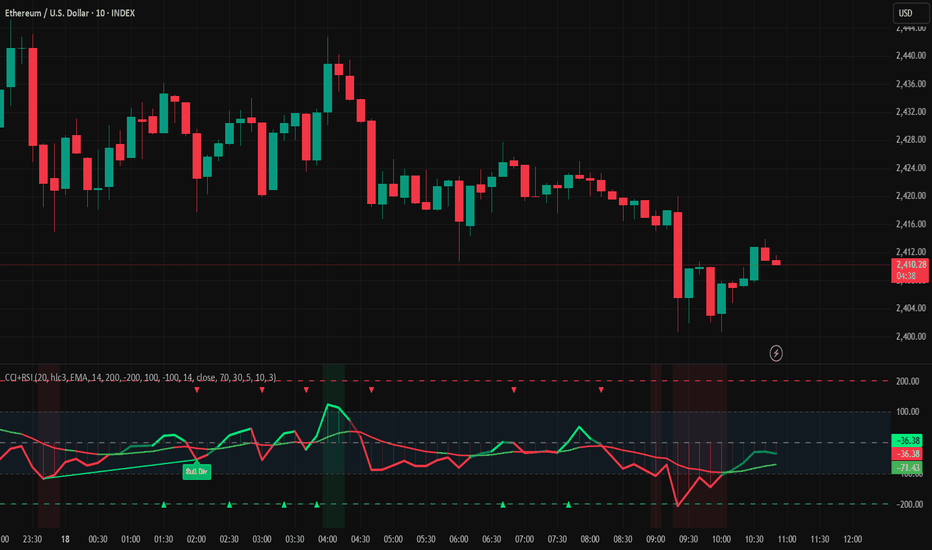
SHK CCI+RSI Merged | HA Signal MA | Dual Divergence | v6// ============================================================================
// DISCLAIMER: This script is for educational purposes only.
// The author is NOT responsible for any trading losses.
// Past performance does not guarantee future results.
// Trade entirely at your own risk.
// ============================================================================
━━━━━━━━━━━━━━━━━━━━━━━━━━━━━━━━━━━━━━━━
🔷 SHK CCI+RSI MERGED — CLEAN 2-LINE OSCILLATOR
Powered by Pine Script v6
━━━━━━━━━━━━━━━━━━━━━━━━━━━━━━━━━━━━━━━━
Stop cluttering your chart with two separate oscillators.
This indicator fuses CCI and RSI into ONE intelligent
blended line — giving you stronger, more reliable signals
with less noise.
━━━━━━━━━━━━━━━━━━━━━━━━━━━━━━━━━━━━━━━━
📐 HOW THE BLEND WORKS
━━━━━━━━━━━━━━━━━━━━━━━━━━━━━━━━━━━━━━━━
RSI is first normalized onto the CCI scale:
• RSI 50 → 0 (neutral / zero line)
• RSI 70 → +100 (overbought boundary)
• RSI 30 → -100 (oversold boundary)
Then both are averaged into one line:
➤ Blended = ( CCI + Normalized RSI ) / 2
The ±100 and ±200 levels now represent overbought
and oversold zones for BOTH indicators at once.
If RSI is disabled, the line falls back to pure CCI.
━━━━━━━━━━━━━━━━━━━━━━━━━━━━━━━━━━━━━━━━
📊 WHAT YOU SEE — ONLY 2 LINES
━━━━━━━━━━━━━━━━━━━━━━━━━━━━━━━━━━━━━━━━
● LINE 1 — CCI+RSI Blended (thick)
Color changes dynamically based on position
relative to the Signal MA and zero line:
🟢 Bright Green → above MA + above zero (strong bull)
🟢 Faded Green → above MA + below zero (weak bull)
🔴 Bright Red → below MA + below zero (strong bear)
🔴 Faded Red → below MA + above zero (weak bear)
● LINE 2 — Signal MA (EMA / SMA / WMA)
Colored by Heikin Ashi candle direction:
🟢 Green MA → HA candle is bullish (trend rising)
🔴 Red MA → HA candle is bearish (trend falling)
The MA color flip is your early trend change warning —
before price confirms the move.
● HISTOGRAM — Strength Bars
Displayed behind the lines. Brighter color = deeper
into overbought / oversold territory.
━━━━━━━━━━━━━━━━━━━━━━━━━━━━━━━━━━━━━━━━
📉 DUAL DIVERGENCE ENGINE
━━━━━━━━━━━━━━━━━━━━━━━━━━━━━━━━━━━━━━━━
Two independent divergence detectors run simultaneously:
🟩 CCI+RSI Divergence (solid lines)
Pivot-based detection on the blended oscillator vs price:
• Lime solid line + "Bull Div" → Bullish divergence
• Red solid line + "Bear Div" → Bearish divergence
🟦 RSI-Only Divergence (dashed lines)
Detected on raw RSI pivots, plotted at normalized scale:
• Aqua dashed + "RSI Bull Div" → RSI bullish divergence
• Orange dashed + "RSI Bear Div" → RSI bearish divergence
Both engines use adjustable lookback and threshold
settings so you can tune sensitivity to your style.
━━━━━━━━━━━━━━━━━━━━━━━━━━━━━━━━━━━━━━━━
⚡ ZERO LINE CROSSES
━━━━━━━━━━━━━━━━━━━━━━━━━━━━━━━━━━━━━━━━
🔼 Green triangle at bottom → crossed above zero (bull)
🔽 Red triangle at top → crossed below zero (bear)
━━━━━━━━━━━━━━━━━━━━━━━━━━━━━━━━━━━━━━━━
🎨 EXTREME ZONE BACKGROUND
━━━━━━━━━━━━━━━━━━━━━━━━━━━━━━━━━━━━━━━━
Background shading activates when blended is in
an extreme zone (beyond ±100 and above/below MA):
🟢 Green background → strong bullish pressure
🔴 Red background → strong bearish pressure
━━━━━━━━━━━━━━━━━━━━━━━━━━━━━━━━━━━━━━━━
🔔 BUILT-IN ALERTS (14 CONDITIONS)
━━━━━━━━━━━━━━━━━━━━━━━━━━━━━━━━━━━━━━━━
✅ Strong Bullish signal (blended > +100 & above MA)
✅ Strong Bearish signal (blended < -100 & below MA)
✅ Zero line cross — bullish & bearish
✅ CCI+RSI crossed above +100
✅ CCI+RSI crossed below -100
✅ Overbought zone entry & exit
✅ Oversold zone entry & exit
✅ RSI crossed overbought / oversold
✅ RSI crossed above / below midline (50)
✅ Heikin Ashi flipped bullish (MA turns green)
✅ Heikin Ashi flipped bearish (MA turns red)
━━━━━━━━━━━━━━━━━━━━━━━━━━━━━━━━━━━━━━━━
⚙️ SETTINGS & CUSTOMIZATION
━━━━━━━━━━━━━━━━━━━━━━━━━━━━━━━━━━━━━━━━
CCI Settings
• Length (default 20), Source (default HLC3)
• Signal MA type: EMA / SMA / WMA
• Signal MA length (default 14)
CCI Levels
• Overbought: +200 | Oversold: -200
• Upper level: +100 | Lower level: -100
RSI Settings
• Enable / disable RSI blend
• Length (default 14), Source (default Close)
• OB / OS levels (default 70 / 30)
Features (each individually toggleable)
• CCI+RSI divergence lines
• RSI-only divergence lines
• Trend strength histogram
• Zero line cross markers
• Extreme zone background shading
Divergence Settings
• Lookback bars (1–20)
• CCI divergence threshold
• RSI divergence threshold
━━━━━━━━━━━━━━━━━━━━━━━━━━━━━━━━━━━━━━━━
💡 WORKS BEST WITH
━━━━━━━━━━━━━━━━━━━━━━━━━━━━━━━━━━━━━━━━
• Key support and resistance levels on price chart
• VWAP or Volume Profile for confluence
• Higher timeframe trend bias confirmation
• All markets: Equities, Futures, Forex, Crypto, Commodities
• All timeframes: Scalping to Swing trading
━━━━━━━━━━━━━━━━━━━━━━━━━━━━━━━━━━━━━━━━
⚠️ DISCLAIMER
━━━━━━━━━━━━━━━━━━━━━━━━━━━━━━━━━━━━━━━━
This indicator is published for EDUCATIONAL and
INFORMATIONAL purposes only.
❌ This is NOT financial advice.
❌ This is NOT a buy or sell recommendation.
❌ Past performance does NOT guarantee future results.
Trading financial instruments including stocks, futures,
forex, commodities and cryptocurrencies involves
SUBSTANTIAL RISK OF LOSS and is not suitable for
every investor or trader.
The creator — SHK — is NOT responsible for any trading
losses, damages or financial consequences resulting
from the use or misuse of this indicator.
All trading decisions are SOLELY YOUR OWN RESPONSIBILITY.
You agree to trade entirely at YOUR OWN RISK.
Always conduct your own due diligence and consult a
qualified financial advisor before making any trading
or investment decisions.
By using this indicator you acknowledge and fully accept
all risks and release the author from any liability.
📌 TRADE SMART. MANAGE YOUR RISK. PROTECT YOUR CAPITAL.
━━━━━━━━━━━━━━━━━━━━━━━━━━━━━━━━━━━━━━━━ 指标
指标
指标

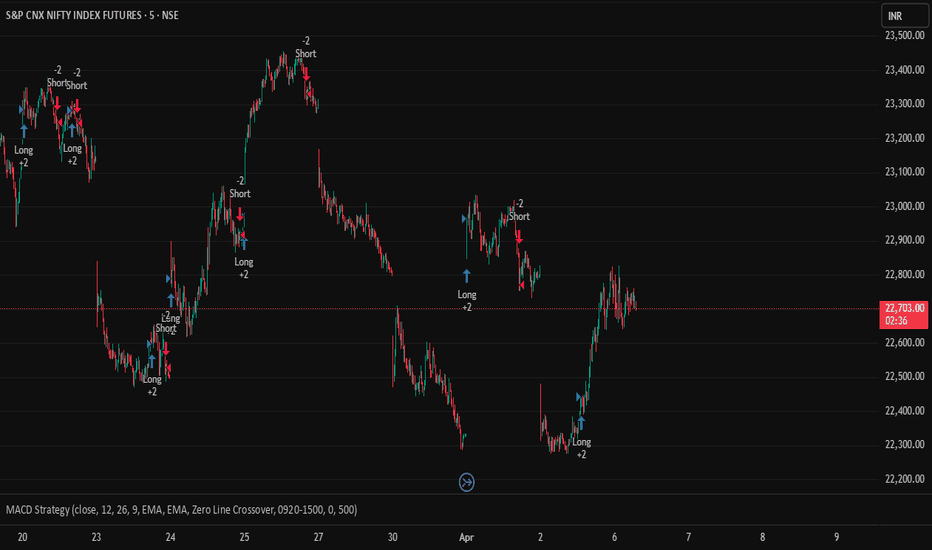
MACD Pro Signals Full v8.52. Detailed Description (Large Text Box)
🌟 Indicator Introduction
This is a full-featured enhanced MACD indicator. Based on the classic MACD formula, it adds advanced visual upgrades, signal enhancements, and automatic divergence detection. It is suitable for all markets such as Stocks, Futures, Forex, and Cryptocurrencies.
It helps you quickly identify trends, momentum, trading signals, and reversal opportunities at a glance.
✨ Core Features
Color-Coded Momentum HistogramAutomatically distinguishes 4 states: Strong Bullish / Weak Bullish / Strong Bearish / Weak Bearish.Clearly shows the strength of current momentum and trend continuity, making it easy to judge whether the price is accelerating or weakening.
MACD & Signal Line Candle VisualizationConverts the traditional MACD line and Signal line into candlestick style.The color changes automatically with upward/downward trends, making trend turning points and momentum more intuitive than traditional lines.
Dual-Position Golden/Death Cross Markers
Main Chart: Displays "👍" (Golden Cross) and "👎" (Death Cross) above/below price bars for clear entry signals.
Subwindow: Synchronous markers on the MACD area, no overlap on the main chart, double confirmation without missing signals.
Auto Bullish/Bearish Divergence DetectionAutomatically scans price and MACD divergence structures.Draws divergence lines in the subwindow and marks strength percentage (0-100%) on the main chart.Perfect for capturing high-probability trend reversals.
Full CustomizationSupports adjusting MACD periods, all element colors, label offsets, and pivot parameters.Adaptable to different assets and time frames.
📊 How to Use
Bullish Signal: Golden Cross 👍 + Zero Line Above + Expanding Bullish Histogram + Bullish Divergence = Strong Long Opportunity
Bearish Signal: Death Cross 👎 + Zero Line Below + Expanding Bearish Histogram + Bearish Divergence = Strong Short Opportunity
Divergence Usage: The higher the percentage, the stronger the divergence signal, and the higher the probability of a trend reversal. 指标

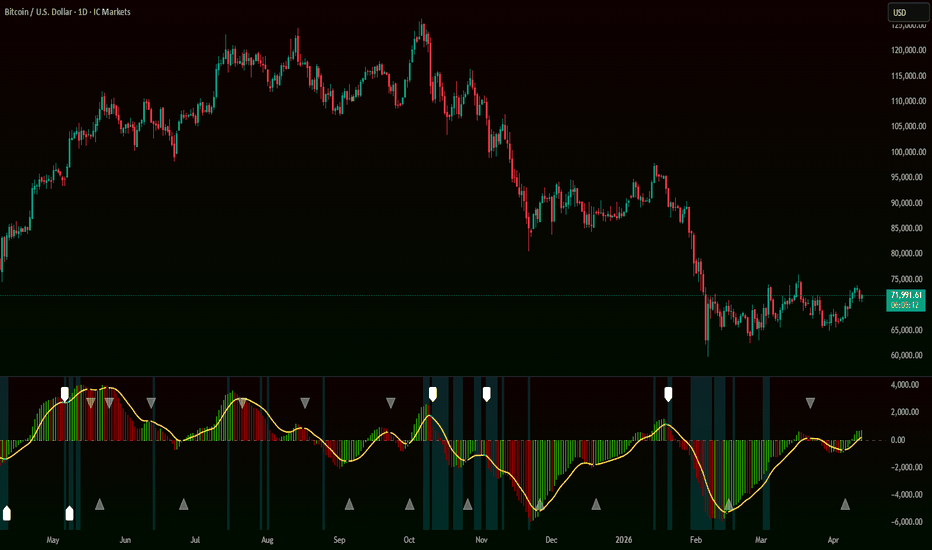
MACD-MDO Volume [Zofesu]The divergence detection logic and three-tier signal architecture represent original implementation that requires source protection.
01 — Overview
What is MACD-MDO Volume?
MACD-MDO Volume is a momentum divergence oscillator built on a modified MACD architecture. MDO stands for Momentum Divergence Oscillator — the core purpose of this indicator is not to replicate standard MACD behavior, but to detect momentum reversals through a combination of histogram shrinkage, signal line turns, and volume confirmation.
The result is a three-tier signal system: no signal, weak signal, and volume-confirmed signal — each with distinct visual output so you can instantly assess the quality of what the oscillator is showing.
Key difference from standard MACD:
The histogram displays the raw MACD line — not the MACD minus signal difference. This provides a cleaner read of absolute momentum direction, while the signal line acts as a dynamic reference overlay. The focus is on momentum turning points, not crossovers.
02 — How It Works
Three-Layer Detection
Every bar, the indicator runs three independent checks. All three must align for the strongest signal.
📉 Layer 1 — Histogram Shrinkage
The indicator checks whether the histogram has been losing absolute magnitude over the configured lookback period. Shrinking momentum — regardless of direction — is the first condition for a potential reversal signal.
🔄 Layer 2 — Signal Line Turn
The signal line (EMA of the MACD line) must complete a directional turn — from descending to ascending for a bull signal, or from ascending to descending for a bear signal. This confirms the momentum shift is not just noise.
📊 Layer 3 — Volume Confirmation
Current volume is compared against a rolling average. If volume exceeds the threshold (average × multiplier), the signal is considered volume-confirmed — indicating institutional participation behind the momentum shift.
Signal Strength Tiers
Layer 1 + Layer 2 = Weak signal — momentum reversal detected, no volume confirmation.
Layer 1 + Layer 2 + Layer 3 = Strong signal — momentum reversal confirmed by volume.
No layers = Normal state — no divergence, signal line in standard color.
03 — Visual Elements
What You See on the Chart
Histogram — four color states based on position and direction:
Rising (positive)
Histogram positive and increasing. Strong bullish momentum building.
Fading (positive)
Histogram positive but decreasing. Bull momentum losing strength.
Recovering (negative)
Histogram negative but increasing. Bear momentum losing strength.
Falling (negative)
Histogram negative and decreasing. Strong bearish momentum building.
Signal Line — three color states:
🟡 Yellow — Normal
No divergence detected. Standard momentum read. No action required.
⚫ Black — Weak
Divergence detected but volume not confirmed. Caution — possible reversal without institutional backing.
🔵 Cyan — Strong
Divergence detected AND volume confirmed. Highest quality signal. Institutional participation likely.
Arrows
⬆ Large white label arrow — Volume-confirmed bull signal. Appears below the zero line.
⬇ Large white label arrow — Volume-confirmed bear signal. Appears above the zero line.
△ Small gray triangle — Weak bull signal, no volume. Lower confidence.
▽ Small gray triangle — Weak bear signal, no volume. Lower confidence.
Background highlight — cyan/teal background appears on bars where volume exceeds the threshold. Marks bars with elevated institutional activity regardless of signal state.
04 — Settings
Configuration Parameters
Group - Parameter - Default - Description
MACD - Fast EMA - 12 - Period of the fast EMA. Lower = more sensitive to recent price changes.
MACD - Slow EMA - 26 - Period of the slow EMA. Difference between fast and slow forms the MACD line.
MACD - Signal EMA - 9 - Smoothing period for the signal line (EMA of MACD line).
Volume - Volume MA Length - 55 - Lookback period for the average volume baseline used in confirmation.
Volume - Volume Multiplier - 1.3 - Volume must exceed this multiple of the average to confirm a signal. 1.3 = 30% above average. Higher = stricter confirmation.
Divergence - Divergence Lookback - 3 - Bars back to check for histogram shrinkage. Higher = more sensitive, more signals. Lower = stricter, fewer but more reliable signals. Range: 1–10.
Volume Multiplier guide:
1.0 = any volume above average triggers confirmation — too many signals on most assets.
1.3 = 30% above average — good balance for D1 on most major assets (default).
1.5–2.0 = only significant volume spikes confirm — fewer but higher-quality signals.
Divergence Lookback guide:
1–2 = conservative — checks fewer bars, stricter condition, fewer but more reliable signals.
3 = balanced default, works well on D1 and H4.
5–10 = sensitive — more bars checked, higher chance of detecting shrinkage, more signals.
05 — How To Use
Reading and Acting on Signals
Step 1 — Watch the histogram color
Green = momentum in favor of bulls (positive or recovering). Red = momentum in favor of bears (negative or fading). Color transitions from green to red or red to green are early warnings of a potential turn.
Step 2 — Watch the signal line color
Yellow = normal, no divergence. Signal turns black = weak divergence detected, start watching. Signal turns cyan = volume-confirmed divergence — highest attention required.
Step 3 — Arrow appears
Large white label arrow = strong signal, act with higher confidence. Small gray triangle = weak signal, use only with strong price action confirmation at a key S/R level.
Step 4 — Check background highlight
Cyan background = elevated volume on that bar. If an arrow and background highlight coincide, institutional participation is confirmed. This is the highest quality confluence this indicator can produce.
Best timeframes:
D1 and H4 produce the most reliable signals with default settings. On lower timeframes (H1, M15) consider tightening the Volume Multiplier to 1.5+ to reduce noise. The indicator works on all asset classes — each may require minor parameter adjustments.
Important: A signal without price structure context is incomplete. Always confirm with a key S/R level, trend direction, or structure break before entering. Weak signals (gray triangles) should only be acted on in strong confluence setups. Strong signals (white arrows) are higher quality but still require context.
06 — Alerts
Built-In Alert Conditions
Four alert conditions are pre-configured and available in TradingView's alert system:
🔔 MDO Vol — Long Confirmed
Fires on volume-confirmed bull divergence. Highest priority alert.
🔔 MDO Vol — Short Confirmed
Fires on volume-confirmed bear divergence. Highest priority alert.
🔕 MDO — Long Weak
Fires on bull divergence without volume confirmation. Use as early warning only.
🔕 MDO — Short Weak
Fires on bear divergence without volume confirmation. Use as early warning only.
Alert message format:
Alerts include ticker and timeframe automatically:
LONG confirmed — momentum reversal UP + volume on BTCUSD 1D 指标
指标
指标

Momentum Fusion Index: Dual-MTF RSI & MACD Momentum Fusion Index: Dual-MTF RSI & MACD
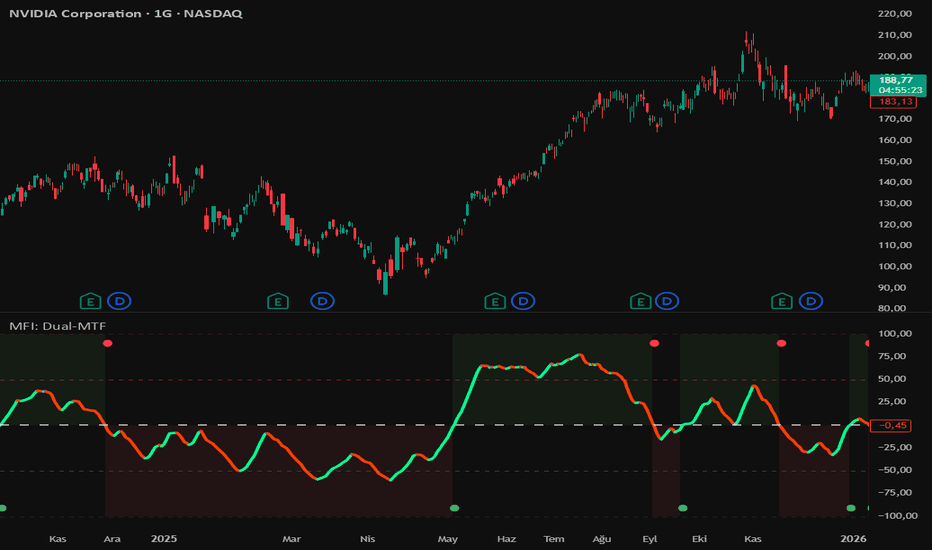
The Momentum Fusion Index (MFI) is a high-performance hybrid engine that merges the precision of RSI with the trend-following power of MACD into a unified, noise-filtered oscillator. This version introduces Dual-MTF (Multi-Timeframe) Logic, allowing traders to bridge the gap between short-term execution and long-term trend direction within a single indicator panel.
🚀 Key Features
* Dual-MTF Engine: Analyze two timeframes simultaneously. Stay on your execution chart (e.g., 5m or 15m) while monitoring the high-level momentum (e.g., 1H or 4H) on a secondary, non-intrusive line.
* Symmetrical Fusion Logic: Standard RSI (0–100) and MACD (unbounded) are mathematically transformed into a balanced -100 to +100 scale, providing a standardized environment for momentum analysis.
* Dynamic Normalization: The script utilizes a 200-bar Normalization Range to anchor the MACD within fixed boundaries, making it easy to identify historical extremes and exhaustion points.
* Directional Adaptive Coloring: The primary signal line changes color based on its trajectory. Bright Green signals accelerating bullish momentum, while Vibrant Red signals a momentum slowdown or bearish shift.
🧠 Mathematical Logic
The MFI operates by calculating the relative position of the MACD within its recent range and merging it with a centered RSI. This ensures that the oscillator doesn't just show if a trend is "up," but how much "power" is behind that move relative to both price history and oscillator strength. By fusing these two, it offsets the lagging nature of MACD with the leading characteristics of RSI.
🛠️ How to Use
1. Confluence Trading: Enable the Secondary Timeframe in settings. When both the Primary (thick) and Secondary (thin) lines align in the same direction above or below the Zero Line, you have a high-probability momentum setup.
2. The Zero-Line Pivot: Crosses above the Zero Balance Line mark bullish transitions, while crosses below mark bearish momentum shifts.
3. The Power Zones (±50): Momentum is considered "High Conviction" when the line sustains itself above +50 (Strong Bull) or below -50 (Strong Bear).
4. Momentum Exhaustion: When the Fusion line hits the ±100 Extremes, watch for price exhaustion and potential mean-reversion.
⚙️ Settings
* Primary Timeframe: Set the main calculation TF. Leave empty to auto-lock to your current chart.
* Secondary Timeframe (MTF 2): Toggle this on to overlay a second time-period (e.g., Daily) for macro trend confirmation.
* Fusion Core: Customize RSI periods and MACD EMA lengths to suit your specific asset.
* Smoothing: Adjust the Fusion Smoothing to filter out noise or increase responsiveness.
📌 Credits & Origins
This work is a synthesis of the foundational mathematics pioneered by J. Welles Wilder (RSI) and Gerald Appel (MACD). It is designed for traders who require a mathematically grounded, unified view of market strength.
Disclaimer: All indicators are probabilistic. The Momentum Fusion Index is a decision-support tool and does not guarantee profits. Always use stop-losses and follow your risk management plan. 指标
Fade The Crowd Protocol >_A structured contrarian system that deliberately inverts conventional MACD + VWMA momentum signals — entering short when the crowd goes long, and long when the crowd goes short. Filtered by ADX, Choppiness Index, and a configurable cooldown timer, the strategy ensures fades execute only at statistically credible exhaustion points, not into directionless noise. Exits are managed through ATR%-normalized take profit and stop loss levels anchored to fill price, with a hard-cap Plug stop bounding maximum loss on every trade.
═══════════════════════════════════════
THE CONTRARIAN PREMISE
═══════════════════════════════════════
When a conventional momentum setup reaches full confirmation — MACD crossover, positive histogram, price at or above VWMA — the crowd is already positioned. Late-stage consensus entries carry elevated mean-reversion risk. The Fade The Crowd Protocol identifies that exact moment of crowd consensus and enters against it.
This is not arbitrary signal flipping. The inversion is applied to a well-defined, multi-condition setup. ADX and Choppiness filters ensure the fade occurs within a trending, structured market environment. A cooldown timer enforces separation between trades, preventing rapid re-entry after stop-outs.
═══════════════════════════════════════
THE INVERSION LOGIC
═══════════════════════════════════════
Conventional long setup → Fade The Crowd goes SHORT
Condition: MACD crossover + histogram above zero + price touches or exceeds VWMA
Crowd interpretation: Bullish momentum confirmed, late buyers entering
Fade interpretation: Crowd is fully long — exhaustion and reversion risk is elevated
Conventional short setup → Fade The Crowd goes LONG
Condition: MACD crossover + histogram below zero + price touches or falls to VWMA
Crowd interpretation: Bearish momentum confirmed, late sellers entering
Fade interpretation: Crowd is fully short — bounce and reversion risk is elevated
Both directions additionally require: CHOP below threshold, ADX above threshold, cooldown timer cleared, and no existing open position.
═══════════════════════════════════════
KEY FEATURES
═══════════════════════════════════════
Signal Inversion Engine
— MACD crossover (either direction) as the base crowd-consensus event
— Histogram sign identifies which direction the crowd is leaning
— VWMA touch confirms price has aligned with the dominant crowd position
— Entry is taken against all three simultaneously satisfied conditions
Cooldown Timer
— Tracks bar index at every trade exit via last_exit_bar variable
— All new entries blocked for a configurable number of bars post-exit
— Prevents rapid re-entry sequences following volatile stop-out events
— Configurable independently of all other filters
ADX + Choppiness Index Filters
— CHOP below threshold confirms the market exhibits directional structure
— ADX above threshold confirms sufficient trend force at signal bar
— Both filters must pass simultaneously with the inversion signal
— Prevents fading in low-conviction, oscillating environments where mean reversion is unreliable
Two-Step ATR% Exit Architecture
— ATR% captured and stored at trigger bar before entry executes
— TP and SL calculated from strategy.position_avg_price on first position bar
— Exit levels locked — no recalculation on subsequent bars
— TP HIT and SL HIT comments displayed on chart for post-hoc analysis
The Plug — Hard Stop Architecture
— Independent hard percentage stop applied to every trade
— For longs: fill_price × (1 − Plug%). For shorts: fill_price × (1 + Plug%)
— Compared against ATR SL using math.max() / math.min() — tighter stop always applied
— Ensures maximum loss is bounded regardless of ATR expansion at entry
═══════════════════════════════════════
HOW IT WORKS
═══════════════════════════════════════
Step 1 — Crowd Consensus Detection
The strategy evaluates three conditions that define a fully-formed conventional momentum signal: MACD has crossed its signal line (ta.cross), the MACD histogram confirms directional bias (above zero for bullish, below for bearish), and price has touched or breached the VWMA in the same direction (high >= VWMA for bullish, low <= VWMA for bearish). When all three align, the crowd is fully positioned.
Step 2 — Environment Filtering
Choppiness Index below threshold confirms the market is not ranging — a prerequisite for meaningful momentum exhaustion. ADX above threshold confirms trend force exists. Cooldown timer confirms sufficient bar-distance from the prior trade exit. All three environmental conditions must pass simultaneously with the crowd signal.
Step 3 — Contrarian Entry
The strategy enters in the opposite direction to the crowd consensus: short against the bullish setup, long against the bearish setup. ATR% at the trigger bar is captured into stored_atr_pct before the entry order executes.
Step 4 — Exit Level Calculation
On the first bar where position size is non-zero (position just opened), TP and SL prices are calculated using strategy.position_avg_price and the stored ATR%. The Plug stop is calculated independently. math.max() (longs) or math.min() (shorts) selects whichever stop is tighter. All levels are stored in fixed variables and passed to strategy.exit() — no dynamic recalculation occurs mid-trade.
═══════════════════════════════════════
WHY MACD + VWMA AS THE CROWD PROXY
═══════════════════════════════════════
MACD is one of the most widely used momentum indicators in retail trading. VWMA incorporates volume-weighted price — a common institutional reference level. Together, they define a setup that is broadly taught, widely traded, and reliably over-populated at the moment of full confirmation. The Fade The Crowd Protocol uses this familiarity as a structural edge: the more crowded the conventional signal, the more statistical force the fade carries when those positions unwind.
策略

AG Pro HTF Bias Dashboard [AGPro Series]AG Pro HTF Bias Dashboard
Overview / What it does
AG Pro HTF Bias Dashboard is a higher-timeframe context tool built for traders who want a fast, structured view of directional conditions across multiple larger timeframes without crowding the chart with extra signals, zones, or decision noise.
The script summarizes higher-timeframe bias in a compact dashboard and presents each selected row as Bull, Bear, or Neutral, together with a mode-specific status readout. The goal is not to predict the next candle or replace a full trade plan. The goal is to make larger-timeframe context easier to read at a glance.
This indicator is designed to answer a simple but important workflow question: "What is the broader directional environment across the higher timeframes I care about right now?" Instead of forcing the user to manually flip through multiple charts and compare structure or trend conditions one by one, the dashboard keeps that information visible in a single panel.
The script supports multiple bias engines so the same dashboard can be adapted to different styles of chart reading. Users can evaluate higher-timeframe context through EMA Stack alignment, confirmed Swing Structure, SuperTrend direction, or MACD Momentum agreement. This makes the tool flexible enough for trend-following traders, structure-based traders, and users who prefer momentum-style confirmation.
Unlike many overlays that try to combine entries, exits, alerts, pattern detection, and signal generation inside one study, this script stays focused on one task: higher-timeframe directional context. That single-purpose design is intentional. It keeps the output clean, readable, and easier to integrate into an existing process.
Unique Edge
The main strength of this script is not signal generation. Its edge is structured context compression.
Instead of plotting a large number of higher-timeframe elements directly on the chart, AG Pro HTF Bias Dashboard converts higher-timeframe conditions into a compact visual matrix. This makes it possible to assess multi-timeframe agreement quickly while keeping the chart itself relatively clean.
A second differentiator is the ability to switch the bias engine. The dashboard is not locked to one interpretation framework. Users can work with:
- EMA Stack, for ribbon-style alignment
- Swing Structure, for confirmed HH/HL and LH/LL progression
- SuperTrend, for ATR-based directional trend state
- MACD Momentum, for momentum agreement between line, signal, and histogram
Another important detail is the higher-timeframe validity filter. Rows that are not actually higher than the current chart timeframe are marked as Lower/EQ instead of being treated as valid higher-timeframe context. This helps keep the dashboard aligned with its intended purpose.
The script also includes confluence logic, so the user can see not only the state of each row, but also the dominant higher-timeframe bias and how many valid rows support that direction. In practice, this helps users distinguish between broad directional agreement and mixed conditions.
Methodology
The dashboard can display three to five higher-timeframe rows, depending on user settings. Each row evaluates one selected timeframe and classifies it into Bull, Bear, or Neutral.
Bias Mode options:
1) EMA Stack
This mode evaluates directional alignment using a three-EMA structure. A bullish state requires price and the EMA ribbon to be aligned in bullish order. A bearish state requires the opposite alignment. When the full sequence is not aligned, the row can remain neutral and display a partial status such as 2/3 or 1/3 rather than forcing a directional label.
2) Swing Structure
This mode uses confirmed pivot logic to read higher-timeframe structure. It looks for confirmed higher highs / higher lows or lower highs / lower lows, and then evaluates position relative to the active swing range. Because this logic depends on confirmed pivots, structure changes are naturally more selective and may appear later than faster trend models.
3) SuperTrend
This mode reads directional state using an ATR-based trend framework. It is intended for users who prefer a cleaner directional state model rather than ribbon alignment.
4) MACD Momentum
This mode classifies bias through agreement between the MACD line, signal line, and histogram. It is useful for traders who prefer momentum confirmation over structure or moving-average ordering.
The dashboard then calculates:
- the number of valid bullish rows
- the number of valid bearish rows
- the dominant higher-timeframe state
- the confluence count across valid rows
Optional chart context features are also included. Depending on settings, the script can color candles according to the active chart bias, plot the active EMA ribbon or SuperTrend on the chart, apply a subtle background tint when confluence is strong enough, and show a compact mini context tag on the chart.
States / Context Output
This indicator is a context dashboard, not an alert engine.
It does not generate buy or sell alerts, does not mark trade entries, and does not claim to identify optimal execution points. Its outputs are state-based and contextual:
- Bull
- Bear
- Neutral
- Confluence summary
- Mode-specific status text
The mini chart tag, when enabled, is only a compact summary of dominant higher-timeframe direction and current confluence. It should be read as context, not as a trade instruction.
Key Inputs
Higher Timeframes
Users can select three to five rows and define the exact higher timeframes to monitor.
Bias Mode
Choose between EMA Stack, Swing Structure, SuperTrend, and MACD Momentum.
Engine Parameters
The script exposes relevant inputs for each engine, including EMA lengths, Swing Strength, SuperTrend ATR settings, and MACD settings.
HUD Controls
The panel position and panel scale can be customized so the dashboard can fit different layouts and chart styles.
Style Controls
Users can adjust theme and directional colors for bullish, bearish, and neutral states.
Chart Context Controls
Optional features include candle coloring, active indicator plotting for EMA / SuperTrend, strong-confluence background tinting, mini context tag visibility, tag anchor, tag offset, and tag font size.
Limitations & Transparency
This script is not a prediction model. It summarizes directional context from user-selected higher-timeframe logic.
Higher-timeframe tools can update only when data from those larger intervals updates. Because of that, the dashboard should be understood as a context layer rather than a real-time trigger engine.
Swing Structure mode uses confirmed pivots. That means structure changes may appear later than faster directional methods, because confirmation requires completed pivot information.
Neutral states do not necessarily mean the market is untradeable. They simply indicate that the selected bias engine does not currently show clear directional alignment under the chosen rules.
The confluence count is a summary statistic, not a quality score. A larger number of aligned rows does not automatically mean a better trade. It only means more selected higher-timeframe rows currently point in the same direction.
Rows marked Lower/EQ are excluded from valid higher-timeframe confluence because they are not above the active chart timeframe.
This script is intended to support discretionary analysis and chart organization. It should be combined with the user’s own execution framework, risk model, and market understanding.
Risk Disclosure
This indicator is provided for analysis and educational use. It does not provide financial advice, investment advice, or guaranteed outcomes.
Market conditions can change quickly, and no single indicator or dashboard can remove uncertainty from trading or investing. Users should evaluate higher-timeframe context together with price action, liquidity, volatility, risk management, and their own decision process.
Past behavior, historical alignment, or current confluence does not guarantee future performance.
指标

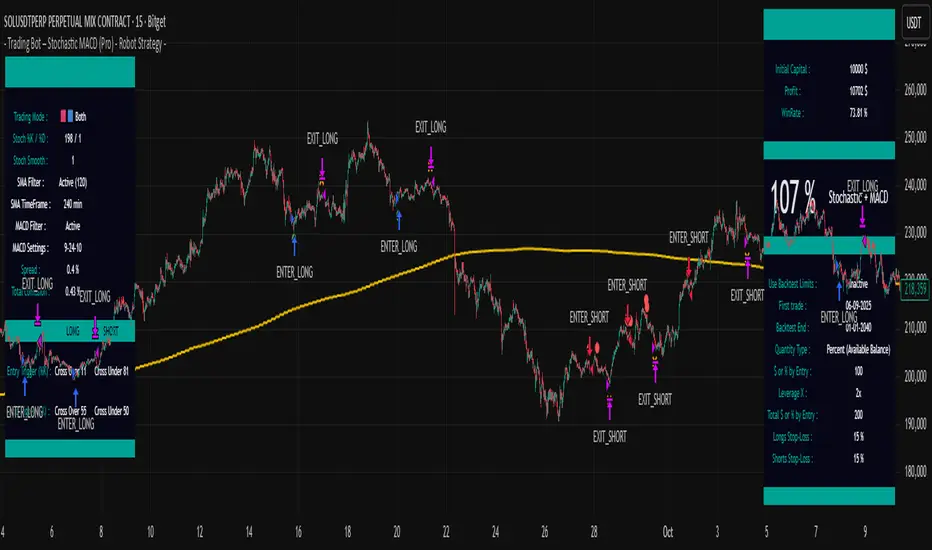
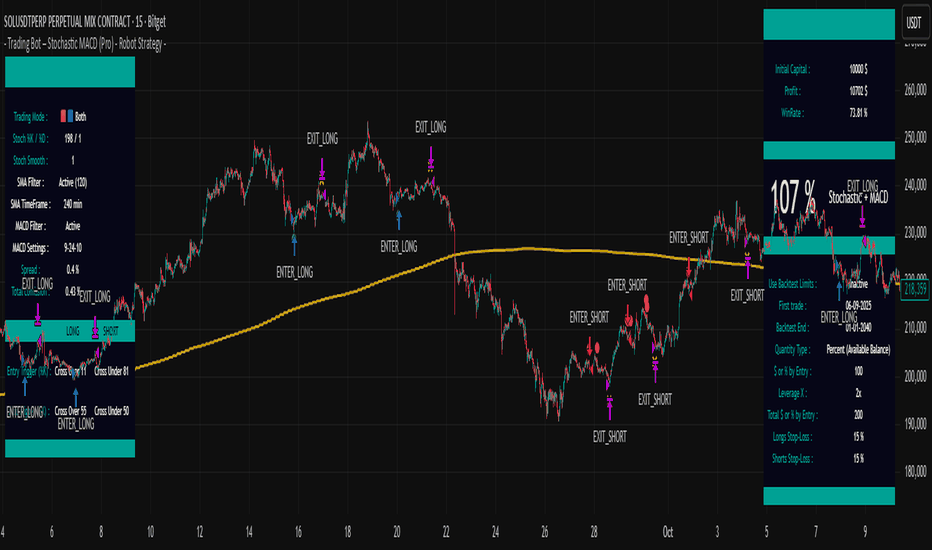
- Trading Bot - Stochastic MACD (Pro) - Robot Strategy -OVERVIEW
The Stochastic MACD (Pro) strategy is an automation-first trend-following and momentum system that combines three distinct analytical layers: a Stochastic oscillator for overbought/oversold detection, a MACD filter for trend confirmation, and an optional multi-timeframe SMA filter for macro trend alignment. It is designed from the ground up to be operated by a trading bot: every signal is accompanied by a complete set of structured trading parameters transmitted through TradingView's alert system via invisible plot() outputs embedded in a JSON webhook payload. The bot receives the trade direction, quantity type, leverage, position amount, and stop-loss levels with every alert — enabling fully autonomous order execution without any manual intervention.
Unlike standard stochastic strategies that trade on simple crossovers, this strategy uses raw %K threshold crossings with independent entry and exit levels, confirmed by MACD trend direction, creating a multi-factor confirmation system that filters out low-probability signals. The strategy is optimized for single-entry, single-exit operation (no pyramiding), making it ideal for clean automation.
BUILT FOR AUTOMATION — JSON WEBHOOK INTEGRATION
A core differentiator of this strategy is its complete automation-readiness. The script does not simply generate buy/sell alerts — it transmits a full set of structured trading parameters on every signal, designed to be consumed by a webhook-based trading bot.
The strategy uses Pine Script's plot() function with display=display.none to create invisible data channels. These plots do not appear on the chart but are accessible via TradingView's {{plot("PlotName")}} placeholder in alert messages. Combined with TradingView's built-in variables ({{ticker}}, {{strategy.order.comment}}, {{interval}}), this enables the construction of a complete JSON payload such as:
{
"ticker": "{{ticker}}",
"comment": "{{strategy.order.comment}}",
"interval": "{{interval}}",
"trading_mode": {{plot("TradingMode")}},
"qty_type": {{plot("TypeOfQty")}},
"leverage": {{plot("UserLeverage")}},
"amount_pct": {{plot("UserAmount")}},
"stop_loss_long_pct": {{plot("StopLossLong")}},
"stop_loss_short_pct": {{plot("StopLossShort")}}
}
What each field transmits:
comment: The order action — ENTER_LONG, EXIT_LONG, ENTER_SHORT, or EXIT_SHORT — telling the bot exactly what to do.
ticker: The asset symbol, so a single bot instance can manage multiple assets.
interval: The chart timeframe, allowing the bot to validate that the signal matches the expected configuration.
trading_mode: A numeric code indicating the active trading mode.
qty_type: A numeric code indicating the position sizing method (1=Percent Available, 2=Percent Total, 3=Cash).
leverage: The configured leverage multiplier, so the bot can place correctly sized orders on the exchange.
amount_pct: The configured amount (% or $) per entry.
stop_loss_long_pct / stop_loss_short_pct: The stop-loss percentages for each direction (100 = disabled).
This architecture means the bot does not need to be separately configured with position sizes or risk parameters — everything is defined once in the TradingView strategy settings and automatically transmitted with every alert. Changing a parameter in the strategy immediately updates what the bot receives, ensuring permanent synchronization between backtest settings and live execution.
WHAT MAKES THIS STRATEGY ORIGINAL
Raw %K threshold crossings (not smoothed crossovers): Standard stochastic strategies use %K/%D crossovers to generate signals. This strategy instead monitors when the raw %K line crosses specific threshold levels (default: 14% for long entry, 85% for short entry). This provides more precise timing and avoids the lag introduced by %D smoothing. The %K period is intentionally set to a high value (default: 150), creating a slow stochastic that captures larger-scale momentum cycles rather than noise.
Separate entry and exit thresholds: Long entry triggers when %K crosses above 14%, while long exit triggers when %K exceeds 55%. Short entry triggers when %K crosses below 85%, with short exit when %K falls below 50%. These four independent levels allow fine-tuning of trade timing and holding duration — a flexibility not available in simple crossover scripts.
MACD directional filter: When enabled (default), the MACD filter requires the MACD line to be above the signal line for longs (bullish momentum), and the signal line to be above MACD for shorts (bearish momentum). This prevents counter-trend entries during strong directional moves.
Multi-timeframe SMA filter: An optional 200-period SMA calculated on a configurable higher timeframe (default: 4-hour) restricts entries to the dominant macro trend: longs only when price is above the SMA, shorts only when below. This multi-timeframe approach aligns short-term signals with higher timeframe context.
Bar-close confirmation: All entry and exit conditions use barstate.isconfirmed, ensuring that signals are only processed after the candle has fully closed. This eliminates repainting.
Post-stop-loss cooldown system: After a stop-loss event, the strategy can enforce a configurable cooldown period and optionally require price to cross the SMA filter before re-entry, preventing rapid re-entries into adverse conditions.
HOW THE STRATEGY WORKS — DETAILED METHODOLOGY
1. Stochastic %K Calculation
The strategy calculates the Stochastic %K using the standard formula: %K = (close - lowest_low) / (highest_high - lowest_low) * 100, with a configurable lookback period (default: 150). The %D smoothing is set to 1 (no smoothing), and %K smoothing is also 1, giving the raw stochastic value. This high-period, unsmoothed stochastic acts as a slow-cycle momentum indicator rather than a fast-reaction oscillator.
2. MACD Calculation
The MACD is calculated as the difference between a fast EMA (default: 10-period) and a slow EMA (default: 26-period). The signal line is an EMA of the MACD line (default: 9-period). The directional relationship between MACD and signal determines the momentum filter:
MACD > Signal = bullish momentum (longs allowed)
Signal > MACD = bearish momentum (shorts allowed)
3. Multi-Timeframe SMA Filter
When enabled, a 200-period SMA is calculated on the specified higher timeframe (default: 4-hour / "240") using request.security(). This provides a macro trend reference:
Price above SMA = bullish macro trend (longs allowed)
Price below SMA = bearish macro trend (shorts allowed)
4. Entry Conditions
A long entry requires ALL of the following on a confirmed bar:
The raw %K was below the long entry level on the previous bar AND is now above it (upward crossing of the threshold)
MACD filter is bullish (if enabled)
SMA filter is bullish (if enabled)
No position is currently open
No cooldown is active
No block from same-bar exit
A short entry requires the mirror conditions: %K was above the short entry level and is now below it, MACD is bearish, SMA is bearish.
5. Exit Conditions
Long exit triggers when %K rises above the long exit level (default: 55%) on a confirmed bar. Short exit triggers when %K falls below the short exit level (default: 50%) on a confirmed bar. These exits use strategy.close().
6. Stop-Loss and Cooldown
Optional percentage-based stop-losses can be set independently for longs and shorts (default: disabled at 100%). The cooldown system (disabled by default) blocks new entries after a stop-loss for a configurable number of bars and optionally requires a price-SMA cross before re-entry.
DEFAULT STRATEGY PROPERTIES
Initial Capital: $10,000
Pyramiding: 0 (single position only)
Commission: 0.06% per trade (optimized for low-spread pairs)
calc_on_every_tick: false (no repainting)
Default Mode: Long Only
Stochastic %K Period: 150
Long Entry Level: 14% | Long Exit Level: 55%
Short Entry Level: 85% | Short Exit Level: 50%
MACD: Enabled (Fast=10, Slow=26, Signal=9)
SMA Filter: Disabled (200-period on 4h timeframe when enabled)
Stop-Loss: Disabled (100%) by default
Cooldown After Stop-Loss: Disabled by default
Quantity: 100% of available balance
Leverage: 1x
HOW TO USE THIS STRATEGY
Select your trading mode: Long Only, Short Only, or Both.
Adjust the Stochastic %K period. Higher values (100-200) capture larger momentum cycles suitable for higher timeframes. Lower values (14-50) react faster for lower timeframes.
Configure the four threshold levels: long entry, long exit, short entry, short exit. Lower entry levels for longs provide deeper oversold entries but fewer signals. Higher exit levels allow trades to run longer.
Enable or disable the MACD filter. When enabled, it adds momentum direction confirmation. Adjust Fast, Slow, and Signal lengths as needed.
Enable or disable the multi-timeframe SMA filter. When enabled, set the SMA length and the timeframe for macro trend filtering.
Configure your position size and leverage. At 0% pyramiding, each trade uses the full allocated amount.
Optionally set stop-loss percentages and the cooldown mechanism.
Use the spread calculator to estimate actual trading costs.
Enable the on-chart information display to monitor all active parameters, indicator values, filter status, and performance metrics.
WHY THIS STRATEGY IS INVITE-ONLY
The three-layer signal confirmation system (Stochastic threshold + MACD direction + multi-timeframe SMA) creates a unique multi-factor framework that goes well beyond standard stochastic crossover scripts.
The use of raw %K threshold crossings with independent entry/exit levels — rather than %K/%D crossovers — is an unconventional approach optimized for cycle-based momentum detection.
The high-period stochastic (150) functions as a slow-cycle identifier, which is a deliberately different use case from the standard 14-period fast stochastic.
The multi-timeframe SMA filter using request.security() adds a higher-timeframe trend alignment layer not typically found in basic stochastic strategies.
Full bot-automation readiness with structured alert messages, invisible plot outputs for webhook systems, and bar-close-confirmed signals that eliminate repainting.
Post-stop-loss cooldown with optional SMA-cross re-entry protection.
Comprehensive on-chart information display with real-time monitoring of all parameters, indicator values, and trade statistics.
The strategy is part of a suite of automation-ready tools designed for systematic traders requiring reliable, unattended execution.
LIMITATIONS AND IMPORTANT NOTES
The Stochastic oscillator can remain in extreme zones for extended periods during strong trends, causing missed opportunities or delayed entries. The MACD and SMA filters help mitigate this but do not eliminate it.
The high-period %K (150) is designed for detecting larger cycles. It will be slow to react to rapid reversals on short timeframes.
Past backtest performance does not guarantee future results. Market conditions and cycle characteristics change over time.
Default parameters are optimized starting points. Each asset and timeframe combination requires its own optimization.
The commission is set to 0.06% by default, which corresponds to low-spread pairs. Adjust this value in Strategy Properties for assets with higher spreads.
When automating, ensure your bot's position sizing matches the strategy settings.
Non-standard chart types (Heikin Ashi, Renko, Kagi, Point and Figure, Range) should not be used for backtesting as they produce unrealistic results.
DISCLAIMER
This script is provided for educational and informational purposes only. It does not constitute financial advice. Trading financial instruments involves substantial risk of loss. Past performance is not indicative of future results. Always conduct your own research and consult with a qualified financial advisor before making any investment decisions. Use this strategy at your own risk. 策略
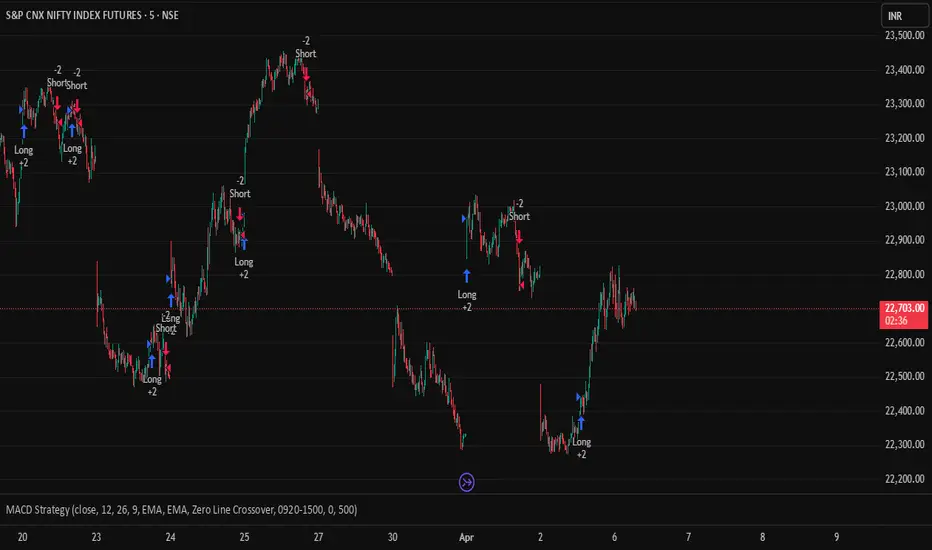
Ultimate 3-in-1 MACD Strategy | Session & Price Gates [v6]Take your trend-following and momentum trading to the next level. This isn't just a standard MACD; it is a fully comprehensive, algorithmic trading system built in Pine Script v6.
Whether you are an intraday scalper or a swing trader, this strategy gives you granular control over your entries, custom filters to avoid choppy markets, and automated risk management features.
🔥 Core Features:
3 Selectable Entry Modes: Choose the exact MACD signal that fits your style:
Classic Crossover: Entries trigger when the MACD line crosses the Signal line.
Histogram Reversal: Catch early momentum shifts when the histogram flips sign.
Zero Line Crossover: Trade the macro trend when the MACD crosses the zero baseline.
Highly Customizable Core: Swap between EMA and SMA for both Oscillator and Signal lines. Fully adjustable fast, slow, and signal lengths.
Intraday Session Filter: Define your exact trading window (e.g., 09:20 - 15:00). The strategy will only take trades within this window and will automatically flatten all open positions the moment the session ends—perfect for day traders avoiding overnight risk.
Price Range Gate: Optional price bounds (Low/High). The strategy will ignore entry signals if the asset is trading outside your designated price range, protecting you from extreme volatility or penny-stock chop.
Directional Control: Independently toggle Long and Short entries to align with your higher timeframe bias.
⚙️ How to Use:
Apply it to your chart, open the settings menu, and select your preferred Entry Mode. Turn on the Session Filter if you want to avoid holding trades overnight, and backtest different MA types to see what fits your specific asset best.
(Disclaimer: Trading involves significant risk of loss and is not suitable for all investors. Past performance is not indicative of future results. This script is for educational and backtesting purposes only.) 策略
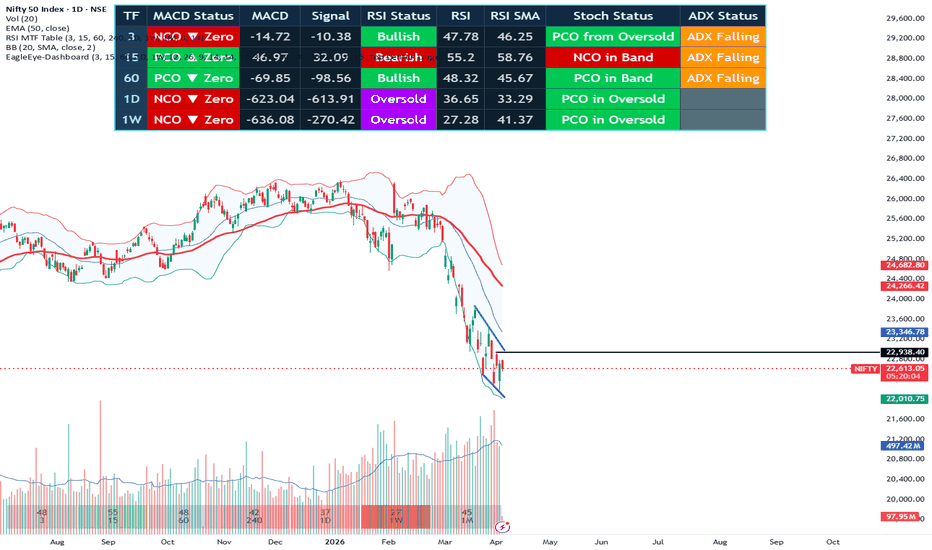
EagleEye-DashboardIndicator Description & Disclaimer
This indicator has been developed independently for educational and personal learning purposes, based on hands-on trading experience and continuous research into multi-timeframe analysis.
What this indicator does:
This tool consolidates three of the most widely used technical indicators — MACD, RSI, and Stochastic Oscillator — into a single, clean dashboard view. Rather than switching between multiple charts and timeframes manually, traders can now see the status and alignment of all three indicators across multiple timeframes (MTF) at a single glance. This helps in quickly identifying trend confluence, momentum shifts, and potential entry/exit zones without cluttering your chart.
Key features:
Multi-Timeframe (MTF) dashboard view in one unified panel
Real-time status display for MACD, RSI, and Stochastic
Designed for clarity, speed, and ease of interpretation
Suitable for indices, equities, forex, and crypto markets
Disclaimer:
This indicator is strictly developed for learning and informational purposes only. It does not constitute financial advice, investment recommendation, or a solicitation to buy or sell any financial instrument. Past performance of any signal generated by this indicator does not guarantee future results. Trading in financial markets involves substantial risk, and you may lose more than your initial investment. Always conduct your own due diligence, apply proper risk management, and consult a certified financial advisor before making any trading decisions.
The author holds no responsibility for any trading losses incurred through the use of this indicator. Use at your own risk.
Future Roadmap:
This indicator is actively being refined. Upcoming versions will aim to improve signal accuracy, add additional confirmation layers, and expand timeframe flexibility based on user feedback and ongoing research.
Developed with passion for the trading community.
Regards,
Ramesh Vaishya
Independent Trader & Indicator Developer 指标

EagleEye-DashboardIndicator Description & Disclaimer
This indicator has been developed independently for educational and personal learning purposes, based on hands-on trading experience and continuous research into multi-timeframe analysis.
What this indicator does:
This tool consolidates three of the most widely used technical indicators — MACD, RSI, and Stochastic Oscillator — into a single, clean dashboard view. Rather than switching between multiple charts and timeframes manually, traders can now see the status and alignment of all three indicators across multiple timeframes (MTF) at a single glance. This helps in quickly identifying trend confluence, momentum shifts, and potential entry/exit zones without cluttering your chart.
Key features:
Multi-Timeframe (MTF) dashboard view in one unified panel
Real-time status display for MACD, RSI, and Stochastic
Designed for clarity, speed, and ease of interpretation
Suitable for indices, equities, forex, and crypto markets
Disclaimer:
This indicator is strictly developed for learning and informational purposes only. It does not constitute financial advice, investment recommendation, or a solicitation to buy or sell any financial instrument. Past performance of any signal generated by this indicator does not guarantee future results. Trading in financial markets involves substantial risk, and you may lose more than your initial investment. Always conduct your own due diligence, apply proper risk management, and consult a certified financial advisor before making any trading decisions.
The author holds no responsibility for any trading losses incurred through the use of this indicator. Use at your own risk.
Future Roadmap:
This indicator is actively being refined. Upcoming versions will aim to improve signal accuracy, add additional confirmation layers, and expand timeframe flexibility based on user feedback and ongoing research.
Developed with passion for the trading community.
Regards,
Ramesh Vaishya
Practicing Trader of God Market & Indicator Developer 指标
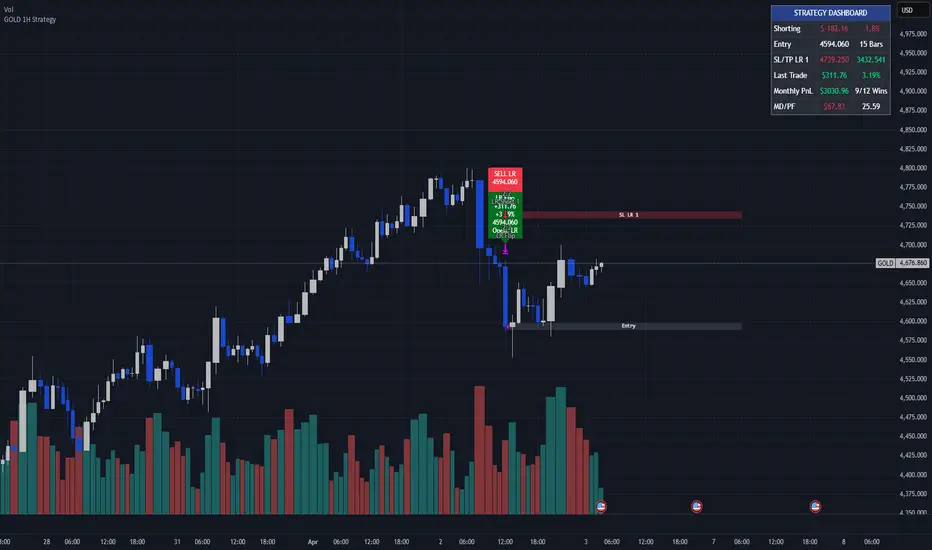
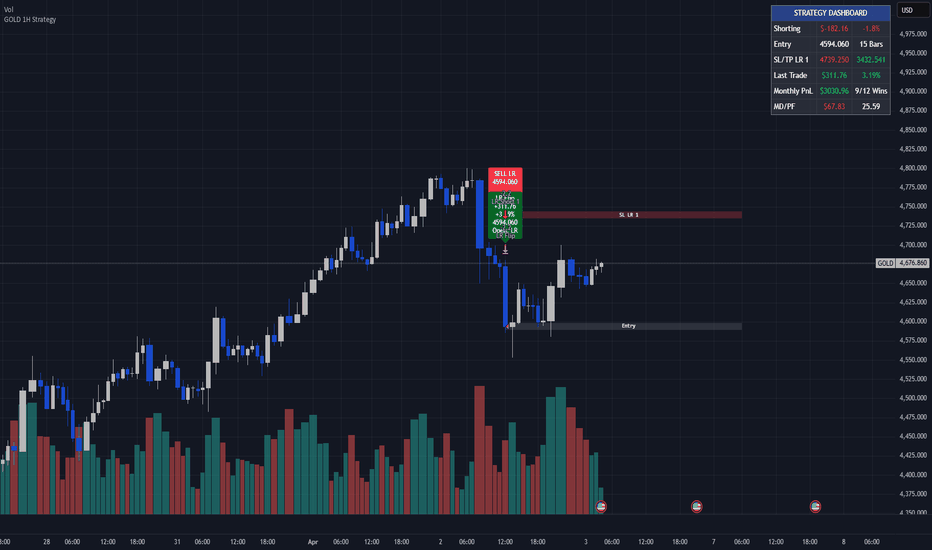
GOLD 1H StrategyMODULAR GOLD 1H STRATEGY (VMA + DIVERGENCE + LINEAR REGRESSION)
OVERVIEW
This is my original work, developed end-to-end by me, from the initial trading logic and architecture to the final implementation, refinement, and testing. It is a modular strategy built specifically for Gold on the 1-hour timeframe, combining multiple signal “families” into one framework so it can adapt to different market conditions without needing separate scripts.
PERFORMANCE
Do not rely on claims alone. Check the actual results in Strategy Tester → Overview / Performance Summary for your Gold symbol and timeframe. Focus on Net Profit, Profit Factor, Max Drawdown, trade list, and execution assumptions such as fees, spread, and slippage. Performance will always depend on market conditions, settings, and broker execution.
WHAT IT DOES
This strategy is designed for Gold 1H to:
- Trade both trending and rotational conditions
- Combine trend-following and reversal-style confirmation inside one script
- Filter lower-quality setups with optional confirmation layers
- Manage risk through configurable stop loss, take profit, trailing, time exits, and pyramiding controls
- Support automation workflows through structured JSON alert messages
LINEAR REGRESSION MTF MODULE
Uses a multi-timeframe linear regression structure to track trend direction, slope, and momentum. This module is meant to capture directional continuation and manage trades in stronger trend conditions.
VMA BOUNCE/BREAK MODULE
Uses a Variable Moving Average value area to detect whether price is reacting away from balance or breaking through it. This helps identify bounce and break opportunities that are relevant for Gold’s intraday movement.
DIVERGENCE MODULE
Uses divergence concepts across momentum and volume-based signals to help identify weakening moves and improve timing. It acts as a confirmation engine, not a guarantee.
OPTIONAL FILTERS
The script also includes optional filters such as:
- Donchian bias
- LRS + VMA confirmation
- Donchian VMA confirmation
- Session and relative volume filters
These filters can be enabled or disabled per module, allowing the strategy to be tuned for different Gold conditions.
ALERTS
Built to work cleanly with “Order fills only” alerts in TradingView. The script includes JSON-ready alert formatting for automation workflows and external execution setups.
DISCLAIMER
This is a research and backtesting tool for Gold 1H. Backtest results are not guarantees of future performance. Always validate settings on your own market conditions and manage risk properly.
策略
指标

EagleView - MACD+RSI+StochIndicator Description & Disclaimer
This indicator has been developed independently for educational and personal learning purposes, based on hands-on trading experience and continuous research into multi-timeframe analysis.
What this indicator does:
This tool consolidates three of the most widely used technical indicators — MACD, RSI, and Stochastic Oscillator — into a single, clean dashboard view. Rather than switching between multiple charts and timeframes manually, traders can now see the status and alignment of all three indicators across multiple timeframes (MTF) at a single glance. This helps in quickly identifying trend confluence, momentum shifts, and potential entry/exit zones without cluttering your chart.
Key features:
Multi-Timeframe (MTF) dashboard view in one unified panel
Real-time status display for MACD, RSI, and Stochastic
Designed for clarity, speed, and ease of interpretation
Suitable for indices, equities, forex, and crypto markets
Disclaimer:
This indicator is strictly developed for learning and informational purposes only. It does not constitute financial advice, investment recommendation, or a solicitation to buy or sell any financial instrument. Past performance of any signal generated by this indicator does not guarantee future results. Trading in financial markets involves substantial risk, and you may lose more than your initial investment. Always conduct your own due diligence, apply proper risk management, and consult a certified financial advisor before making any trading decisions.
The author holds no responsibility for any trading losses incurred through the use of this indicator. Use at your own risk.
Future Roadmap:
This indicator is actively being refined. Upcoming versions will aim to improve signal accuracy, add additional confirmation layers, and expand timeframe flexibility based on user feedback and ongoing research.
Developed with passion for the trading community.
Regards,
Ramesh Vaishya
Trader & Indicator Developer 指标

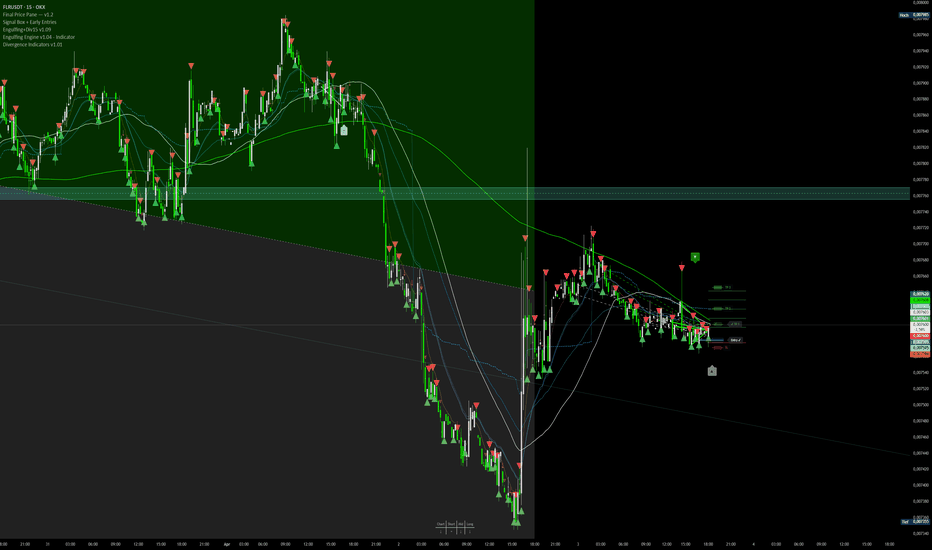
Divergence Indicators v1.01 (Pine v6)Divergence Indicators v1.01 (Pine v6) is a production‑ready TradingView indicator that automatically detects regular and hidden divergences across 11 widely used indicators (MACD, MACD histogram, RSI, Stochastic, CCI, Momentum, OBV, VW‑MACD, CMF, MFI, plus an optional external series). It’s engineered for crypto traders and optimized for fast intraday use (5‑minute charts) while offering multi‑timeframe confirmation, object throttling to avoid TradingView limits, and two ready‑to‑use presets (Aggressive and Conservative). The indicator draws clear divergence lines, summary labels, and provides alert conditions so you can spot reversal and continuation setups quickly and reliably on BTC, ETH, SOL and co. and perpetual futures.
Key Features
11 indicator checks: MACD, MACD histogram, RSI, Stochastic, CCI, Momentum, OBV, VW‑MACD, CMF, MFI, and an optional external indicator input.
Regular and Hidden divergences: Detects reversal (regular) and continuation (hidden) divergences.
Multi‑timeframe confirmation: Optional confirmation from two higher timeframes (defaults 30m and 60m).
Presets: Aggressive for fast 5m signals; Conservative for fewer false positives and swing setups.
Object throttling: Limits lines and labels to avoid TradingView object limits and keep charts clean.
Pine v6 best practices: All plots and shapes in global scope, typed variables, precomputed request.security calls, robust na checks, and safe OBV/CMF calculations.
Alerts: Built‑in alertconditions for positive/negative and regular/hidden divergences.
Customizable visuals: Colors, line styles, widths, label text options, and pivot source selection.
Performance tuned for crypto: Designed to handle perpetual futures and volatile altcoins with safe arithmetic and array bounds.
User Guide
Installation
Save and Add to Chart. Recommended chart timeframe: 5 minutes for intraday trading.
Open the indicator settings and choose Mode: Aggressive, Conservative, or Custom.
Presets and Key Inputs
Mode
Aggressive: prd = 3, dontconfirm = true, throttle_lines = 4 — faster signals, more frequent.
Conservative: prd = 6, dontconfirm = false, throttle_lines = 8 — stricter signals, fewer false positives.
Custom: manually set all parameters.
Pivot Period (prd): Number of bars used to detect pivot highs/lows. Lower values produce more pivots and more signals; higher values produce fewer, stronger pivots.
Maximum Pivot Points (maxpp) and Maximum Bars to Check (maxbars): Control how far back the script searches for matching pivots. Increase for more historical matching, decrease for performance.
Indicator toggles: Enable or disable each indicator to reduce noise and CPU usage.
Show Only Last Divergence: Keeps the chart uncluttered by removing older labels/lines. Recommended for 5m charts.
Show MAs: Toggle 50 & 200 SMA overlay for trend context.
How to Read Signals
Regular Divergence (reversal)
Positive Regular: Price makes a lower low while indicator makes a higher low → bullish reversal candidate.
Negative Regular: Price makes a higher high while indicator makes a lower high → bearish reversal candidate.
Visuals: Solid lines (configurable color) connect the pivot points; labels list contributing indicators.
Hidden Divergence (continuation)
Positive Hidden: Price makes a higher low while indicator makes a lower low → bullish continuation.
Negative Hidden: Price makes a lower high while indicator makes a higher high → bearish continuation.
Visuals: Dashed/dotted lines (configurable) indicate hidden divergences.
Labels: Show which indicators contributed and a count of divergences found at top/bottom.
Multi‑Timeframe Confirmation
The indicator precomputes higher‑TF indicator values (e.g., 30m, 60m) and requires a configurable number of confirmations (mtf_min_confirm) before drawing lines.
Recommended settings: For 5m scalping, use 30m confirmation = 1. For swing trades, use 4h/12h confirmations and require 2 confirmations.
Alerts
Built‑in alertconditions available: Positive/Negative Regular and Positive/Negative Hidden divergences.
Create TradingView alerts using these conditions and route them to email, app, or webhook for automation.
Example Workflows
Quick scalp (Aggressive): Chart 5m BTC‑Perp, Mode = Aggressive, showlast = true, use_mtf = true with mtf_1 = 30m and mtf_min_confirm = 1. Enter on bullish regular divergence with candle confirmation and tight stop under pivot.
Swing trade (Conservative): Chart 4h BTC, Mode = Conservative, use_mtf = true with mtf_1 = 12h and mtf_2 = 24h, mtf_min_confirm = 2. Use hidden divergences to add to trend positions.
Best Practices and Troubleshooting
Use showlast = true on 5m to avoid clutter and TradingView object limits.
Enable MTF confirmation for perpetual futures to filter noise from funding‑driven spikes. 30m/1h confirmations work well for 5m entries.
Combine with a trend filter: Use 50/200 SMA or a higher‑TF trend check to avoid counter‑trend trades.
Risk management: Divergences are signals, not guarantees. Use stop loss at pivot extremes and size positions for acceptable drawdown.
Performance: If you enable many indicators and multiple MTFs, TradingView may slow down. Disable unused indicators or MTF confirmation to improve performance.
指标
Chaos Regime Detection Engine [JOAT]Chaos Regime Detection Engine
Introduction
The Chaos Regime Detection Engine is an advanced open-source market microstructure indicator that classifies market conditions into distinct regimes using multi-dimensional volatility analysis, directional conviction measurement, and institutional flow detection. This indicator transforms raw market data into actionable regime intelligence, helping traders identify when markets are trending, ranging, chaotic, or experiencing volatility shocks.
Unlike single-dimension volatility indicators that only measure price movement magnitude, this engine analyzes market structure through four independent scoring systems that combine into a unified regime classification framework. The indicator is designed for traders who understand that different market regimes require different trading approaches and that regime identification is the foundation of adaptive strategy selection.
Why This Indicator Exists
This indicator addresses a fundamental challenge in trading: markets constantly shift between different behavioral regimes, and strategies that work in one regime often fail in another. The core innovation lies in synthesizing multiple market microstructure measurements into a probabilistic regime classification system:
Directional Flow Regime: Markets exhibiting high price efficiency, low choppiness, and strong ADX conviction - ideal for trend-following strategies
Equilibrium Regime: Markets showing balanced conditions with moderate volatility and weak directional bias - suitable for mean-reversion approaches
Chaotic Turbulence Regime: Markets displaying high choppiness, low efficiency, and conflicting signals - best avoided or traded with tight stops
Volatility Shock Regime: Markets experiencing extreme volatility expansion with high volume - requires defensive positioning or volatility strategies
Each regime classification is derived from normalized scores across multiple dimensions, ensuring that regime identification remains robust across different instruments, timeframes, and market conditions. The system provides not just regime labels but confidence levels and intensity measurements that quantify regime strength.
Core Components Explained
1. ATR and Volatility Percentile Analysis
The indicator calculates Average True Range (ATR) over a customizable period (default 14) and expresses it as a percentage of current price. This normalization allows cross-instrument comparison and removes price-level bias.
ATR percentile ranking over 100 bars provides context for current volatility relative to recent history. High percentile rankings (>70) indicate elevated volatility, while low rankings (<30) suggest compressed volatility. This percentile approach is superior to raw ATR because it adapts to each instrument's unique volatility characteristics.
The volatility percentile feeds into multiple regime scores, particularly the Volatility Shock score, which combines ATR percentile with standard deviation percentile and volume surge detection to identify extreme volatility events.
2. Kaufman Efficiency Ratio
The Efficiency Ratio measures how efficiently price moves from point A to point B by comparing net price change to total path length:
Efficiency = Net Price Change / Sum of Absolute Bar-to-Bar Changes
Values near 1.0 indicate highly efficient, directional movement (trending). Values near 0.0 indicate inefficient, choppy movement (ranging). The indicator uses a customizable lookback period (default 20) to calculate efficiency.
High efficiency feeds into the Directional Flow score, while low efficiency contributes to both Equilibrium and Chaotic Turbulence scores. This dual contribution ensures that the regime classification captures the full spectrum of market behavior.
3. Choppiness Index
The Choppiness Index quantifies market choppiness using logarithmic calculations:
Choppiness = 100 * log10(Sum of ATR / (Highest High - Lowest Low)) / log10(Length)
Values above 61.8 indicate choppy, range-bound markets. Values below 38.2 indicate trending markets. The indicator uses a customizable period (default 14) for this calculation.
The Choppiness Index is inverted when contributing to the Directional Flow score (100 - Choppiness) because low choppiness indicates high directional clarity. High choppiness directly contributes to the Chaotic Turbulence score, identifying markets where price action lacks clear direction.
4. ADX Directional Conviction System
The indicator implements a complete ADX (Average Directional Index) calculation including +DI and -DI components:
+DI measures upward directional movement strength
-DI measures downward directional movement strength
ADX measures the strength of directional movement regardless of direction
ADX values above the trend threshold (default 25) indicate emerging directional conviction. Values above the strong threshold (default 40) indicate dominant directional conviction. The indicator uses customizable lengths for both DI calculation (default 14) and ADX smoothing (default 14).
ADX contributes bonus points to the Directional Flow score when above threshold and to the Equilibrium score when below threshold. The difference between +DI and -DI provides directional bias (long vs short) and conviction strength measurements.
5. Standard Deviation and RVI Analysis
Standard deviation of close prices over 20 bars provides an alternative volatility measurement that captures price dispersion rather than range. The indicator calculates standard deviation as a percentage of price and ranks it using percentile analysis.
The Relative Volatility Index (RVI) applies standard deviation concepts to directional movement:
RVI = 100 * StdDev(Up Moves) / (StdDev(Up Moves) + StdDev(Down Moves))
RVI values above 50 indicate upward volatility dominance, below 50 indicates downward volatility dominance. This provides directional context to volatility measurements that raw standard deviation lacks.
Both metrics contribute to the Volatility Shock score, helping identify when markets are experiencing not just high volatility but directionally biased volatility expansion.
6. Volume Delta Integration
The indicator estimates buying and selling pressure using volume and candle structure:
Buy Volume = Volume when close > open
Sell Volume = Volume when close < open
Volume surge detection compares current volume to 20-period average using a customizable threshold (default 1.5x). Volume surges add bonus points to the Volatility Shock score, confirming that volatility expansion is accompanied by genuine institutional participation rather than thin-market noise.
This volume integration ensures that regime classifications reflect actual market activity rather than just price movement patterns.
7. Regime Scoring and Classification Engine
The indicator calculates four independent regime scores (0-100 scale):
Directional Score = (Efficiency * 100 + (100 - Choppiness) + ADX Bonus) / 2.2
Equilibrium Score = (100 - ATR Percentile + (100 - Efficiency * 100) + ADX Penalty) / 2.2
Turbulence Score = (Choppiness + (100 - Efficiency * 100)) / 2
Shock Score = (ATR Percentile + StdDev Percentile + Volume Surge Bonus) / 2.3
These scores are then normalized to sum to 100%, creating a probability distribution across the four regimes. The dominant regime is determined by the highest normalized score, with confidence level equal to that score's magnitude.
Regime intensity is classified as Nascent (score 35-45), Established (score 45-60), or Dominant (score >60), providing additional context about regime strength and stability.
8. Fractal Divergence Detection
The indicator implements fractal-based divergence detection using a composite volatility index that combines:
30% ATR Percentile
20% Efficiency Ratio
20% Inverted Choppiness
15% StdDev Percentile
15% RVI
This composite index is smoothed with a 5-period EMA and analyzed for fractal tops and bottoms using a 5-bar pattern recognition system. Divergences are detected when price makes new highs/lows but the composite volatility index fails to confirm, suggesting hidden institutional positioning or liquidity asymmetries.
Regular divergences signal potential reversals, while hidden divergences suggest trend continuation after pullbacks. The indicator plots these divergences with color-coded markers and draws connecting lines for visual clarity.
Visual Elements
Composite Volatility Line: Main plot showing the smoothed composite volatility index with dynamic gradient coloring based on regime confidence
Regime Intensity Histogram: Histogram showing regime-specific intensity with transparency based on confidence level
Microstructure Indicators: Subtle circle plots showing ATR percentile, efficiency ratio, and directional clarity for detailed analysis
Conviction Overlay: Stepline plot showing ADX with gradient coloring based on conviction strength
Fractal Divergence Markers: Circle plots at fractal tops/bottoms with color-coded divergence identification
Regime Threshold Lines: Horizontal lines at key regime transition levels (50, 60, 40, 75, 25)
Probability Zone Fill: Subtle background fill showing current regime probability field
Signal Shapes: Triangle shapes on price chart for high-confidence regime transitions and divergences
Comprehensive Dashboard: 12-row intelligence panel showing regime state, certainty, bias, probability scores, conviction, confluence, and all key metrics
The dashboard provides at-a-glance regime assessment with color-coded values, status indicators, and confidence measurements for all regime dimensions simultaneously.
Input Parameters
Signal Architecture:
Regime Shift Signals: Toggle chaos-to-order transition detection (default enabled)
Regime Persistence Signals: Toggle regime stability confirmations (default enabled)
Fractal Divergence Detection: Toggle hidden liquidity flow asymmetries (default enabled)
Minimum Confluence Threshold: Multi-factor validation requirement (1-5, default 3)
Volatility Microstructure:
Volatility Expansion Period: ATR calculation length (5-50, default 14)
Volatility Percentile Window: Percentile ranking lookback (20-500, default 100)
Price Efficiency Horizon: Efficiency ratio calculation period (5-100, default 20)
Chaos Measurement Period: Choppiness index length (5-50, default 14)
Directional Conviction:
Conviction Measurement Length: DI calculation period (5-50, default 14)
Conviction Smoothing Factor: ADX smoothing length (1-50, default 14)
Conviction Emergence Level: ADX trend threshold (15-40, default 25)
Conviction Dominance Level: ADX strong threshold (30-60, default 40)
Institutional Flow:
Enable Flow Asymmetry Detection: Toggle volume delta analysis (default enabled)
Flow Surge Multiplier: Volume threshold for surge detection (1.0-5.0, default 1.5)
Regime Parameters:
Directional Regime Threshold: Score required for directional classification (50-90, default 60)
Chaotic Regime Threshold: Score required for chaos classification (10-50, default 40)
Volatility Shock Threshold: Score required for shock classification (25-50, default 35)
Visualization:
Regime Intelligence Panel: Toggle dashboard display (default enabled)
Microstructure Indicators: Toggle detailed metric plots (default enabled)
Regime Probability Zones: Toggle background probability field (default enabled)
Intelligence Panel Scale: Small/Normal/Large dashboard sizing (default Normal)
Colors:
All colors are fully customizable including directional expansion (neon cyan), volatility shock (neon pink), equilibrium state (gold), and chaotic turbulence (sunset orange).
How to Use This Indicator
Step 1: Identify Current Regime
Check the dashboard "STATE" field to see current regime classification. Note the intensity level (Nascent/Established/Dominant) and certainty percentage. Dominant regimes with high certainty (>80%) are most reliable for strategy selection.
Step 2: Assess Regime Certainty
Monitor the "CERTAINTY" metric. High certainty (>60%) indicates clear regime conditions where strategies aligned with that regime should perform well. Low certainty (<40%) suggests transitional conditions where defensive positioning is appropriate.
Step 3: Check Directional Bias
Review the "BIAS" field showing Long Flow, Short Flow, or Neutral. This indicates whether directional conviction favors long or short positioning within the current regime. The numerical value shows conviction strength.
Step 4: Analyze Regime Probability Scores
Examine the four regime probability scores (Directional, Equilibrium, Turbulence, Shock). These show the relative likelihood of each regime. When one score dominates (>60%), regime classification is clear. When scores are balanced, market is transitional.
Step 5: Monitor Conviction Metrics
Check "CONVICTION" showing ADX value and status (Dominant/Emerging/Absent). Dominant conviction (>40) confirms that directional regimes have strong follow-through potential. Absent conviction (<25) suggests equilibrium or chaotic conditions.
Step 6: Evaluate Confluence Matrix
Review the "CONFLUENCE" score (0-5) showing how many confirmation factors align. Maximum confluence (5/5) indicates all factors agree, providing highest-confidence regime classification. Low confluence (1-2/5) suggests conflicting signals requiring caution.
Step 7: Watch for Regime Transitions
Regime transition signals (triangles on price chart) mark shifts between regimes. These are critical moments for strategy adjustment. Transitions from Chaos to Directional often mark the start of new trends. Transitions to Shock regimes warn of elevated risk.
Step 8: Use Divergence Signals
Fractal divergence markers (labeled "DIV") identify price-volatility asymmetries that often precede regime changes. Bullish divergences in Equilibrium regimes may signal upcoming Directional regimes. Bearish divergences in Directional regimes may warn of regime exhaustion.
Best Practices
Use Directional Flow regimes for trend-following strategies with trailing stops
Use Equilibrium regimes for mean-reversion strategies with defined profit targets
Avoid new positions during Chaotic Turbulence regimes or use very tight stops
Reduce position size or hedge during Volatility Shock regimes
Regime transitions with high confluence (4-5/5) offer highest-probability strategy shift opportunities
Dominant intensity regimes (>60% certainty) are most reliable for strategy execution
Nascent intensity regimes (<45% certainty) require defensive positioning until regime establishes
Monitor conviction metrics - Directional regimes without conviction (ADX <25) often fail
Fractal divergences are most reliable when they occur at regime extremes
Use the probability scores to anticipate regime transitions before they're officially classified
Equilibrium regimes with rising Directional scores suggest impending breakouts
Directional regimes with rising Turbulence scores warn of trend exhaustion
Indicator Limitations
Regime classification is probabilistic, not deterministic - no regime guarantees specific outcomes
The indicator identifies current regime but cannot predict regime duration
Regime transitions can be whipsaw-prone during genuinely transitional market conditions
Volume-based components require accurate volume data - some instruments have unreliable volume
The indicator works best on liquid instruments with consistent trading patterns
Newly listed instruments may lack sufficient history for reliable percentile calculations
Extreme market events (flash crashes, circuit breakers) can temporarily distort regime classification
The indicator shows what regime exists, not why - fundamental catalysts can override regime signals
Confluence scoring requires all factors to be relevant - some factors may be less meaningful on certain instruments
Fractal divergence detection requires clear fractal formation - choppy markets may produce false divergences
Regime intensity classifications are relative to recent history, not absolute across all market conditions
Technical Implementation
Built with Pine Script v6 using:
Complete ADX calculation with +DI/-DI components and customizable smoothing
Kaufman Efficiency Ratio using net change vs path length methodology
Choppiness Index with logarithmic normalization
Multi-component composite volatility index with weighted factor contributions
Percentile ranking calculations for ATR, standard deviation, and composite volatility
Fractal pattern recognition using 5-bar pivot detection
Divergence detection comparing price fractals to volatility fractals
Four-dimensional regime scoring system with normalization to probability distribution
Confluence factor calculation combining conviction, flow, clarity, certainty, and efficiency
Dynamic color gradients based on regime confidence and intensity
Comprehensive dashboard with 12 metrics and color-coded status indicators
Alert system for regime transitions, divergences, and conviction surges
The code is fully open-source with extensive comments explaining each calculation and regime classification logic.
Originality Statement
This indicator is original in its multi-dimensional regime classification approach. While individual components (ATR, Efficiency Ratio, Choppiness, ADX) are established concepts, this indicator is justified because:
It synthesizes four independent regime scoring systems into a unified probabilistic classification framework
The composite volatility index combines five distinct measurements with optimized weighting
Regime intensity classification (Nascent/Established/Dominant) provides confidence context beyond simple regime labels
Confluence scoring validates regime classification through multi-factor confirmation
Fractal divergence detection identifies hidden institutional positioning through volatility-price asymmetries
The normalization of regime scores to probability distribution ensures consistent interpretation across instruments
Integration of volume surge detection confirms that regime classifications reflect genuine market activity
The dashboard synthesizes 12 distinct metrics into a unified regime intelligence panel
Regime transition signals with confluence filtering provide high-confidence strategy adjustment points
The system adapts to each instrument's unique characteristics through percentile-based calculations
Each component contributes unique intelligence: ATR measures volatility magnitude, Efficiency measures directional clarity, Choppiness measures range-bound behavior, ADX measures conviction, volume confirms participation, and divergences reveal hidden positioning. The indicator's value lies in combining these complementary perspectives into a cohesive regime classification system that guides strategy selection.
Disclaimer
This indicator is provided for educational and informational purposes only. It is not financial advice or a recommendation to buy or sell any financial instrument. Trading involves substantial risk of loss and is not suitable for all investors.
Regime classification is probabilistic analysis that identifies current market conditions but does not predict future regime duration or transitions. Regime signals do not guarantee profitable trades. Past regime patterns do not guarantee future regime patterns. Market conditions change, and strategies that worked in historical regimes may not work in future regimes.
The metrics displayed are mathematical calculations based on current market data, not predictions of future price movement. Regime transitions, divergences, and confluence scores do not guarantee profitable trades. Users must conduct their own analysis and risk assessment before making trading decisions.
Always use proper risk management, including stop losses and position sizing appropriate for your account size and risk tolerance. Never risk more than you can afford to lose. Consider consulting with a qualified financial advisor before making investment decisions.
The author is not responsible for any losses incurred from using this indicator. Users assume full responsibility for all trading decisions made using this tool.
-Made with passion by officialjackofalltrades 指标

FRS Multi-TF Technical TableTrading shouldn't be a chaos of lines. This indicator was designed under the premise that "less is more." It is built for traders who need to keep their price charts free of visual noise while still requiring critical technical data from multiple timeframes to make fast, informed decisions.
What does this Dashboard offer?
Unlike other panels cluttered with confusing signals, this dashboard provides a real technical snapshot of the levels that actually matter:
- Multi-TF Visibility: Simultaneous tracking of 4 key timeframes (Default: 15', 2h, 3D, and 1W). Note: Intervals are fully customizable to fit your specific strategy.
- Momentum & Trend: RSI status (with dynamic color zones), MACD convergence/divergence, and automatic detection of Simple Divergences.
- Moving Average Structure: Real-time values for MA20, MA50, and MA200, including slope direction (↗/↘) and Golden/Death Cross status.
- Volume Health: Immediate comparison between current volume and its average to detect liquidity spikes or anomalies.
Ideal for "Asset Scanning"
This indicator is the perfect tool for traders who analyze multiple assets in a short amount of time. You don't need to switch charts or timeframes to know if the Weekly RSI is oversold or if the 2h MA200 is acting as resistance; everything is consolidated in one single table.
Key Features:
- 100% Clean Chart: Only the table in your preferred corner—no extra lines on the price action.
- Easy Readability: Intuitive color coding to identify bullish or bearish strength in a split second.
- Integrated Alerts: Set up alerts for divergences or specific RSI levels across any of the monitored timeframes. 指标

Case's Modern MACD-Volatility Normalized MomentumCase's Modern MACD-Volatility Normalized Momentum
Based on the award-winning academic research of Alex Spiroglou, CFTe, MSTA — NAAIM Founders Award & Charles H. Dow Award (2022)
📄 Original paper: SSRN #4099617
What Is MACD-V?
The standard MACD has a fundamental flaw: its raw values are denominated in price, making them incomparable across assets, timeframes, and volatility regimes. A MACD reading of 5.0 means something completely different on NVDA vs. SPY vs. BTC.
MACD-V solves this by dividing the MACD by ATR × 100, producing a volatility-normalized momentum oscillator that is:
Comparable across all tickers and timeframes
Centered around fixed, meaningful thresholds (±50, ±150, ±200)
Regime-aware — you know exactly where you stand in the momentum lifecycle at all times
This script extends the core MACD-V framework with a full Momentum Lifecycle Road Map, Trend Regime Filter, Regime-Aware Opportunity Zones, Acceleration (2nd Derivative), and several supporting systems.
Core Components
1. MACD-V Line
The volatility-normalized momentum line. Default parameters: Fast EMA 12, Slow EMA 26, ATR 26 — the same as classic MACD, but normalized. The line is color-coded by momentum state (see Momentum Lifecycle below).
2. Signal Line
A 9-period EMA of MACD-V. Crossovers and the MACD-V's position relative to the signal define sub-states within each momentum zone.
3. MACD-VH Histogram
The difference between MACD-V and its Signal Line. Color-coded by direction and growth:
Teal (growing positive) — bullish momentum expanding
Light teal (shrinking positive) — bullish momentum fading
Light red (rising negative) — bearish momentum fading
Red (falling negative) — bearish momentum expanding
Extreme histogram readings beyond ±40 signal short-term overextension.
4. Acceleration (2nd Derivative)
A smoothed EMA of the bar-to-bar change in MACD-V, scaled for visibility. Think of it as the rate of change of momentum. When acceleration is positive (teal), momentum is building. When negative (red), it's waning — even if the MACD-V line itself is still rising. This is particularly powerful for timing entries and exits.
The Momentum Lifecycle Road Map
MACD-V's fixed thresholds carve price momentum into 8 distinct states, each with a precise behavioral expectation:
StateMACD-V Rangevs. SignalColorInterpretationRisk (Overbought)> 150—🔴 RedMomentum extended; risk of reversal or correctionRallying50 to 150Above🟢 GreenStrong bullish momentum with trend confirmationRetracing50 to 150Below🟠 OrangeBullish zone but losing momentum; cautionRanging (Bullish)-50 to 50Above🩵 TealConsolidation with bullish biasRanging (Bearish)-50 to 50Below🔴 RedConsolidation with bearish biasRebounding-150 to -50Above🟢 Light GreenRecovering from oversold; potential reversalReversing-150 to -50Below🟣 PurpleBearish zone, still decliningRisk (Oversold)< -150—🔴 RedMomentum deeply negative; exhaustion risk/opportunity
A status table in the top-right corner always shows the current state, trend regime, opportunity zone, and acceleration direction — no squinting at the chart required.
Trend Regime Filter (200 EMA Slope)
A row of dots plotted below the oscillator, colored by the slope of the 200-period EMA:
🟢 Green — Rising 200 EMA → Bullish Regime
🔴 Red — Falling 200 EMA → Bearish Regime
⚫ Gray — Flat → Neutral Regime
This single filter dramatically changes how you interpret every other signal on the indicator.
Regime-Aware Opportunity Zones
This is where the indicator gets powerful for active traders. The trend regime context transforms oversold/overbought readings into actionable setups:
🟢 Bull Regime Signals (200 EMA rising)
SignalConditionMeaningBuy the Dip ZoneMACD-V between -50 and -150Normal pullback in an uptrend — historically high-probability long entryRare Buy!MACD-V ≤ -100Deep dip in bull trend — a rarer, higher-conviction setupExtreme OB WarningMACD-V > 200Even in a bull regime, this level of extension warrants caution
🔴 Bear Regime Signals (200 EMA falling)
SignalConditionMeaningShort the Rip ZoneMACD-V between 50 and 150Counter-trend bounce in a downtrend — potential short entryRare Short!MACD-V ≥ 100Extended rip in a bear regime — rarer, higher-conviction short setupExtreme OS OpportunityMACD-V < -200Even in a bear regime, this extreme may offer a tradeable bounce
Zones are highlighted with background color fills and shape markers (triangles for zone entries, diamonds for rare signals) at the pane edges.
How to Use It: Practical Examples
Example 1: Buying the Dip in a Bull Trend
Scenario: SPY, daily chart. 200 EMA is rising (green dots). MACD-V drops from +80 (Rallying) into the -50 to -150 range.
Regime dots turn green → confirmed bull regime
Status table shows "Buy the Dip Zone" with green background
MACD-V hits -90, acceleration flips positive (teal area)
MACD-V crosses above signal line → state transitions from Reversing to Rebounding
Entry signal: long on the Rebounding transition with acceleration confirming. Stop below the prior swing low. Target: return to Rallying zone (+50 to +150)
Example 2: Shorting the Rip in a Bear Trend
Scenario: QQQ, daily chart. 200 EMA is falling (red dots). After a sharp decline, price bounces and MACD-V pushes up toward +80.
Regime dots are red → confirmed bear regime
MACD-V enters the 50–150 range → "Short the Rip Zone" activates
Histogram begins shrinking (light teal → light red)
Acceleration turns negative while MACD-V is still above +50
MACD-V crosses below signal line → Rallying → Retracing state change
Entry signal: short on the Retracing state entry. Target: return to Ranging or lower
Example 3: Identifying Exhaustion at Extremes
Scenario: Individual stock surges — MACD-V blows past +150 into Risk (Overbought) and then crosses +200 (Extreme OB).
Status table shows "Risk (Overbought)" — position sizing should be reduced
MACD-V crosses +200 → Extreme OB background activates (dark red)
If in a bull regime: the "Extreme OB Warning" marker fires at the pane ceiling — this is a warning to tighten stops or take partial profits, not necessarily to go short outright
Acceleration turns negative while MACD-V is still above 150 → divergence between price extension and momentum rate-of-change
Watch for MACD-V to turn down and re-enter the 50–150 Rallying zone — that first pullback often offers the next long entry
Example 4: Reading the Histogram for Short-Term Timing
Scenario: You've identified a bullish setup but want better entry timing.
MACD-V is in Ranging (Bullish) (-50 to 50, above signal)
Histogram is positive but shrinking (light teal) — don't chase yet
Wait for histogram to grow again (dark teal bars) → momentum is re-accelerating
Acceleration area flips from red to teal → confirmation
This sequence often pinpoints within 1-2 bars of the optimal entry
Example 5: The Bearish Divergence Setup
Scenario: A stock is below its daily 200 SMA but MACD-V is in the Rebounding or Reversing zone.
Price is in a longer-term downtrend (below 200 SMA)
A light blue background appears — this is the bearish divergence warning: short-term momentum is recovering, but the bigger picture remains weak
Use this signal to fade bounces or simply avoid longs until the regime and trend realign
Supporting Systems (Optional)
LBR 3/10 Oscillator (Sardine)
Linda Bradford Raschke's classic short-term momentum oscillator, volatility-normalized using the same MACD-V methodology. Toggle on to use as a leading signal for MACD-V crossovers — the 3/10 typically turns before the 12/26.
Elder Impulse Plus Bar Coloring
Combines the direction of a 13-period EMA with the direction of the MACD-VH histogram to color price bars:
🟢 Green: EMA rising + histogram expanding positive → buy
🔴 Red: EMA falling + histogram expanding negative → sell/avoid longs
🔵 Blue: Mixed signals → stand aside
Built-In Alerts
The indicator includes 18 alert conditions, covering:
MACD-V / Signal Line crossovers (bullish & bearish)
Zero line crossovers
Entry into all 8 momentum lifecycle states
Extreme regime signals (Bull + >200, Bear + <-200)
MACD-VH overbought/oversold extremes (±40)
MACD-V direction changes (turned up / turned down)
Set alerts on any condition without having to stay glued to the chart.
Pine Screener Compatible
Four numeric values are plotted to the Data Window for use with TradingView's Pine Screener:
Momentum State # (4 to -4)
MACD-V Direction (1, 0, -1)
Trend Regime # (1, 0, -1)
Acceleration Direction (1, -1)
Screen entire watchlists for, e.g., "Bull regime + Momentum State = Rebounding + Acceleration positive" — a powerful combination for systematic scan-based trading.
Settings Reference
ParameterDefaultPurposeFast / Slow EMA12 / 26MACD-V core calculationATR Length26Volatility normalizationSignal Line9EMA of MACD-VRisk Levels±150Overbought/oversold thresholdsFast/Slow Boundary±50Momentum zone boundariesTrend EMA Length200Regime filterRare Buy/Short Level±100Rare signal thresholdsExtreme Level±200Extreme zone definitionAccel Smooth / Scale5 / 4.0Acceleration sensitivity
Credits & Disclaimer
This indicator is a heavily extended implementation of the MACD-V framework developed by Alex Spiroglou, winner of the 2022 NAAIM Founders Award and Charles H. Dow Award. Full academic methodology is available in the original paper linked above.
This script is published for educational and analytical purposes only. Nothing here constitutes financial advice. All trading involves risk. Past performance of any indicator is not indicative of future results.
指标

MACD Reversal & RSI OB/OS Dots v1.1📊 MACD Reversal + RSI Exhaustion Dots (1s Scalping Tool)
This indicator is designed for ultra-fast scalping environments, specifically optimized for 1-second charts, where precision and timing are critical.
It combines MACD momentum shifts with RSI exhaustion levels to identify potential short-term reversal points and highlight them directly on the price chart using simple visual signals.
⚙️ How It Works
This script detects early momentum reversals by analyzing the MACD histogram:
A bullish reversal is identified when the MACD histogram stops decreasing and begins increasing.
A bearish reversal is identified when the MACD histogram stops increasing and begins decreasing.
To filter out weaker signals, reversals are only considered valid when paired with RSI extreme conditions:
🟢 Green Dot (Bullish Setup)
MACD histogram reverses upward
RSI is oversold (≤ 30)
Plotted below the candle
🔴 Red Dot (Bearish Setup)
MACD histogram reverses downward
RSI is overbought (≥ 70)
Plotted above the candle
🎯 Purpose
This indicator helps traders:
Identify potential reversal points in fast-moving markets
Spot momentum shifts at exhaustion levels
Improve entry timing for scalping strategies
Reduce noise by requiring confluence between two indicators
🚀 Best Use Cases
1-second and low timeframe scalping
Futures trading (e.g., MNQ, NQ, ES)
High-volatility sessions (market open, news events)
Traders looking for quick reaction signals
⚠️ Important Notes
Signals are reactive, not predictive — they confirm a shift that has already started.
On extremely fast timeframes, false signals can occur due to market noise.
Best used in combination with:
Trend direction
Key support/resistance levels
Volume or order flow tools
🔔 Alerts
The script includes alert conditions for both bullish and bearish signals, allowing traders to automate notifications when setups occur.
⚖️ Disclaimer
This indicator is provided for educational and informational purposes only and does not constitute financial advice.
Trading stocks, options, and futures involves substantial risk and is not suitable for every investor. Past performance is not indicative of future results. You are solely responsible for your own trading decisions, risk management, and financial outcomes.
The creator of this script assumes no liability for any losses or damages incurred from the use of this indicator.
💡 Final Thoughts
This tool is intentionally simple, fast, and visual — designed to give traders a clear edge in speed, not complexity.
Use it as a confirmation tool, not a standalone system. 指标