指标
Smart Range ProjectionSmart Range Projection — Daily High/Low Forecast from Opening Volatility
OVERVIEW
This indicator projects the likely shape of the trading day early in the session, anchoring everything to the day's opening price. It plots the expected daily range envelope, an expansion range for potential trend day extension, and reversal zones near the projected extremes where
price often exhausts or turns.
The projection is built from a blend of four independent volatility inputs: daily ATR, opening volatility, CPR width, and an optional VIX multiplier. Once the opening window completes, the levels lock in for the rest of the session and do not shift.
HOW IT WORKS
1. Daily ATR Baseline
The previous day's confirmed ATR sets the expected full-day travel.
A user-defined multiplier (default 1.0x) converts this into the projected day range.
2. Opening Volatility Factor
The indicator measures the high-low range of the first N bars after the session opens (default 3 bars) and compares it to a rolling 20-day average of opening ranges. An unusually wide opening stretches the projection. An unusually narrow opening tightens it. The influence is
user-controlled (default 0.5).
3. CPR Width Lean
Central Pivot Range width is calculated from the previous day's high, low, and close. The current day's CPR width is compared to its 20-day average. A narrow CPR (relative to history) widens the projection because narrow CPRs statistically precede trending or expansion days.
A wide CPR tightens the projection.
4. VIX Multiplier (Optional)
An optional volatility-index input scales the entire projection based on the regime. Above the user-defined neutral level, the range widens.
Below it, the range tightens. Disabled by default. Enable only if your local volatility index is available on TradingView.
5. Reversal and Expansion Zones
- Projected High and Projected Low: the expected daily range envelope
- Expansion High and Low: dashed lines beyond the normal range, marking trend day extension targets
- Reversal Zones: shaded bands just inside the projected extremes where price often exhausts on normal days
- Expansion Zones: shaded bands between the normal envelope and expansion lines, highlighting trend day extension territory
NON-REPAINTING DESIGN
- Prior-day values use historical offset with lookahead_off
- Day open is tracked locally via session change detection
- Projection levels lock once the opening window completes and remain fixed for the rest of the session
- No future data access, no lookahead leak
INPUTS
- Daily ATR length and base range multiplier
- Expansion multiplier and reversal zone percentage
- Opening window bars and volatility influence
- Optional VIX symbol, neutral level, and toggle
- CPR lean toggle, dashboard toggle, level rounding toggle
- Color customization for all elements
DASHBOARD
A status panel shows projected high and low, expansion high and low, day lean classification (Trend or Range bias from CPR width), measured opening volatility, and the active VIX multiplier.
ALERTS
Four alert conditions are available:
- Price reached projected day high
- Price reached projected day low
- Price hit expansion high (trend day extension)
- Price hit expansion low (trend day extension)
HOW TO USE
The projected high and low serve as the day's expected range boundaries.
Price reaching these zones early often coincides with exhaustion on range days. The expansion lines act as continuation targets when strong directional moves break the normal range envelope.
The day lean classification in the dashboard helps set expectations.
A Trend lean (narrow CPR) suggests price is more likely to reach the expansion lines. A Range lean (wide CPR) suggests price is more likely to oscillate within the normal envelope and reverse at the extremes.
This indicator works on intraday timeframes where multiple bars fit within a session. It is most effective on actively traded instruments with reliable opening sessions.
NOTES
This is a technical analysis tool intended for educational and informational purposes. Volatility projections are statistical estimates based on historical patterns and do not guarantee price will reach the projected levels. Always apply proper risk management and combine with
your own trading methodology.
CREDITS
Original implementation. Uses TradingView built-in ATR, security, and array functions combined with original opening volatility and CPR width lean methodology. 指标

Skew MTF Trend + Regime (fork)Skew MTF Trend + Regime, a fork of "Skew MTF Trend" by Skew (@52kskew), used with credit. All original trend logic is his; this version adds one column.
What's added: a "Regime" dot next to each timeframe's direction arrow, describing the character of the move right now:
- green = ORDERLY (clean move)
- amber = CHOPPY (volatility expanding)
- red = WHIPSAW (volatility spiking, MA read noisy)
How: per timeframe, ratio of short- to long-window realized volatility: stdev(log returns, 5) / stdev(log returns, 30). Above 1.4 = amber, above 2.0 = red.
What it is / isn't: it describes how the trend is behaving, not where price goes next. It is not a buy/sell signal, and it has no predictive edge (tested on BTC daily, it does not call tops or bottoms). Treat it as situational awareness: orderly vs choppy.
Note: the table reflects the developing higher-timeframe bar, so the current cell updates until that bar closes (same behavior as the underlying trend arrows).
Original: 指标

策略
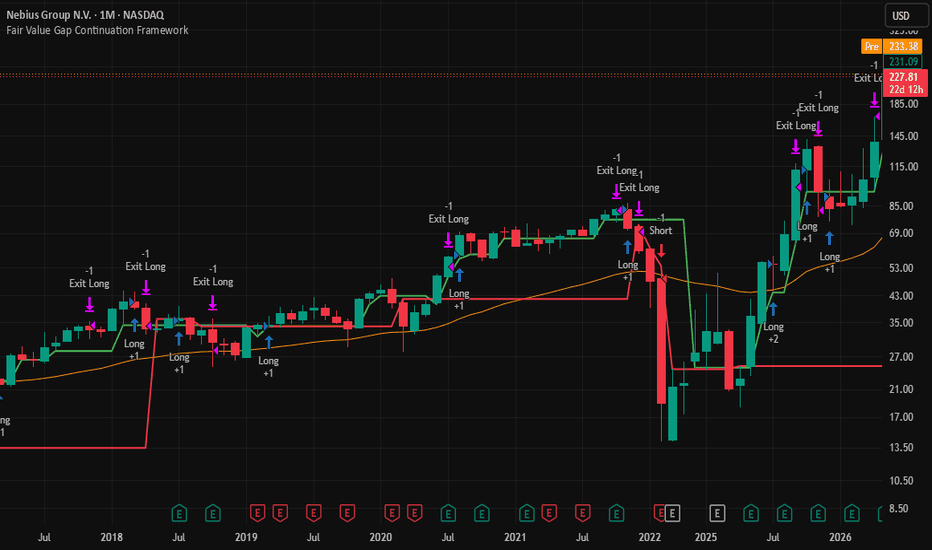
Donchian Quantile Channel [forexobroker]Donchian Quantile Channel replaces the classic Donchian min/max envelope with robust order-statistics. The upper rail is the 90th-percentile high, the lower rail is the 10th-percentile low, and the middle spine is the 50th-percentile close, all measured over the same lookback. Channel width is then ranked against its own 200-bar history to mark expansion versus compression. Breakouts only fire when the channel is in the expansion half of its own history, which screens out quiet-channel pokes that classic Donchian treats the same as real range breaks.
🔶 ALGORITHM
1. A lookback N (default 50) defines the quantile window.
2. Upper rail = percentile_nearest_rank(high, N, 90); spine = percentile_nearest_rank(close, N, 50); lower rail = percentile_nearest_rank(low, N, 10). Using percentile_nearest_rank ignores single extreme prints that would otherwise pin a min/max envelope.
3. Width = upper - lower, ranked over the width-rank lookback (default 200 bars) using percentrank.
4. The expansion gate compares the current width rank to the Min Width Rank input (default 50). Above the threshold means the channel is wider than half its own history.
5. Crossovers of close against the upper or lower rail are detected with crossover/crossunder.
6. Signals only fire when a rail is broken inside the expansion regime, position state is flat or opposite, cooldown is satisfied and barstate.isconfirmed is true.
🔶 SIGNAL LOGIC
- Buy: close crosses above the upper quantile AND width rank is above the minimum AND session filter passes AND not already long AND cooldown bars elapsed AND barstate.isconfirmed.
- Sell: close crosses below the lower quantile AND width rank is above the minimum AND session filter passes AND not already short AND cooldown bars elapsed AND barstate.isconfirmed.
A single posState flag prevents same-side re-entry until the opposite signal resets it.
🔶 INPUTS
- Channel group: quantile lookback N default 50, upper percentile default 90, middle default 50, lower default 10, width-rank lookback default 200.
- Signal Logic group: min width rank percent (default 50) for the expansion gate, cooldown bars default 15.
- Filters group: session restriction toggle off by default with a 0000-2400 default window.
- Visual group: gradient fill, dashboard, 3-layer glow toggles plus full color overrides and dashboard background.
🔶 ALERTS
DQC Buy, DQC Sell, DQC Any Signal, DQC Upper Break, DQC Lower Break, DQC Spine Cross Up, DQC Spine Cross Dn, DQC Expansion, DQC Compression, DQC Extreme Width, DQC Extreme Squeeze, DQC Webhook JSON.
🔶 LIMITATIONS
- Percentile rails are step-like; on short lookbacks they move only when a window slot rolls off, so the channel can sit flat for several bars even as price moves.
- The expansion gate hides breakouts in quiet markets; on instruments that habitually trend on low realised range the filter will skip valid trades.
- Cooldown is a fixed bar count; it does not adapt to timeframe shifts.
- Percentiles are non-anticipatory but the channel itself only stabilises once N bars of history exist; early history shows wider, less reliable rails.
- The instrument target is ES; on illiquid symbols the upper/lower rails can be pinned to the same single print across multiple bars.
指标

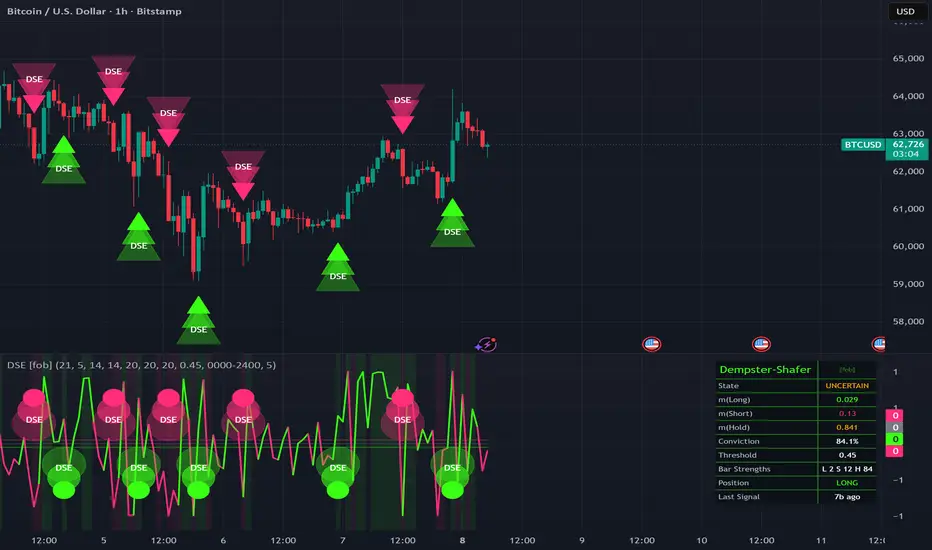
Dempster-Shafer Evidence Fusion [forexobroker]Dempster-Shafer Evidence Fusion combines six independent child evidences (EMA slope, RSI deviation, ATR-normalized return, signed volume z-score, range-expansion conviction, close-in-range positioning) into a single mass distribution over the hypothesis frame {Long, Short, Hold} using Dempster's rule of combination. Unlike a weighted-average composite where conflicting child signals dilute the score, Dempster-Shafer explicitly tracks epistemic uncertainty as a separate Hold mass and resolves conflict via a conflict denominator, so the combined output is properly normalized and the Hold mass quantifies disagreement among children. The unique angle is principled belief fusion rather than ad hoc voting or averaging.
🔶 ALGORITHM
1. Six child evidences are computed each bar. Each child produces a signed strength in (-1, 1).
2. Strength is mapped to a mass triplet: m(Long) = max(s,0) * |s|, m(Short) = -min(s,0) * |s|, m(Hold) = 1 - |s|. Sums equal one.
3. Children: (1) ATR-normalized EMA slope, tanh-squashed; (2) (RSI - 50)/50; (3) tanh of (close - close )/atr; (4) signed volume z-score, tanh-squashed; (5) range-expansion ratio signed by return direction, tanh-squashed; (6) (close - lowest(low,N))/(highest(high,N) - lowest(low,N)) re-centered to (-1, 1).
4. Pair-wise Dempster fusion: for two evidences (m1, m2), conflict K = m1(L)m2(S) + m1(S)m2(L); m12(L) = (m1(L)m2(L) + m1(L)m2(H) + m1(H)m2(L)) / (1-K). Symmetric for Short. Hold collects m1(H)m2(H)/(1-K). After fusion the triplet is renormalized for floating-point safety.
5. All six evidences are cascaded pair-by-pair to a final triplet (m_L, m_S, m_H).
6. Conviction equals max(m_L, m_S, m_H). The threshold (default 0.55) defines when one hypothesis dominates.
7. A signal fires when the dominant mass exceeds the threshold and standard gates pass.
🔶 SIGNAL LOGIC
- Buy: combined m(Long) above the signal threshold AND session filter passes AND position is not already long AND cooldown bars elapsed AND barstate.isconfirmed.
- Sell: combined m(Short) above the signal threshold AND session filter passes AND position is not already short AND cooldown bars elapsed AND barstate.isconfirmed.
Because m(L) + m(S) + m(H) = 1 by construction, both buy and sell cannot trigger on the same bar; ties resolve as Hold.
🔶 INPUTS
- Calculation group: EMA Length (default 21), EMA Lookback (default 5), RSI Length (default 14), ATR Length (default 14), Volume StDev Len (default 20), Range Avg Length (default 20), Position-In-Range Len (default 20).
- Signal Logic group: Combined Mass Threshold (default 0.55), cooldown bars (default 15).
- Filters group: optional session restriction (default 0000-2400).
- Visual group: dashboard toggle, 3-layer glow toggle, long/short/hold colors and dashboard background.
🔶 ALERTS
DSE Buy, DSE Sell, DSE Any Signal, DSE Long Cross, DSE Short Cross, DSE Uncertain, DSE High Conviction, DSE Net Long, DSE Net Short, DSE Webhook JSON.
🔶 LIMITATIONS
- Dempster's rule is sensitive to high-conflict situations; when child signals disagree strongly the denominator (1-K) becomes small and a near-zero numerator can amplify noise. The script floors the denominator at 1e-10.
- Six children all derived from the same OHLCV stream are not strictly independent evidences; the assumption underlying classical Dempster-Shafer is somewhat relaxed here.
- The tanh squashing of slope, return, and volume scales is opinionated; instruments with very different volatility profiles may need different child mapping ranges.
- A high conviction Hold mass means children disagree; this is information, not a problem to fix, but it does mean stretches of low signal density are expected.
- Volume is used as an evidence input; on symbols without exchange volume that child collapses to near-zero strength and the remaining five carry the consensus.
指标

Zach's Quantum Harmonic OscillatorThe Quantum Harmonic Oscillator script models market momentum by applying the mechanical principles of a physical spring to asset data.
Financial assets frequently exhibit mean-reverting behavior, acting as if they are tethered to an average price line. Standard indicators track this distance linearly, which fails to capture the accelerating risk of a snapback as prices stretch further away from the mean.
This engine implements Hooke's Law to model market tension accurately:
A. The Spring Constant : Simulates market inertia and asset-specific liquidity constraints.
B. Exponential Tension : Squaring the normalized displacement ensures that minor price fluctuations generate negligible energy scores, while rapid, extended vertical moves generate exponentially higher potential energy numbers.
C. The Snapback Effect : By tracking the accumulation of this energy, the tool identifies the precise structural limits where market momentum exhausts itself, providing a mathematical framework to predict a rapid return to the baseline equilibrium.
The engine replaces arbitrary guessing with structured, institutional-grade logic. By applying a nonlinear potential energy model U = 0.5 * k * x**2, it isolates deep structural exhaustion from normal market noise. Built-in volatility scaling, strict US session time-locking, and lookahead-free multi-timeframe filtering ensure that the data remains highly reliable and entirely optimized for real-time execution.
Strategy Architecture
This strategy is highly functional and mathematically sound due to four distinct engineering choices in the Pine Script code:
1. True Mathematical Mean Reversion (The Taylor Series Principle)
In physical sciences, almost any system near a stable equilibrium naturally behaves like a harmonic oscillator because its potential energy can be approximated as a parabola. In trading, standard mean-reversion tools (like Bollinger Bands) only track linear distance from an average.
- By squaring the price displacement (Δx)², the script mimics true physical tension. Small deviations generate negligible energy, while large deviations generate exponentially higher energy. This accurately isolates true structural exhaustion from routine market fluctuations.
2. Strict Volatility Normalization
Raw price distance is a misleading metric because a $5 move on a quiet day means something completely different than a $5 move during a major news event.
- The script divides the price displacement by standard deviation. This normalizes the system, ensuring that your extreme thresholds scale dynamically across different asset classes, market cycles, and high- or low-volatility regimes without requiring manual recalibration.
3. Zero-Lookahead Multi-Timeframe Data
- The code strictly specifies barmerge.lookahead_off. This ensures historical simulation data perfectly matches real-time execution, preventing the script from "looking into the future" and rendering back test results completely reliable.
4. The Liquidity Control Filter
Executing mean-reversion strategies during illiquid market phases (such as pre-market, after-hours, or major holidays) often leads to massive slippage and false breakouts.
- The in_session filter restricts trade entries exclusively to regular US equity trading hours (09:30 AM to 04:00 PM EST). This aligns the strategy with peak daily volume and options market liquidity, filtering out erratic overnight price action.
Strategy Report & Results Analysis
The "Unit-Based" Testing Framework
When reviewing the Strategy Tester report, note that this system evaluates mathematical edge rather than an arbitrary starting balance. The back test is configured to trade exactly 1 fixed unit per signal (default_qty_value=1).
- Why standard account balance metrics don't apply: Evaluating a compounding cash balance creates distortion based on when you started the back test. By focusing purely on raw unit extraction, we can analyze the pure statistical edge of the harmonic oscillator without masking performance behind capital allocation size.
- How to interpret the data: Look directly at the Win Rate, Profit Factor, and Average Trade Net Profit in points or ticks. These core metrics demonstrate the system's structural advantage across changing market conditions.
Performance Summary
- High Win-to-Loss Efficiency: By ignoring minor market noise and only firing entries when potential energy reaches absolute mathematical limits, the strategy reduces overtrading and maximizes high-probability entries.
- Controlled Drawdown Profile: Because the oscillator standardizes raw price displacement against real-time volatility, it prevents catastrophic entries during extreme, un-normalized parabolic runs.
- Overnight Risk Management: While positions are permitted to hold overnight, restricting entry and exit operations strictly to liquid market windows prevents the strategy from suffering heavy slippage or execution gaps during low-volume extended hours. 策略

指标
指标
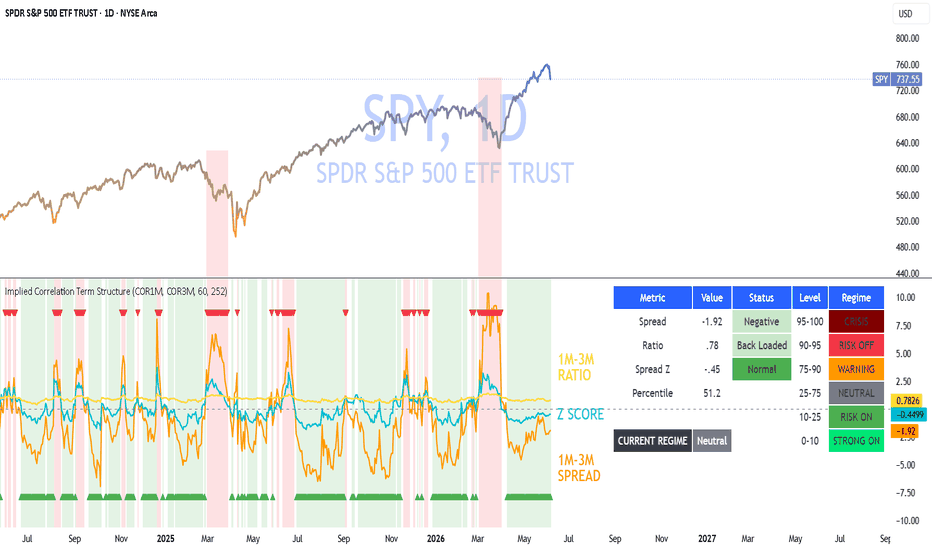
Liquidity Sweeps [Quantum Algo]Liquidity Sweeps is an open-source liquidity sweep indicator that maps resting
liquidity at swing highs and swing lows, then flags the exact moment that liquidity is swept and
rejected — the classic stop-hunt behaviour traders watch for in Smart Money Concepts (SMC).
WHAT IS A LIQUIDITY SWEEP?
A liquidity sweep (also called a liquidity grab or stop hunt) happens when price briefly spikes
beyond an obvious swing high or swing low — where stop-loss and breakout orders rest — and then
closes back inside the prior range. The wick takes the liquidity; the close shows the breakout
failed. Liquidity sitting above swing highs is buy-side liquidity (BSL); liquidity sitting below
swing lows is sell-side liquidity (SSL).
A bearish liquidity sweep occurs when buy-side liquidity above a swing high is swept and price
closes back below it. A bullish liquidity sweep occurs when sell-side liquidity below a swing low
is swept and price closes back above it.
HOW THE INDICATOR WORKS
- It detects confirmed swing highs and swing lows using a configurable pivot strength, and draws a
liquidity level at each one. Buy-side levels sit above price; sell-side levels sit below.
- Each level extends to the right until it is interacted with.
- When a candle wicks through a level but closes back inside, the indicator marks a liquidity
sweep with a label and an optional highlight on the sweeping wick.
- An optional volume filter confirms only sweeps where the sweeping candle trades above its
average volume, filtering out low-conviction wicks.
- If price instead closes fully through a level, that is treated as a clean break (a plain
liquidity grab / breakout), not a sweep, and the level is retired without a signal.
WHAT IT SHOWS
- Mapped buy-side (BSL) and sell-side (SSL) liquidity levels.
- Bullish and bearish liquidity sweep markers, the moment a level is swept and rejected.
- Optional wick highlighting on the sweep candle.
- A dashboard showing bullish/bearish sweep counts, the last sweep direction, and the nearest
un-swept buy-side and sell-side levels with their percentage distance from price.
HOW TO USE IT
Liquidity sweeps are most useful as a timing and context tool, not a standalone buy/sell system.
A common workflow:
- Mark the obvious highs and lows where liquidity is likely resting.
- Wait for a sweep into one of those pools (a wick through, close back inside), ideally with the
volume filter confirming participation.
- Look for confirmation in your own process — a market-structure shift, an order block, a
fair-value-gap fill, or higher-timeframe trend alignment — before acting.
- A bearish sweep above resistance can precede a move down; a bullish sweep below support can
precede a move up. Always define risk beyond the swept extreme.
SETTINGS
- Pivot Strength: how many bars define a swing; higher values keep only major liquidity pools.
- Max Levels per Side: how many recent levels to keep mapped.
- Volume Confirmation: toggle, average length, and multiplier to qualify a sweep.
- Treat Clean Breaks as Grabs: retire levels that are broken through rather than swept.
- Line width, style, and transparency for clear level visibility.
- Full colour controls and a movable dashboard.
ALERTS
Three named alert conditions are included: Bullish Liquidity Sweep, Bearish Liquidity Sweep, and
Any Liquidity Sweep.
DISCLAIMER
For educational purposes only. This is a technical analysis tool, not financial advice, and it does
not predict price. Trading involves risk and you can lose your capital. No indicator is profitable
on its own — always do your own research and use proper risk management. 指标

Realized Volatility Regime Indicator [v1]Realised Volatility Regime Indicator
The Realised Volatility Regime Indicator is designed to help traders understand the current volatility environment of a market.
This is not a buy or sell signal indicator. It is a volatility regime filter that helps traders decide whether the market is in a low, normal, high, or extreme volatility state.
The indicator is useful for identifying whether conditions are better suited to breakout preparation, normal trading, momentum continuation, volatility shock management, or post-shock cooling.
It can be used across FX, crypto, indices, commodities, futures, and liquid stocks.
━━━━━━━━━━━━━━━━━━━━━━
WHAT THE INDICATOR MEASURES
━━━━━━━━━━━━━━━━━━━━━━
The indicator calculates realized volatility from recent price changes using log returns.
It then annualizes that volatility and compares the current reading to its own historical range using percentile ranking.
This allows the indicator to classify volatility relative to the asset’s own recent behaviour.
For example, EUR/USD and Bitcoin naturally have different volatility profiles. Instead of comparing raw volatility values, this indicator asks:
“Is current volatility high or low relative to this market’s own recent history?”
That makes the tool more adaptive across different asset classes and timeframes.
━━━━━━━━━━━━━━━━━━━━━━
MAIN COMPONENTS
━━━━━━━━━━━━━━━━━━━━━━
1. Realised Volatility
Realised volatility measures how much the price has actually moved over a selected lookback period.
Higher realised volatility means the price has been moving more aggressively.
Lower realised volatility means the price has been more compressed.
2. Annualised Realised Volatility
The indicator converts per-bar volatility into an annualised volatility value using the Bars Per Year input.
Suggested Bars Per Year settings:
• Daily FX / indices: 252
• Daily crypto: 365
• 1-hour FX: approximately 6240
• 1-hour crypto: approximately 8760
The annualised volatility value is shown in the dashboard.
3. Volatility Percentile
The volatility percentile is the main plotted line.
It shows where current realised volatility ranks compared to recent historical volatility.
General interpretation:
• 0–25%: Low volatility
• 25–75%: Normal volatility
• 75–90%: High volatility
• Above 90%: Extreme volatility
The percentile method is more adaptive than using fixed volatility levels.
4. Volatility Direction
The indicator also shows whether volatility is:
• Expanding
• Contracting
• Flat
This matters because high volatility with expansion is different from high volatility with contraction.
For example:
• High volatility + expanding = momentum conditions may be active
• High volatility + contracting = cooling or exhaustion may be developing
• Low volatility + contracting = compression may be building
5. Market State
The dashboard classifies the market into one of the following states:
• Compression
• Expansion
• Vol Shock
• Cooling
• Neutral
These states are designed to provide a quick summary of the current volatility environment.
━━━━━━━━━━━━━━━━━━━━━━
VOLATILITY REGIMES
━━━━━━━━━━━━━━━━━━━━━━
Low Vol
Low Vol means volatility is compressed relative to recent history.
This can suggest:
• Quiet market conditions
• Narrower price ranges
• Lower realized movement
• Breakout risk may be building
Low volatility does not predict direction. It only tells the trader that the market is compressed.
Common use cases:
• Prepare for breakout setups
• Monitor range boundaries
• Avoid forcing trades inside tight ranges
• Wait for volatility expansion confirmation
Normal Vol
Normal Vol means volatility is within its average historical range.
This is usually the most balanced environment.
Common use cases:
• Standard position sizing
• Normal stop placement
• Trend or range trading depending on price structure
• Standard technical confirmation
High Vol
High Vol means volatility is elevated relative to recent history.
This can indicate:
• Stronger directional movement
• Wider ranges
• Higher uncertainty
• Greater stop-loss risk
• Better momentum conditions
Common use cases:
• Reduce position size
• Use wider stops
• Avoid tight entries
• Look for continuation if volatility is still expanding
• Avoid fading strong moves too early
Extreme Vol
Extreme Vol means volatility is in the upper range of its recent history.
This often appears around:
• Central bank decisions
• CPI / inflation data
• NFP or labour market data
• Earnings shocks
• Geopolitical events
• Crypto liquidation cascades
• Flash crashes
• Major breakouts or breakdowns
Common use cases:
• Reduce exposure
• Avoid excessive leverage
• Avoid chasing large candles
• Wait for structure to stabilize
• Watch for cooling before considering mean reversion
Extreme volatility is not automatically a reversal signal. Markets can remain extreme for longer than expected.
━━━━━━━━━━━━━━━━━━━━━━
MARKET STATE DEFINITIONS
━━━━━━━━━━━━━━━━━━━━━━
Compression
Compression occurs when volatility is low and still falling.
This may indicate that the market is coiling before a larger move, but it does not predict direction.
Use compression to prepare, not to predict.
Expansion
Expansion occurs when volatility is high and rising.
This may support breakout or momentum conditions.
In expansion regimes, traders should be careful about fading strong directional moves too early.
Vol Shock
Vol Shock occurs when volatility is extreme and still rising.
This is a high-risk environment.
It may reflect:
• News repricing
• Panic movement
• Liquidation pressure
• Stop cascades
• Forced positioning adjustment
• Macro repricing
During Vol Shock conditions, risk control is more important than signal chasing.
Cooling
Cooling occurs when volatility is still elevated but has started to contract.
This may suggest the initial shock or momentum burst is slowing.
Cooling is not a reversal signal by itself. It simply means volatility pressure is easing.
Better reversal confirmation may require:
• Failed continuation
• Break of short-term structure
• Return inside a prior range
• Reclaim of a key moving average
• Re-entry after an extreme move
Neutral
Neutral means there is no strong volatility condition.
In this state, traders should rely more heavily on price structure, trend, support/resistance, and normal trade rules.
━━━━━━━━━━━━━━━━━━━━━━
HOW TO READ THE INDICATOR
━━━━━━━━━━━━━━━━━━━━━━
The main line is the volatility percentile.
Colour guide:
• Green = Low Vol
• Blue = Normal Vol
• Orange = High Vol
• Red = Extreme Vol
The dashboard shows:
• Vol Regime
• Annualized Realized Volatility
• Volatility Percentile
• Vol Direction
• Regime Score
• Market State
Regime Score:
• 1 = Low Vol
• 2 = Normal Vol
• 3 = High Vol
• 4 = Extreme Vol
━━━━━━━━━━━━━━━━━━━━━━
HOW TO USE THE INDICATOR
━━━━━━━━━━━━━━━━━━━━━━
Use this indicator as a regime filter.
The main purpose is to help decide what type of trading approach is better suited to current market conditions.
Suggested interpretation:
• Low Vol + Compression: prepare for breakout, but wait for direction
• Normal Vol: use standard technical trading rules
• High Vol + Expansion: momentum continuation may be more likely
• Extreme Vol + Vol Shock: reduce size and avoid chasing
• High / Extreme Vol + Cooling: monitor for exhaustion or mean-reversion confirmation
The indicator should not be used as a standalone signal. Volatility tells you about the trading environment, not direction.
━━━━━━━━━━━━━━━━━━━━━━
PRACTICAL TRADING WORKFLOW
━━━━━━━━━━━━━━━━━━━━━━
1. Identify the current volatility regime.
Check whether the market is in Low Vol, Normal Vol, High Vol, or Extreme Vol.
2. Check volatility direction.
Is volatility expanding, contracting, or flat?
3. Match the strategy to the regime.
Low volatility may favour breakout preparation.
High volatility may favour momentum continuation.
Extreme volatility may require defensive risk management.
Cooling may support watching for failed continuation or exhaustion.
4. Adjust risk.
As volatility rises, position size should generally fall.
High volatility regimes often require wider stops and smaller size.
5. Use price structure for entries.
Do not enter trades based only on volatility.
Use support/resistance, trend, market structure, liquidity zones, or other confirmation.
━━━━━━━━━━━━━━━━━━━━━━
SUGGESTED SETTINGS
━━━━━━━━━━━━━━━━━━━━━━
FX 1-Hour
• Realized Volatility Lookback: 30 to 50
• Bars Per Year: 6240
• Volatility Percentile Lookback: 252
• Smooth Volatility: True
• Smoothing Length: 5
Daily FX / Indices
• Realized Volatility Lookback: 20 to 30
• Bars Per Year: 252
• Volatility Percentile Lookback: 252
• Smooth Volatility: True
• Smoothing Length: 3 to 5
Crypto 1-Hour
• Realized Volatility Lookback: 50
• Bars Per Year: 8760
• Volatility Percentile Lookback: 500
• Smooth Volatility: True
• Smoothing Length: 5 to 10
Daily Crypto
• Realized Volatility Lookback: 20 to 30
• Bars Per Year: 365
• Volatility Percentile Lookback: 365
• Smooth Volatility: True
• Smoothing Length: 3 to 5
━━━━━━━━━━━━━━━━━━━━━━
HOW TO COMBINE WITH EXPECTED MOVE BANDS
━━━━━━━━━━━━━━━━━━━━━━
This indicator pairs well with an expected-move projection indicator.
The Realized Volatility Regime Indicator tells you what volatility environment the market is in.
Expected Move Bands tell you where price may reasonably move over a selected horizon.
Suggested combined framework:
• Low Vol / Compression: expected move bands may be narrow; breakout risk may be building
• Normal Vol: use 1σ and 2σ expected move levels normally
• High Vol / Expansion: momentum continuation may be more likely
• Extreme Vol / Shock: reduce size and avoid chasing into extreme levels
• High or Extreme Vol Cooling: watch for re-entry, exhaustion, or failed continuation
━━━━━━━━━━━━━━━━━━━━━━
EXAMPLES
━━━━━━━━━━━━━━━━━━━━━━
Example 1: Low Volatility Compression
If the dashboard shows:
• Vol Regime: Low Vol
• Vol Direction: Contracting
• Market State: Compression
This means the market is quiet and compressed.
A trader may prepare breakout alerts above resistance and below support, but should wait for price confirmation.
Example 2: High Volatility Expansion
If the dashboard shows:
• Vol Regime: High Vol
• Vol Direction: Expanding
• Market State: Expansion
This means volatility is rising and momentum conditions may be active.
A trader may favour continuation setups, avoid tight stops, and avoid fading strong moves too early.
Example 3: Extreme Volatility Shock
If the dashboard shows:
• Vol Regime: Extreme Vol
• Vol Direction: Expanding
• Market State: Vol Shock
This means the market is in a stress condition.
A trader may reduce exposure, avoid over-leverage, and wait for stabilization before entering new trades.
Example 4: Extreme Volatility Cooling
If the dashboard shows:
• Vol Regime: Extreme Vol
• Vol Direction: Contracting
• Market State: Cooling
This means volatility remains elevated, but the shock is starting to fade.
A trader may monitor for failed continuation or mean-reversion confirmation, but should not assume an automatic reversal.
━━━━━━━━━━━━━━━━━━━━━━
RISK MANAGEMENT NOTES
━━━━━━━━━━━━━━━━━━━━━━
This indicator is especially useful for risk adjustment.
Possible applications:
• Reduce size during High Vol and Extreme Vol regimes
• Avoid tight stops when volatility is expanding
• Avoid over-targeting trades when volatility is compressed
• Use wider stops only if position size is reduced
• Avoid fading extreme moves without confirmation
• Use compression regimes to prepare, not predict
• Use cooling regimes to monitor possible exhaustion
A practical rule:
As volatility rises, position size should generally fall.
━━━━━━━━━━━━━━━━━━━━━━
WHAT THIS INDICATOR IS BEST FOR
━━━━━━━━━━━━━━━━━━━━━━
This indicator is best used for:
• Volatility regime detection
• Market environment filtering
• Risk management
• Breakout preparation
• Momentum confirmation
• Volatility shock detection
• Strategy selection
• Trade sizing context
It is most useful when combined with price action, market structure, support/resistance, trend filters, and macro or event awareness.
━━━━━━━━━━━━━━━━━━━━━━
WHAT THIS INDICATOR IS NOT
━━━━━━━━━━━━━━━━━━━━━━
This indicator is not:
• A standalone trading strategy
• A buy/sell signal generator
• A prediction model
• A guarantee of future volatility
• A replacement for risk management
• A complete trading system
Volatility describes the market environment. It does not tell you direction by itself.
━━━━━━━━━━━━━━━━━━━━━━
IMPORTANT LIMITATIONS
━━━━━━━━━━━━━━━━━━━━━━
The indicator uses historical realized volatility. It does not know future volatility.
Volatility can change rapidly after:
• Economic data releases
• Central bank decisions
• Earnings reports
• Geopolitical events
• Liquidity shocks
• Crypto liquidation cascades
• Market open or close effects
The indicator does not include:
• Options implied volatility
• Order flow
• Market depth
• Positioning data
• Fundamental data
• News sentiment
• Liquidity conditions
Use it as a decision-support tool, not as a standalone trading system.
━━━━━━━━━━━━━━━━━━━━━━
FINAL NOTES
━━━━━━━━━━━━━━━━━━━━━━
The Realized Volatility Regime Indicator helps traders think in terms of volatility, risk, and regime.
Instead of asking only whether price is bullish or bearish, this tool helps answer:
• Is the market quiet or active?
• Is volatility rising or falling?
• Is the market compressed or expanding?
• Is the current move part of a volatility shock?
• Should I use normal size, reduce size, or wait?
• Is this environment better for breakout, momentum, range, or defensive trading?
The indicator is designed to improve trade context and risk discipline.
指标

BB Squeeze BreakoutBB Squeeze Breakout
Precision Breakout is a volatility compression and breakout indicator based on Bollinger Bands, Keltner Channels, momentum filters, volume confirmation, and ATR-based risk levels.
The goal of this tool is to help traders read when price is compressing, when volatility starts expanding again, and whether a breakout has enough confirmation to be considered stronger or weaker.
This indicator is not a trading system by itself. It is made to support chart reading and should be used together with market structure, support and resistance, liquidity zones, session context, and personal risk management.
────────────────────────────
MAIN IDEA
────────────────────────────
Markets often move through two phases:
1. Compression
Price contracts, Bollinger Bands become tighter, and the market prepares for a possible expansion.
2. Expansion
Price breaks outside the bands, volatility increases, and a directional move can start.
This script tracks those phases with:
- Bollinger Bands
- Keltner Channels
- Squeeze detection
- Bollinger Bandwidth
- %B position
- Candle quality
- RSI momentum
- Volume expansion
- OBV confirmation
- MFI confirmation
- A/D confirmation
- ADX trend strength
- MACD confirmation
- EMA trend filter
- ATR-based SL and TP levels
- A dashboard for quick reading
────────────────────────────
HOW THE SIGNALS WORK
────────────────────────────
A bullish breakout appears when price closes above the upper Bollinger Band for the required number of confirmation bars.
A bearish breakout appears when price closes below the lower Bollinger Band for the required number of confirmation bars.
The script then checks additional conditions such as candle body quality, momentum, volume, OBV slope, MACD behavior, ATR expansion, Bollinger Bandwidth expansion, and post-squeeze context.
The final signal depends on the confluence score and the selected filters.
A strong signal means that the breakout structure is present and the required confirmations are aligned.
A weak signal means that price broke outside the Bollinger Band, but the score or one of the active filters was not strong enough.
────────────────────────────
MINI TUTORIAL FOR BEGINNERS
────────────────────────────
1. Add the indicator to the chart.
2. Start with the default settings.
3. Look for a squeeze phase, where Bollinger Bands compress inside the Keltner Channel.
4. Wait for a squeeze release or a confirmed breakout outside the Bollinger Bands.
5. Check the dashboard:
- Squeeze: shows if compression is active.
- Post-SQ: shows if the market recently left a squeeze.
- BandWidth: shows if volatility is low or expanding.
- %B: shows where price is inside or outside the bands.
- SNIPER: shows the current confluence score.
- Signal: shows BUY, SELL, WEAK BUY, WEAK SELL, or WAIT.
6. If a signal appears, check if it agrees with the trend, support/resistance, and market structure.
7. Use the ATR-based Entry, SL, TP1, TP2, and TP3 levels as visual planning references.
8. Do not take a signal blindly. Always check the context before making a decision.
────────────────────────────
EXAMPLE CASES
────────────────────────────
Example 1: Bullish post-squeeze breakout
Price has been moving sideways, the Bollinger Bands are tight, and the squeeze is active. Then price closes above the upper Bollinger Band with a strong candle, rising volume, improving RSI, and expanding bandwidth. The dashboard shows a bullish score above the minimum threshold. A BUY label can appear, and the ATR risk levels show Entry, SL, TP1, TP2, and TP3.
Example 2: Bearish breakdown
Price loses support and closes below the lower Bollinger Band. RSI moves below 50, OBV weakens, MACD confirms downside pressure, and the candle closes near the low of its range. If the score and active filters agree, a SELL label can appear.
Example 3: Weak breakout
Price closes outside the Bollinger Band, but the candle is small, volume is not expanding, or momentum is weak. In this case, the script can show a WEAK signal instead of a confirmed one. This means the structure exists, but confirmation is not strong enough.
Example 4: Head fake
Price briefly breaks outside a band, then moves back inside the Bollinger structure. The script can mark this as a possible head fake. This helps identify failed breakouts, especially in choppy or low-volume markets.
Example 5: Band walk
During strong trends, price can continue moving along the upper or lower Bollinger Band. The script marks these band walk conditions to show possible trend continuation behavior.
────────────────────────────
INPUTS EXPLAINED
────────────────────────────
BOLLINGER BANDS
BB Length
Controls the moving average period used for the Bollinger Band basis. The default value is 20, which is the classic Bollinger setting.
BB StdDev
Controls the standard deviation multiplier used to build the upper and lower bands. The default value is 2.0, which is the common standard setting.
Neon Glow
Adds a visual glow effect around the Bollinger Bands.
Heat Zone
Colors the area between the Bollinger Bands depending on price position inside the band range.
────────────────────────────
KELTNER / SQUEEZE
Keltner Length
Controls the length used for the Keltner Channel calculation.
Keltner Mult
Controls the ATR multiplier used to build the Keltner Channel.
Show Keltner
Shows or hides the Keltner Channel on the chart.
Post-Squeeze Window
Defines how many bars after a squeeze release are still considered part of the post-squeeze phase.
Squeeze Ready Lookback
Looks back over a selected number of bars to detect when Bollinger Bandwidth is near a low-compression zone.
Show Squeeze Dots
Shows dots during squeeze conditions and squeeze release events.
────────────────────────────
BREAKOUT SIGNALS
Confirmation Bars
Defines how many consecutive closes outside the Bollinger Band are required before confirming a breakout.
Show BUY/SELL Labels
Shows or hides the main BUY and SELL labels.
Show Arrows
Shows or hides the arrow markers on the chart.
Show Tiny Info Labels
Shows or hides smaller labels such as weak signals and head fake warnings.
Head Fake Lookback
Controls how many bars are checked to detect a failed breakout after price moved outside a band.
Band Walk Bars
Controls how many bars are required to detect a band walk condition.
────────────────────────────
SNIPER ENGINE
Min Confluence Score
Sets the minimum score required for a confirmed signal. A higher value gives fewer signals but requires stronger confirmation.
Min Body/Range Ratio
Defines how large the candle body must be compared to the full candle range. This helps filter weak candles and dojis.
Close Must Be In Top/Bot %
For bullish candles, the close should be near the top of the range. For bearish candles, the close should be near the bottom of the range.
ATR Expansion Factor
Checks if current ATR is expanding compared to its average. This helps confirm volatility expansion.
Require Momentum Acceleration
Uses momentum behavior, mainly RSI acceleration, as part of the confirmation logic.
Require Volume Expansion
Uses volume expansion as part of the breakout quality reading.
Require BB Width Expansion
Checks if Bollinger Bandwidth is expanding during the breakout.
Anti-Wick Rejection Filter
Helps reject breakouts when the previous candle shows a strong wick against the breakout direction.
────────────────────────────
FILTERS
Use RSI Filter
Activates or disables RSI confirmation.
RSI Length
Controls the RSI calculation period.
Use OBV Filter
Activates or disables OBV confirmation.
Use Volume Spike Filter
Activates or disables volume spike confirmation.
Volume MA Length
Controls the moving average length used to compare current volume.
Volume Min x MA
Defines how much current volume must exceed the volume average.
Use MFI Filter
Activates or disables Money Flow Index confirmation.
MFI Length
Controls the MFI calculation period.
Use A/D Filter
Activates or disables Accumulation/Distribution confirmation.
Use ADX Filter
Activates or disables ADX trend strength confirmation.
ADX Length
Controls the ADX calculation period.
ADX Min
Defines the minimum ADX value required when the ADX filter is active.
Use MACD Filter
Activates or disables MACD confirmation.
Use EMA Trend Filter
Activates or disables EMA trend confirmation.
EMA Fast
Controls the fast EMA length.
EMA Slow
Controls the slow EMA length.
────────────────────────────
RISK MANAGEMENT
Show SL / TP
Shows or hides Entry, Stop Loss, and Take Profit levels.
Show SL/TP Zones
Shows or hides the colored risk and target zones.
Show SL/TP Labels
Shows or hides the Entry, SL, TP1, TP2, and TP3 labels.
SL ATR x
Controls the ATR multiplier used to calculate the Stop Loss distance.
TP1 ATR x
Controls the ATR multiplier used to calculate the first Take Profit level.
TP2 ATR x
Controls the ATR multiplier used to calculate the second Take Profit level.
TP3 ATR x
Controls the ATR multiplier used to calculate the third Take Profit level.
Enable TP3
Shows or hides the third Take Profit level.
RM Label Offset Bars
Moves the risk management labels slightly to the right of the current price area. The labels and zones update automatically as new candles appear.
────────────────────────────
DASHBOARD
Show Dashboard
Shows or hides the dashboard panel.
Position
Moves the dashboard to the selected chart corner.
High Contrast Panel
Makes the dashboard easier to read with stronger background contrast.
────────────────────────────
VISUAL ELEMENTS
────────────────────────────
The indicator can display:
- Bollinger Bands
- Bollinger glow effect
- Heat zone between bands
- Keltner Channels
- Squeeze dots
- Squeeze release dots
- BUY and SELL labels
- Weak breakout labels
- Head fake labels
- Band walk markers
- ATR-based Entry, SL, TP1, TP2, TP3 levels
- Colored risk and target zones
- A dashboard with market state information
────────────────────────────
IMPORTANT NOTES
────────────────────────────
This script is an indicator, not a strategy.
It does not place trades.
It does not guarantee profitable results.
It does not predict the future.
Signals can fail in ranging, low-liquidity, high-spread, or news-driven market conditions.
Users should test the indicator on their own symbols, timeframes, and trading style before using it in live market decisions.
Risk management remains the responsibility of the user. 指标

ORB + Fib Breakout Signals (Strategy)ORB + Fib Breakout Signals (Strategy)
An opening-range breakout (ORB) strategy combined with Fibonacci levels and a
defined risk model. It marks the session's opening range, goes long on a break
above the range high and short below the range low, then manages the trade with
an ATR-based stop, an R-multiple target, and an optional breakeven move.
How it works
- Opening range — builds the high/low of the first 15/30/60 minutes of your
chosen session (timezone configurable).
- Entry — long on a close (or wick) above the ORB high, short below the ORB low;
one signal per direction per day by default.
- Fib levels — plots the standard retracements (.236–.786) inside the range plus
the 1.272 / 1.618 extensions as reference targets.
- Risk model — stop by ATR (default), Fib 0.5, opposite side of the range, or
fixed ticks; target as a multiple of risk (default 2R); optional move to
breakeven after 1R.
- Optional filters — a higher-timeframe EMA trend filter and a scale-out that
books half at 1R and lets the remainder run.
- Daily guards — max entries per day, daily loss limit, optional daily profit
lock, and flat-at-session-close, for prop-style risk rules.
Inputs are grouped (Opening Range, Signals, Fibonacci, Trend Filter, Risk Model,
Daily Guards) so you can adapt it to any index future or timeframe.
Notes
- Commission and slippage are included in the defaults — set them in Properties
to match your broker before drawing conclusions.
- Performance varies with symbol, timeframe, and settings. Test on your own data
and forward-test on a simulator before trading it live.
- This is an educational tool, not financial advice. Past backtest results do
not guarantee future performance. 策略

Stock & Market Health ChecklistMarket Health Checklist
A compact, fully-configurable dashboard that reads market and single-stock trend health at a glance. Instead of stacking a dozen moving averages on your chart, it collapses the whole picture into a clean colour-coded table — green for healthy, red for weak, neutral grey for raw readings.
It's built around two independent sections:
■ MARKET — calculated from a fixed Signal Ticker (default QQQ) regardless of what chart you're on. This is your top-down regime read: is the broad tape healthy right now?
■ STOCK — calculated from whatever symbol you're currently viewing. Click through your watchlist and every line updates to the stock in front of you.
What it tracks
MARKET section:
Up to 4 MA crossover signals (e.g. 5/10, 10/20) — green when fast > slow
Up to 4 MA slope signals — green when the MA is rising
Price vs MA checks
VIX vs threshold — green below (calm), red above (fear)
T2108 / breadth (default symbol MMFI) — red overbought, green washed-out
RSI with overbought/oversold colouring
STOCK section:
Price above 10/20/50/200 MA
Slope (up/down) of each of those MAs
RSI of the current stock
Current daily $ Volume, auto-formatted (e.g. $1.24B / $45.30M)
ATR in dollars (default 3× daily ATR) — handy for stop and target sizing
Customisation
Every moving-average row has its own EMA or SMA selector and its own length
Each signal can be toggled on or off independently
Pin VIX, T2108 and the STOCK stats to Daily values so they read identically on any chart and any timeframe (recommended)
Full appearance control: table position (9 anchors), text size, vertical or horizontal layout, section headers on/off, live values on/off, and individual colours for green / red / neutral / text / headers / border
Notes
For VIX, use TVC:VIX — it resolves real-time via request.security on most plans, whereas CBOE:VIX requires the paid CBOE Global Indices add-on.
Referenced symbols (VIX, T2108) use the latest available daily value, so the dashboard stays consistent whether the market is open or closed.
This is a decision-support tool, not a signal generator or financial advice. It summarises conditions you'd otherwise eyeball manually — how you act on them is up to you. 指标

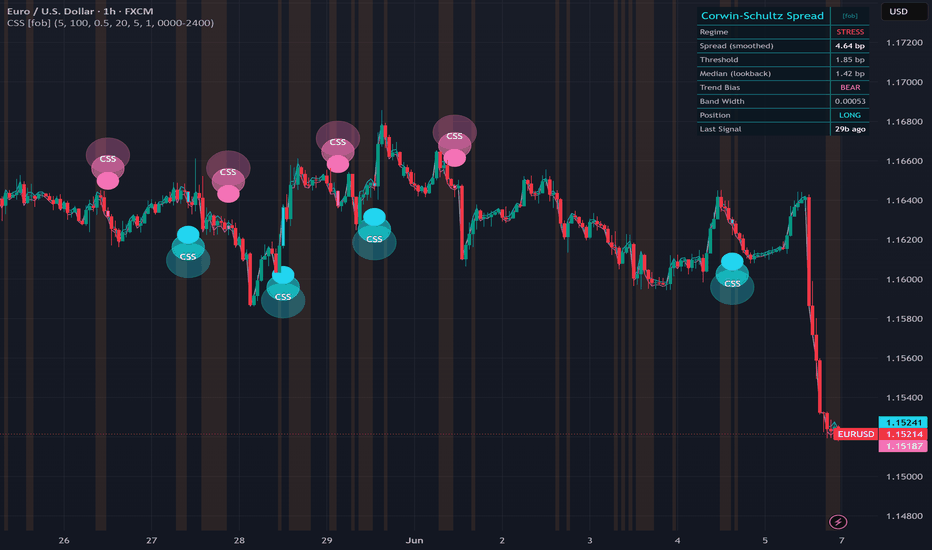
Corwin-Schultz Spread Bands [forexobroker]Corwin-Schultz Spread Bands estimates the effective bid-ask spread directly from daily high-low data using the Corwin-Schultz (2012) two-bar estimator, then turns the rolling spread into a stress regime and a pair of price bands. The unique angle is using a peer-reviewed microstructure spread formula intended for daily data on any timeframe to flag liquidity stress on the chart and time entries when stress fades into a directional trend.
🔶 ALGORITHM
1. For each pair of adjacent bars compute beta = (ln(H_t / L_t))^2 + (ln(H_{t-1} / L_{t-1}))^2 and gamma = (ln(max(H_t, H_{t-1}) / min(L_t, L_{t-1})))^2.
2. Compute alpha = (sqrt(2 x beta) - sqrt(beta)) / (3 - 2 x sqrt(2)) - sqrt(gamma / (3 - 2 x sqrt(2))).
3. Raw spread = 2 x (exp(alpha) - 1) / (1 + exp(alpha)). Clamp to the range.
4. Smooth with EMA (default 5) to produce a stable percentage spread.
5. Rolling regime stats: 100-bar (default) median and stdev of the smoothed spread; threshold = median + k x stdev (default k = 1.0).
6. In-stress = smoothed spread above threshold. Exiting stress = was above on the prior bar and below now.
7. Trend filter: close versus 20-SMA (default).
8. Visual bands: close +/- (spread / 2) x close x mult.
🔶 SIGNAL LOGIC
- Buy: spread regime just exited stress AND close > trend SMA AND session filter passes AND posState was not long AND cooldown elapsed AND barstate.isconfirmed.
- Sell: spread regime just exited stress AND close < trend SMA AND session filter passes AND posState was not short AND cooldown elapsed AND barstate.isconfirmed.
A flip-prevention posState plus cooldown bars (default 15) avoid stacking signals inside a single regime transition.
🔶 INPUTS
- Spread Estimator: smoothing EMA default 5, regime lookback default 100, stdev multiplier default 1.0.
- Signal Logic: trend SMA length default 20, cooldown bars default 15.
- Filters: optional session window default 0000-2400.
- Visual: spread band multiplier default 1.0, glow, fill, bands, stress bgcolor, neon palette, dashboard.
🔶 ALERTS
CSS Buy, CSS Sell, CSS Any Signal, CSS Enter Stress, CSS Exit Stress, CSS Spread Rising, CSS Spread Falling, CSS Trend Up, CSS Trend Down, CSS Extreme Spread, CSS Webhook JSON.
🔶 LIMITATIONS
- The estimator was designed for daily bars; on very low timeframes the high-low range gets dominated by tick noise and the spread value is noisier than the daily case.
- Spread is computed in price-fraction terms; reporting in basis points assumes that interpretation is meaningful for the instrument.
- The regime threshold depends on a 100-bar lookback, so on fresh history the threshold is unstable until the buffer is full.
- Signals require the regime to flip, so during long sideways regimes with no stress event the indicator can sit idle for many bars.
- The 20-SMA trend filter is intentionally simple and will misclassify direction during tight ranges.
指标
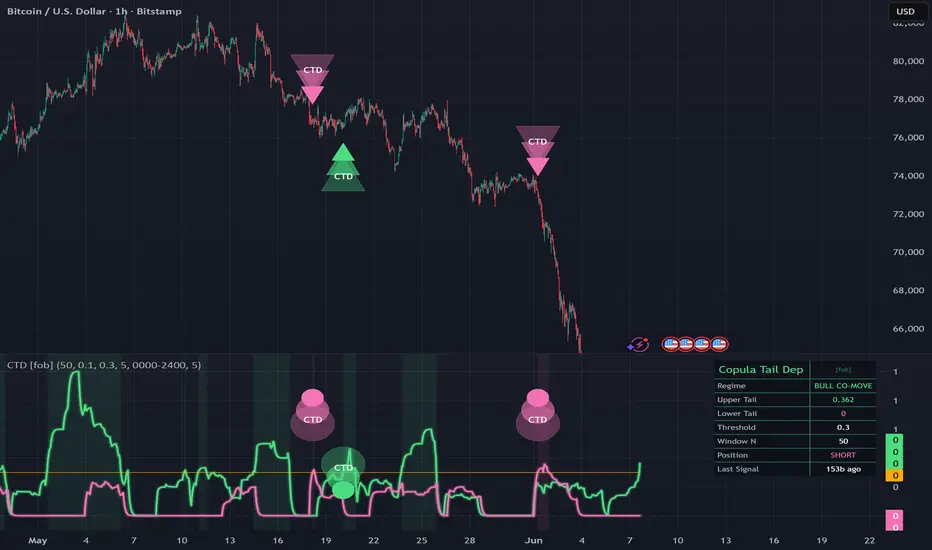
Copula Tail Dependency [forexobroker]Copula Tail Dependency estimates the empirical lower- and upper-tail dependence between price returns and volume changes using a rank-based copula. Rather than measuring linear correlation (which collapses to a single number and ignores tail behavior), the indicator measures whether extreme co-occurrences are abnormally frequent. The unique angle is that crossovers of the upper- or lower-tail measure above a threshold mark genuine joint-extreme regimes where return-volume co-movement is strong, while ordinary days leave both measures low.
🔶 ALGORITHM
1. Each bar's one-step log return and volume change are computed.
2. Both series are rank-transformed within the last N (default 50) bars; the rank divided by N produces a uniform marginal U for returns and V for volume changes.
3. The empirical lower-tail dependence is lambda_L = count(U <= u AND V <= u) / count(V <= u) for u equal to the tail fraction (default 0.1).
4. The empirical upper-tail dependence is lambda_U = count(U >= 1-u AND V >= 1-u) / count(V >= 1-u).
5. Both quantities live on ; values near 0 indicate independence at the tails, values near 1 indicate strong joint-extreme behavior.
6. A signal threshold (default 0.5) defines the line above which the tail measure is treated as a co-movement regime.
7. Bullish signal: lambda_U crosses above the threshold. Bearish signal: lambda_L crosses above the threshold.
🔶 SIGNAL LOGIC
- Buy: lambda_U crosses above the threshold AND session filter passes AND position is not already long AND cooldown bars elapsed AND barstate.isconfirmed.
- Sell: lambda_L crosses above the threshold AND session filter passes AND position is not already short AND cooldown bars elapsed AND barstate.isconfirmed.
The cross-up trigger filters out sustained-tail regimes that have already been priced in; entries fire only when joint-tail strength is freshly established.
🔶 INPUTS
- Calculation group: Window N (default 50), Tail Fraction u (default 0.1), Signal Threshold (default 0.5).
- Signal Logic group: cooldown bars (default 15).
- Filters group: optional session restriction (default 0000-2400).
- Visual group: dashboard toggle, 3-layer glow toggle, upper-tail and lower-tail colors, dashboard background.
🔶 ALERTS
CTD Buy, CTD Sell, CTD Any Signal, CTD Upper Tail Up, CTD Lower Tail Up, CTD Upper Tail Dn, CTD Lower Tail Dn, CTD Symmetric Tails, CTD Webhook JSON.
🔶 LIMITATIONS
- Volume is required, so on symbols without exchange volume the lower/upper tail estimates degrade to noise.
- The rank transform uses a fixed look-back, so the marginal CDF is local rather than global; very long-trend regimes can suppress tail measures.
- With N = 50 and u = 0.1, the upper and lower tails each contain only 5 reference points; small sample noise is expected.
- The indicator measures co-movement direction, not magnitude; it does not size the move.
- A high lambda_U can persist during slow grinding uptrends and then mean-revert, so re-entries from cool to hot are the cleanest signals.
指标

指标

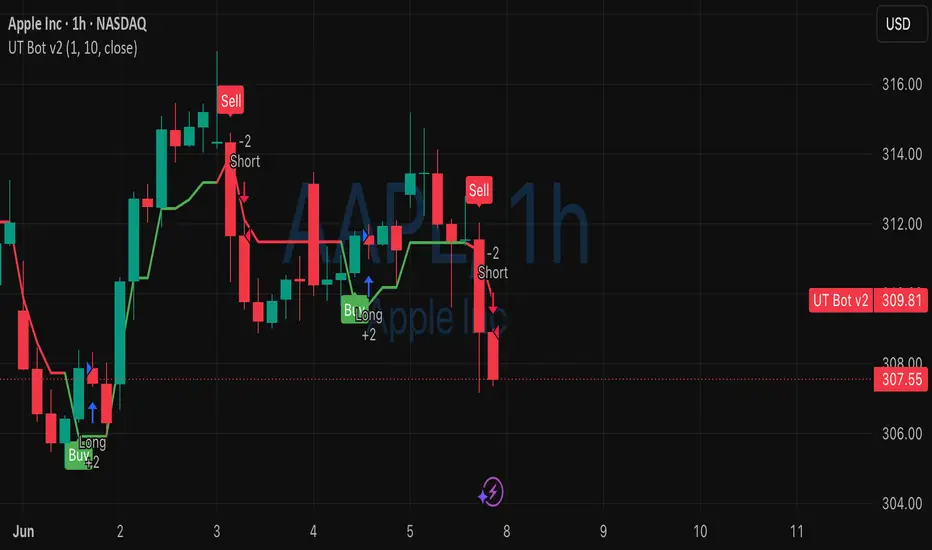
UT Bot v2 - ATR Trailing StopIf you're familiar with the original UT Bot: the core logic is the same. This version focuses on cleaner visuals, improved code quality, better customization, built-in alerts, and integrated strategy support, while preserving the underlying ATR trailing stop methodology.
UT Bot v2 is a modernized implementation of the original UT Bot, built around the same ATR-based trailing stop logic that made the original popular.
The indicator uses an adaptive trailing stop based on the Average True Range (ATR). When price crosses the stop level, the trend state flips and a new trailing stop begins to form in the opposite direction.
Rather than changing the algorithm, this release focuses on making it clearer, easier to configure, and more practical for everyday use.
Features
Classic ATR trailing stop logic
Clean and intuitive trend visualization
Buy and sell signal markers
Configurable ATR period and multiplier
Customizable price source
Built-in TradingView alerts
Integrated strategy for backtesting
Lightweight and easy to understand
Methodology
UT Bot v2 is not a predictive indicator. It does not attempt to forecast future price movements or identify exact market tops and bottoms.
Instead, it is a trend-following and risk management tool that dynamically adjusts its trailing stop using market volatility measured by ATR.
Like most trend-following systems, it tends to perform best during sustained directional moves and may generate whipsaws during ranging or low-volatility conditions.
Philosophy
The goal of UT Bot has always been to provide a simple, transparent, and systematic trailing stop framework, rather than a "holy grail" trading system.
This version preserves that philosophy while improving readability, customization, visualization, and integration with TradingView alerts and strategy testing. 策略

Gap Fill TrackerGap Fill Tracker
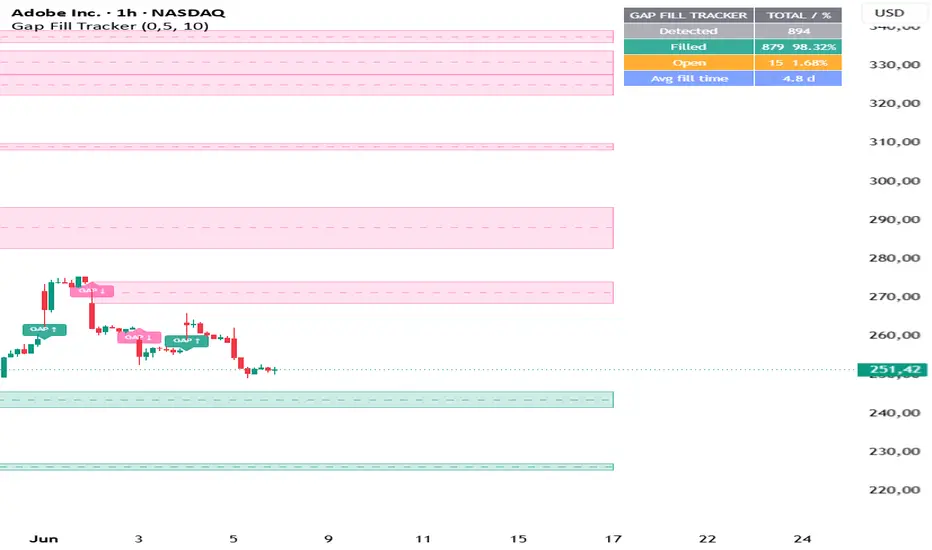
The Gap Fill Tracker is an overlay indicator that automatically detects, tracks, and measures the fill rate of price gaps — defined as the difference between the previous candle's close and the current candle's open. It counts a gap as filled when price reaches the 50% midpoint of the gap range, and provides a live statistics panel including total gaps detected, fill rate percentage, open gaps, and the average time gaps take to fill expressed in human-readable time units adapted to the current chart timeframe.
━━━━━━━━━━━━━━━━━━━━━━━━━━━━━━━━━━━━━━━━
WHAT IS A GAP?
━━━━━━━━━━━━━━━━━━━━━━━━━━━━━━━━━━━━━━━━
A gap occurs when a candle opens at a different price than the previous candle's close, leaving an unfilled zone on the chart. Bullish gaps open above the prior close. Bearish gaps open below the prior close. Gaps can occur on any timeframe and any instrument, and they represent price imbalances — zones where no trading occurred, which the market tends to revisit.
━━━━━━━━━━━━━━━━━━━━━━━━━━━━━━━━━━━━━━━━
FILL CONDITION
━━━━━━━━━━━━━━━━━━━━━━━━━━━━━━━━━━━━━━━━
A gap is considered filled when price touches the 50% midpoint of the gap range — not necessarily the full extent. This is a more conservative and statistically accurate measure than requiring a full gap fill, as it captures the point at which the market has revisited the center of the imbalance. The midpoint is marked on the chart as a dashed line through the middle of each open gap zone.
━━━━━━━━━━━━━━━━━━━━━━━━━━━━━━━━━━━━━━━━
COMPONENTS
━━━━━━━━━━━━━━━━━━━━━━━━━━━━━━━━━━━━━━━━
1. Gap Zones (boxes)
Each detected gap is visualized as a colored rectangle spanning from the gap's lower boundary to its upper boundary, starting at the bar where the gap occurred and extending to the right. Bullish gaps are displayed in teal. Bearish gaps are displayed in pink. Zones disappear silently when the fill condition is met — no confirmation markers are left on the chart, keeping it clean.
2. Midpoint Line (dashed)
A dashed horizontal line runs through the center of each open gap zone, marking the exact price level that constitutes a fill. This is the target level the indicator monitors.
3. Gap Labels
Small labels mark the bar where each gap was detected, indicating direction (GAP ↑ for bullish, GAP ↓ for bearish).
4. Statistics Table (top right)
A compact panel displays four key metrics updated in real time:
- Detected: total number of gaps found in the chart's history
- Filled: number of gaps that reached the 50% midpoint, with fill rate percentage
- Open: number of gaps still unfilled, with open rate percentage
- Avg fill time: average time gaps take to reach the 50% midpoint, expressed automatically in minutes, hours, days, or weeks depending on the chart timeframe
━━━━━━━━━━━━━━━━━━━━━━━━━━━━━━━━━━━━━━━━
SETTINGS
━━━━━━━━━━━━━━━━━━━━━━━━━━━━━━━━━━━━━━━━
• Minimum gap (%): The minimum size of a gap expressed as a percentage of the prior close, to filter out micro-gaps caused by spread or rounding. Default is 0.5%. Lower values detect more gaps; higher values focus only on significant gaps.
• Max open gaps visible: Controls how many of the most recent unfilled gaps are displayed on the chart. Older open gaps continue to count in the statistics but are hidden visually to keep the chart readable. Default is 10.
• Show open zones: Toggle the visual display of open gap zones on or off. Statistics continue to update regardless.
• Bull/Bear gap colors: Customize the colors for bullish and bearish gap zones independently.
━━━━━━━━━━━━━━━━━━━━━━━━━━━━━━━━━━━━━━━━
HOW TO INTERPRET IT
━━━━━━━━━━━━━━━━━━━━━━━━━━━━━━━━━━━━━━━━
FILL RATE
The fill rate shown in the statistics panel tells you what percentage of historical gaps on this instrument and timeframe have been filled. A fill rate above 95% confirms that gap fills are a near-certain statistical event for this market. A lower fill rate suggests that the instrument or timeframe has structural tendencies that prevent consistent gap fills — for example, strongly trending markets on higher timeframes.
OPEN GAPS
Each visible zone on the chart represents an active price target — a level where the market has a strong statistical tendency to return. The more open gaps accumulated above or below current price, the stronger the magnetic pull toward those levels.
MIDPOINT LINE
The dashed line through each zone is the exact fill target. Price touching this level — even with a wick — constitutes a fill and removes the zone from the chart.
AVERAGE FILL TIME
This is the most operationally useful metric. It tells you how long gaps on this instrument and timeframe typically take to fill, expressed in real time units. If the average fill time on a 4-hour chart is 1.1 weeks, that means most gaps are filled within approximately 1 to 2 weeks of forming. This information can be used to time entries — rather than entering immediately after a gap forms, waiting until price approaches the average fill window increases the probability of catching the fill move at the right moment.
━━━━━━━━━━━━━━━━━━━━━━━━━━━━━━━━━━━━━━━━
HOW TO USE IT
━━━━━━━━━━━━━━━━━━━━━━━━━━━━━━━━━━━━━━━━
1. CHECK THE FILL RATE FIRST
Load the indicator on your instrument and timeframe of choice. Check the fill rate in the statistics panel. If it is above 95%, gap fills are a reliable statistical edge on that market. If it is significantly lower, adjust the minimum gap size or consider a different timeframe.
2. IDENTIFY OPEN GAPS AS PRICE TARGETS
The visible zones on the chart are active price targets. Open gaps above current price are upside targets. Open gaps below current price are downside targets. The midpoint line is the specific price level to watch.
3. USE THE AVERAGE FILL TIME FOR ENTRY TIMING
Note the average fill time displayed in the table. After a gap forms, use this as a reference for when to start looking for an entry toward the fill. If the average fill time is 1 week on a daily chart, the highest probability entry window is typically in the days surrounding that average, not immediately after the gap opens.
4. MANAGE THE TRADE
The target is the midpoint of the gap. Once price touches the midpoint, the zone disappears automatically. Position sizing, stop placement, and exit management are left to the trader's discretion and should be based on their own risk framework.
━━━━━━━━━━━━━━━━━━━━━━━━━━━━━━━━━━━━━━━━
NOTES
━━━━━━━━━━━━━━━━━━━━━━━━━━━━━━━━━━━━━━━━
• Works on any instrument and any timeframe. Fill rates and average fill times vary by market and timeframe — always verify the statistics panel before trading.
• The average fill time automatically adapts to the chart's timeframe: it displays in minutes on intraday charts, hours on hourly charts, days on daily charts, and weeks on weekly charts.
• Filled gaps disappear silently without leaving markers on the chart, ensuring a clean visual at all times.
• The statistics counter covers the full available chart history, not just the visible bars on screen.
• For instruments that trade 24/5 (forex) or 24/7 (crypto), the average fill time reflects calendar time based on bar count times timeframe minutes. For instruments with trading sessions (equities, futures), the actual calendar time will be longer since no bars are generated outside market hours. 指标

指标

指标

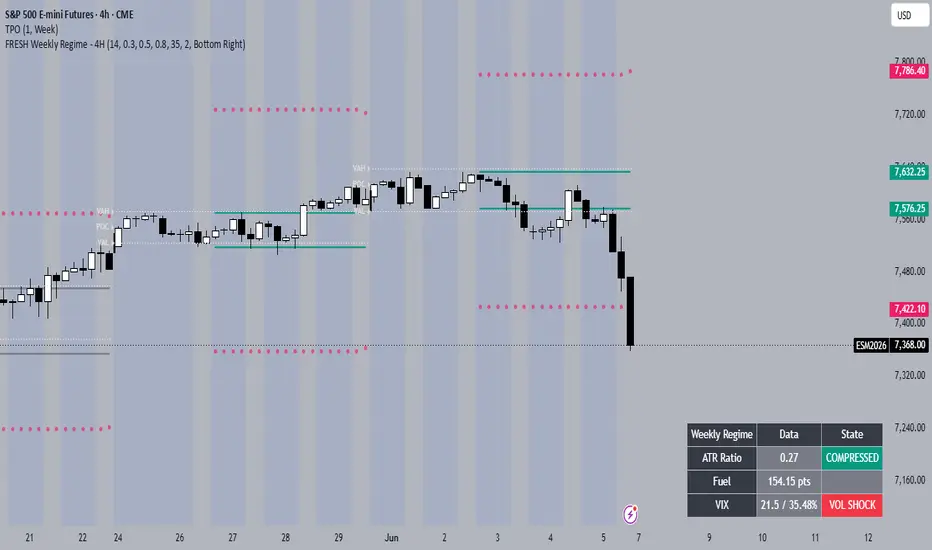
FRESH Volatility Regime & RangeFRESH Volatility Regime & Range
A single dashboard that answers two questions I ask before every session: is the market coiled or stretched right now, and where is price relative to the move the options market expects today?
Why I built it
Most range tools are static — a fixed ATR band, yesterday's range, a round-number grid. But volatility isn't static. Some sessions open compressed and need to expand; others open already stretched and tend to revert. And a "big" move on a calm day is a normal move on a high-VIX day. I kept switching between three things to read this — opening-range expansion, an ATR sense of "normal," and the VIX-implied expected move — so I combined them into one overlay with a plain-language regime read.
It does two things together:
Regime classification — it measures the realized Initial Balance (IB) range for three windows (Weekly, Daily, Pre‑NY) and compares each to ATR, bucketing the session as COMPRESSED → BALANCED → EXPANDED → STRETCHED. It also reads a VIX state (VOL CRUSH / STABLE / RISING / SHOCK) and rolls everything into a composite regime (e.g. MULTI‑TF COILED, BALANCED AUCTION, LATE EXPANSION, STRETCHED RISK).
Volatility Range — a VIX‑implied expected‑move envelope anchored at the session open: a midline plus bands at ±0.25, ±0.9, and ±1.0× the day's expected move, with the prior session's ±1x shown faintly for reference.
Plus Midnight Open and Settlement reference lines, and a summary dashboard.
What it plots
IB High/Low lines — Daily IB (09:30–10:30), Pre‑NY IB (04:00–09:30), Weekly IB (optional). The boundaries of each opening range; classic support/resistance and breakout levels. Each line is labeled.
Volatility Range bands — MID (session open) and ±0.25 / ±0.9 / ±1.0× the VIX‑implied expected move, above and below, each labeled.
Midnight Open & Settlement reference lines.
Dashboard — Weekly / Daily / Pre‑NY regime, VIX state, Volatility Range state, and the composite regime at a glance.
How to read it
Compressed / coiled → the market hasn't used its expected range; favor expansion / breakout scenarios. Stretched → it has run hot; favor mean‑reversion / exhaustion.
Volatility Range zones: Inside ±0.25 (INNER) — price near fair value; rotational / mean‑reversion bias. Between 0.25 and 1.0× (INSIDE 1x) — a normal day's travel. At / beyond ±1.0× (BEYOND 1x) price has used a full expected move; these edges often act as inflection points (reversal on quiet days, or a continuation shelf on trend days — read the context).
IB High/Low — break and hold beyond an IB edge often flips it to support/resistance in the breakout direction; rejection there is a fade.
Composite regime (dashboard) is the one‑line summary to frame everything else.
How to use it (scenarios)
Reversion: price pushes into a lower band / IB low and stalls — look for absorption or your own confirmation for a fade back toward the mid.
Breakout: price clears an IB high or the +1x band with conviction; on the retest that level can flip to support for a continuation.
Expected‑move context: in a high‑VIX session the ±1x bands sit far apart — give moves room; in a VOL‑CRUSH session they're tight — expect smaller, choppier travel.
This is a context / framing tool, not a buy‑sell signal generator. It tells you what kind of day you're likely in so your own setups are taken in the right regime.
The VIX setting
The bands are sized by the expected move: EM = sessionOpen × (VIX / 100) ÷ √252. That's the "rule of 16" — VIX is annualized implied volatility, and dividing by √252 converts it to a one‑day, one‑standard‑deviation move. At VIX 16 the ±1x band is roughly ±1% from the open; at VIX 32, ~±2%. So the envelope auto‑widens when implied vol is high and tightens when it's low — a volatility‑scaled "fair range for today," not a fixed ATR.
VIX at anchor (default) vs Use live VIX:
VIX at anchor (default) — the VIX value is sampled once, at the session‑open anchor, and frozen for the whole session. The expected move (and the bands) are computed once and stay put. This is intentional: the day's expected move is what's priced in at the open, like a settlement‑based expectation, and freezing it gives you stable, non‑repainting reference levels and a clean "how much of the expected move is used" ratio.
Use live VIX (optional) — recomputes the expected move every bar from the current VIX, so the bands drift intraday as vol changes. More "current," but the levels move around (effectively repaint), which makes them less reliable as fixed targets.
I recommend leaving it on anchor for clean levels; turn on live VIX only if you specifically want the envelope to track current volatility through the session. (Note: VIX only updates during cash hours, so if you anchor at the Globex/overnight open, the anchor value is effectively the prior cash‑session VIX; anchoring at the regular‑session open uses a fresh value.)
Inputs worth knowing
Anchor mode — Globex Open or Pit (RTH) Open for the Volatility Range midline.
VIX source — auto (live VIX symbol) or a manual value, plus the anchor/live toggle above.
IB sessions — the Daily / Pre‑NY / Weekly windows are configurable.
Display — toggle each component (IB lines, Volatility Range, Midnight/Settlement, dashboard, labels) and set the Line Label Size (Tiny → Huge).
Notes
Designed for the 30‑minute chart. I run it on 30m — the IB windows and snapshot timing are calibrated for it (the Daily‑IB read confirms on the 10:30–11:00 bar close, the RTH‑close read on the 16:00–16:30 bar close). It will draw on other timeframes, but 30m is the intended view.
Built for ES / index futures (and instruments where a VIX‑style implied‑vol input makes sense). A VIX (or equivalent) series is required for the Volatility Range.
Levels are anchored per session and reset at the session boundary.
For education / market context only — not financial advice. Test it on your instrument and timeframe before relying on it.
by oxkit (kitar.co/fresh) 指标

指标