
S&P 500 Technical Analysis for April 13th to April 17th - Weekly Outlook
Bias: Recovery / Strong Momentum Within Broader Uptrend
CMP: 6816.89 (as on 10 Apr 2026)
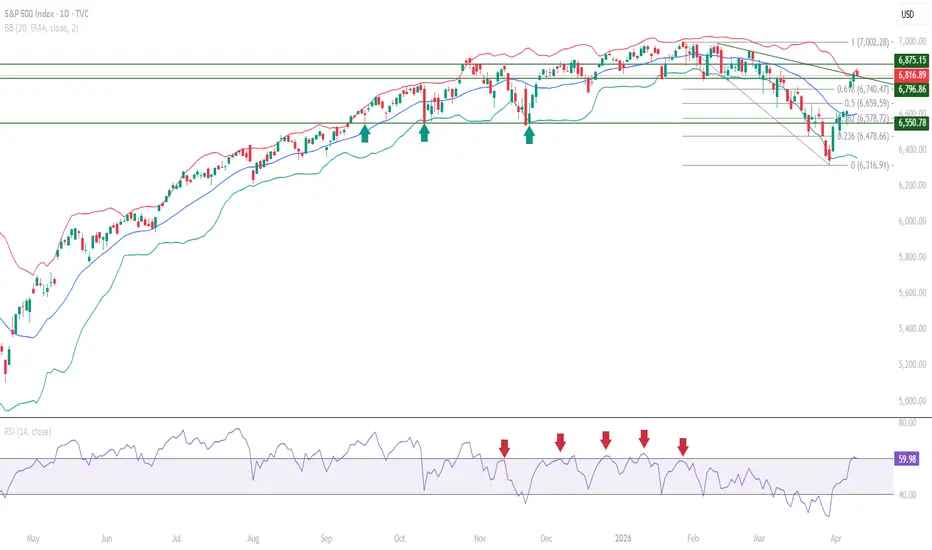
The S&P 500 has staged a sharp recovery from 6316.91 to 6845.77, reclaiming the trend channel and closing near the Mid Bollinger Band. What makes this structure notable is the confluence of the Mid Bollinger Band and a downward sloping trendline sitting just overhead, creating a decisive test zone for continuation.
What the Chart Shows
Price has recovered strongly from the lower end of the range, with buying pressure visible through accumulation behaviour near lower levels. The index is now positioned near 6840.20 immediate resistance, with the Mid Bollinger Band at 6806.74 acting as near-term support. The reclaim of the trend channel is structurally significant, suggesting the broader uptrend framework remains intact.
Indicator Signals
RSI has reclaimed the 40 level, which has historically acted as a strong momentum base on the weekly timeframe. RSI is now approaching the 60 level, and sustaining above this zone and the downward sloping trendline may support continuation of upward strength. A breakdown below 40 would signal weakening trend strength and potential downside pressure.
The Mid Bollinger Band has been marginally sustained, and this level may act as a support zone in the near term.
Fibonacci Framework
The Fibonacci retracement structure maps the recovery range clearly. The 0.236 level at 6720.96 remains the key structural support, with 6643.75 (0.382) and 6581.34 (0.5) providing deeper support context. The 0 level at 6845.77 marks the recent high and aligns closely with immediate resistance at 6840.20.
Levels to Watch
Resistance: 6840.20 (immediate), 6966.28 (major)
Support: 6806.74 (Mid Bollinger Band), 6720.96 (Fibonacci 0.236), 6643.75 (Fibonacci 0.382)
Structure and Outlook
Short-term structure reflects a strong uptrend with a possible pullback for retesting levels. Medium-term consolidation structure remains intact with accumulation visible at lower levels. The broader uptrend framework on the long-term timeframe remains intact, and any pullback, if it occurs, would be within a continuing uptrend context.
RSI approaching 60 with price sitting right at the downward sloping trendline — do you find trendline confluence with momentum thresholds to be a reliable confirmation signal, or do you wait for a weekly close above?
SPX, SP500, technicalanalysis, fibonacci, bollingerbands, RSI, trendline, marketstructure
This analysis is educational technical chart analysis provided for informational purposes only. It does not constitute investment advice or any recommendation to buy, sell, or hold any financial instrument. All analysis is based on publicly available market data and is subject to change. Users are solely responsible for their own investment and trading decisions.
Bias: Recovery / Strong Momentum Within Broader Uptrend
CMP: 6816.89 (as on 10 Apr 2026)
The S&P 500 has staged a sharp recovery from 6316.91 to 6845.77, reclaiming the trend channel and closing near the Mid Bollinger Band. What makes this structure notable is the confluence of the Mid Bollinger Band and a downward sloping trendline sitting just overhead, creating a decisive test zone for continuation.
What the Chart Shows
Price has recovered strongly from the lower end of the range, with buying pressure visible through accumulation behaviour near lower levels. The index is now positioned near 6840.20 immediate resistance, with the Mid Bollinger Band at 6806.74 acting as near-term support. The reclaim of the trend channel is structurally significant, suggesting the broader uptrend framework remains intact.
Indicator Signals
RSI has reclaimed the 40 level, which has historically acted as a strong momentum base on the weekly timeframe. RSI is now approaching the 60 level, and sustaining above this zone and the downward sloping trendline may support continuation of upward strength. A breakdown below 40 would signal weakening trend strength and potential downside pressure.
The Mid Bollinger Band has been marginally sustained, and this level may act as a support zone in the near term.
Fibonacci Framework
The Fibonacci retracement structure maps the recovery range clearly. The 0.236 level at 6720.96 remains the key structural support, with 6643.75 (0.382) and 6581.34 (0.5) providing deeper support context. The 0 level at 6845.77 marks the recent high and aligns closely with immediate resistance at 6840.20.
Levels to Watch
Resistance: 6840.20 (immediate), 6966.28 (major)
Support: 6806.74 (Mid Bollinger Band), 6720.96 (Fibonacci 0.236), 6643.75 (Fibonacci 0.382)
Structure and Outlook
Short-term structure reflects a strong uptrend with a possible pullback for retesting levels. Medium-term consolidation structure remains intact with accumulation visible at lower levels. The broader uptrend framework on the long-term timeframe remains intact, and any pullback, if it occurs, would be within a continuing uptrend context.
RSI approaching 60 with price sitting right at the downward sloping trendline — do you find trendline confluence with momentum thresholds to be a reliable confirmation signal, or do you wait for a weekly close above?
SPX, SP500, technicalanalysis, fibonacci, bollingerbands, RSI, trendline, marketstructure
This analysis is educational technical chart analysis provided for informational purposes only. It does not constitute investment advice or any recommendation to buy, sell, or hold any financial instrument. All analysis is based on publicly available market data and is subject to change. Users are solely responsible for their own investment and trading decisions.

Haftungsausschluss
Die Informationen und Veröffentlichungen sind nicht als Finanz-, Anlage-, Handels- oder andere Arten von Ratschlägen oder Empfehlungen gedacht, die von TradingView bereitgestellt oder gebilligt werden, und stellen diese nicht dar. Lesen Sie mehr in den Nutzungsbedingungen.
Haftungsausschluss
Die Informationen und Veröffentlichungen sind nicht als Finanz-, Anlage-, Handels- oder andere Arten von Ratschlägen oder Empfehlungen gedacht, die von TradingView bereitgestellt oder gebilligt werden, und stellen diese nicht dar. Lesen Sie mehr in den Nutzungsbedingungen.