
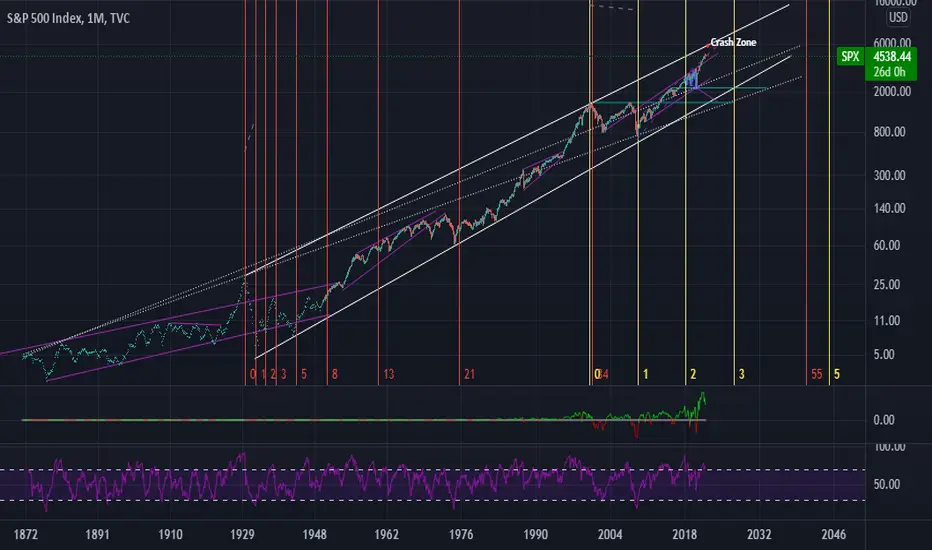
The S&P 500 is a linear instrument for making money. If we examine this index on the log scale, we derive a historical price channel that can call recessions/depressions. We are close to a huge resistance line. Zoom in for clarity!
Trade ist aktiv
Melt up to Genesis Trendline during the most extended cycle in history yet!Anmerkung
Melt-Up still in progress with price targets as described based on time (Earliest sequence: 7000 EOY).
Verbundene Veröffentlichungen
Haftungsausschluss
Die Informationen und Veröffentlichungen sind nicht als Finanz-, Anlage-, Handels- oder andere Arten von Ratschlägen oder Empfehlungen gedacht, die von TradingView bereitgestellt oder gebilligt werden, und stellen diese nicht dar. Lesen Sie mehr in den Nutzungsbedingungen.
Verbundene Veröffentlichungen
Haftungsausschluss
Die Informationen und Veröffentlichungen sind nicht als Finanz-, Anlage-, Handels- oder andere Arten von Ratschlägen oder Empfehlungen gedacht, die von TradingView bereitgestellt oder gebilligt werden, und stellen diese nicht dar. Lesen Sie mehr in den Nutzungsbedingungen.