
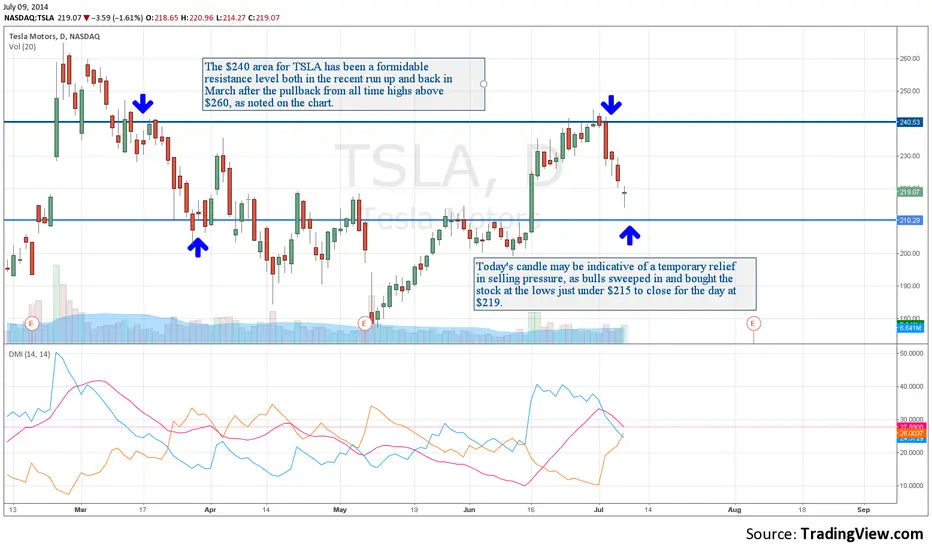
The $240 area for TSLA has been a formidable resistance level both in the recent run up as well as back in March after the pullback from all time highs above $260, as noted on the chart.
Today's candle may be indicative of a temporary relief in selling pressure, as bulls swept in and bought the stock at the lows just under $215 to close for the day at $219.
If the overall markets continue to pullback, it will be interesting to see if the stock can hold the $210 area, as this was the breakout level for June run up.
Blog post dated: 07/08/2014: syncubate.com/blog/2014/7/8/tsla-resistance-overhead
Today's candle may be indicative of a temporary relief in selling pressure, as bulls swept in and bought the stock at the lows just under $215 to close for the day at $219.
If the overall markets continue to pullback, it will be interesting to see if the stock can hold the $210 area, as this was the breakout level for June run up.
Blog post dated: 07/08/2014: syncubate.com/blog/2014/7/8/tsla-resistance-overhead

Haftungsausschluss
Die Informationen und Veröffentlichungen sind nicht als Finanz-, Anlage-, Handels- oder andere Arten von Ratschlägen oder Empfehlungen gedacht, die von TradingView bereitgestellt oder gebilligt werden, und stellen diese nicht dar. Lesen Sie mehr in den Nutzungsbedingungen.
Haftungsausschluss
Die Informationen und Veröffentlichungen sind nicht als Finanz-, Anlage-, Handels- oder andere Arten von Ratschlägen oder Empfehlungen gedacht, die von TradingView bereitgestellt oder gebilligt werden, und stellen diese nicht dar. Lesen Sie mehr in den Nutzungsbedingungen.