
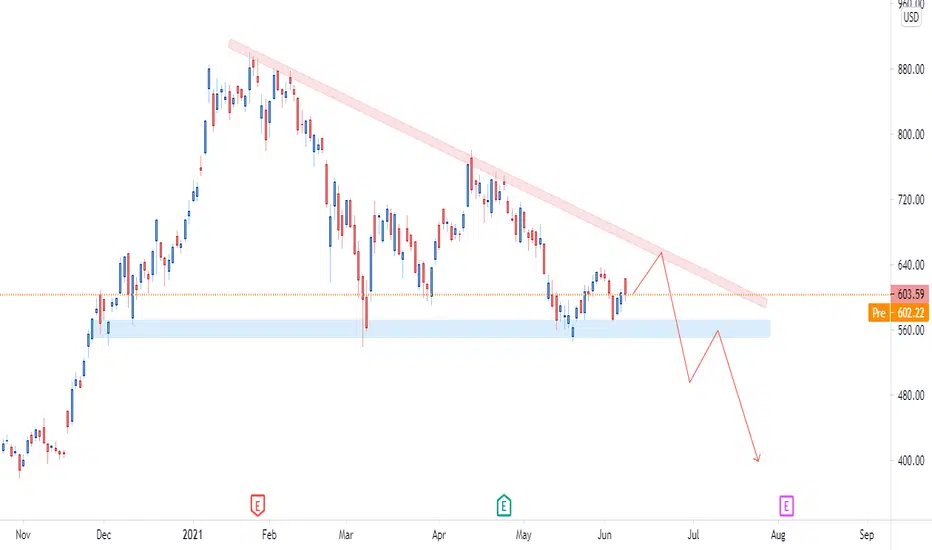
Here is our weekly outlook for Tesla stock. We can notice the descending triangle pattern right away from the first glance. The descending triangles usually indicate a bullish breakout. In our case the price is expected to hit down to 500$; however, this is most likely to be followed by a retest/correction at 550$. Overall, long-term our bias stays bullish on Tesla as they continue to open more factories; however, this doesn’t mean that we don’t monitor the market for better entries to our portfolio. If you’re looking to secure some profits and re-enter the trade a little further this is your sign to do so.

Haftungsausschluss
Die Informationen und Veröffentlichungen sind nicht als Finanz-, Anlage-, Handels- oder andere Arten von Ratschlägen oder Empfehlungen gedacht, die von TradingView bereitgestellt oder gebilligt werden, und stellen diese nicht dar. Lesen Sie mehr in den Nutzungsbedingungen.
Haftungsausschluss
Die Informationen und Veröffentlichungen sind nicht als Finanz-, Anlage-, Handels- oder andere Arten von Ratschlägen oder Empfehlungen gedacht, die von TradingView bereitgestellt oder gebilligt werden, und stellen diese nicht dar. Lesen Sie mehr in den Nutzungsbedingungen.