
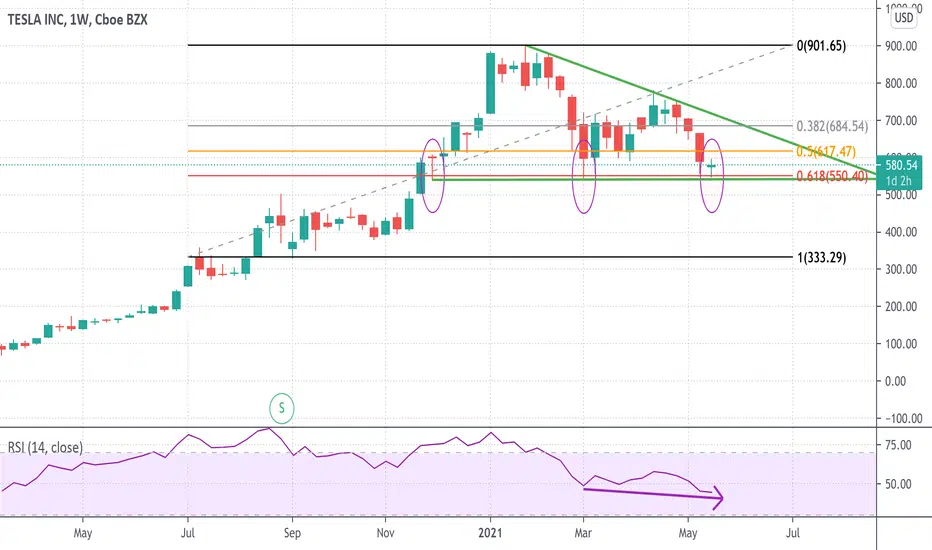
A weekly chart of TSLA will show us the longer term trend, which fate could be tested at the $550 level, which is coincidental with the 61.8% Fibonacci Retracement, a break below this level suggests the next target on the downside is $330 approximately.
There is a slight divergence with the RSI, when you take a look at the last bottom. (Bearish)
I will be keeping this on a close watch.
There is a slight divergence with the RSI, when you take a look at the last bottom. (Bearish)
I will be keeping this on a close watch.

Haftungsausschluss
Die Informationen und Veröffentlichungen sind nicht als Finanz-, Anlage-, Handels- oder andere Arten von Ratschlägen oder Empfehlungen gedacht, die von TradingView bereitgestellt oder gebilligt werden, und stellen diese nicht dar. Lesen Sie mehr in den Nutzungsbedingungen.
Haftungsausschluss
Die Informationen und Veröffentlichungen sind nicht als Finanz-, Anlage-, Handels- oder andere Arten von Ratschlägen oder Empfehlungen gedacht, die von TradingView bereitgestellt oder gebilligt werden, und stellen diese nicht dar. Lesen Sie mehr in den Nutzungsbedingungen.