
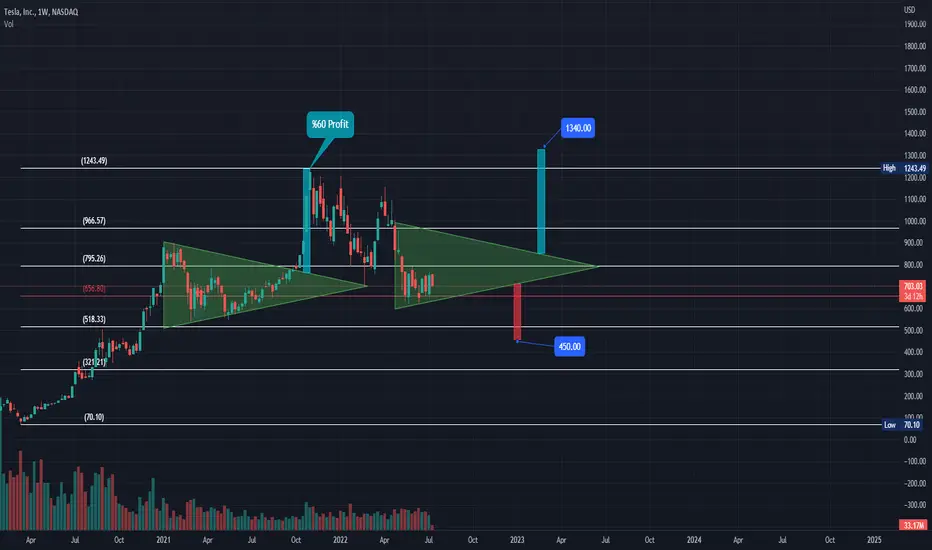
TSLA 1W Chart
-If the same triangle pattern occurs and we can see 1300-1400 in long term (Q2 2023 and later)
-As we all know recession is on the table and if FED increase rates more than expected we can find TSLA less than 500 by the end of the year.
Technical Datas
-Short term accumulation zone --> 590 - 656
-Long term Pivot --> 656 (If we see weekly candles're closed below this, we can try short, target 450)
-Support 1: 656
-Support 2: 590
-Support 3: 518
-Resistance 1: 755
-Resistance 2: 795
-Resistance 3: 966 (If we see weekly candles're closed above this level, we can expect new ATH)

TradingView Öğreniyorum bültenime ücretsiz abone olmak için: substack.com/@burakkesmeci
Haftungsausschluss
Die Informationen und Veröffentlichungen sind nicht als Finanz-, Anlage-, Handels- oder andere Arten von Ratschlägen oder Empfehlungen gedacht, die von TradingView bereitgestellt oder gebilligt werden, und stellen diese nicht dar. Lesen Sie mehr in den Nutzungsbedingungen.