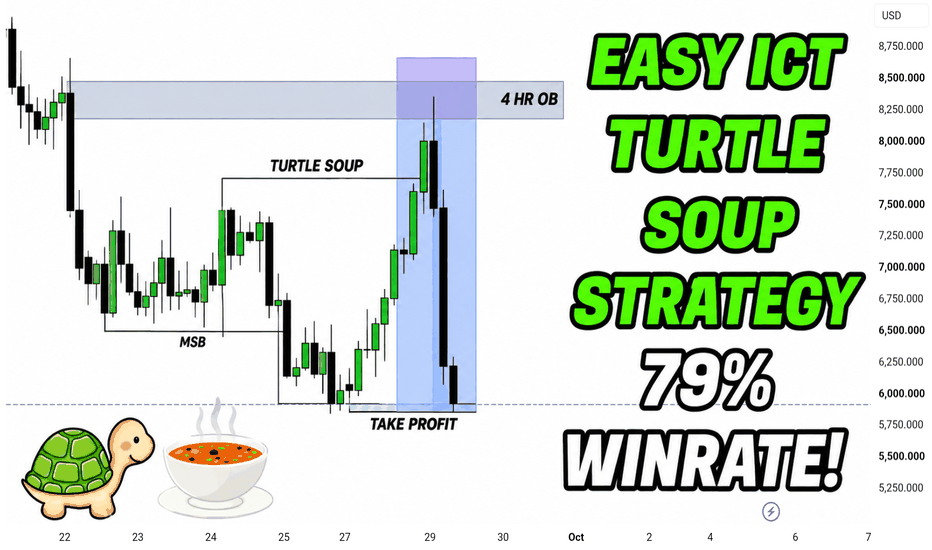
ICT TURTLE SOUP — COMPLETE CONCEPTUAL DESCRIPTION.
ICT Turtle Soup is a price-action and liquidity-based reversal concept that focuses on identifying false breakouts, liquidity sweeps, market structure shifts, and reversals from key levels. Instead of chasing a breakout when price moves above a previous high or below a previous low, the Turtle Soup concept waits for the market to first take liquidity and then show evidence that the breakout has failed.
1. Identify the Liquidity
The first step is to locate an obvious previous swing high or swi
Fibonacci
EURUSD: A False Break at 1.1200 Could Trigger a RecoveryHello everyone, here is my breakdown of the current EURUSD setup.
Market Analysis
EURUSD previously formed a Rounding Top and traded inside a wedge structure before breaking lower. Price then tested the Support Zone with a fake breakout and rebounded, showing signs of buyers stepping in.
Currently, EURUSD is trading below the 1.1290 Resistance Zone while holding above the 1.1200 Support Zone. The recent rebound from support suggests buyers may attempt another move higher.
My Scenario & Stra
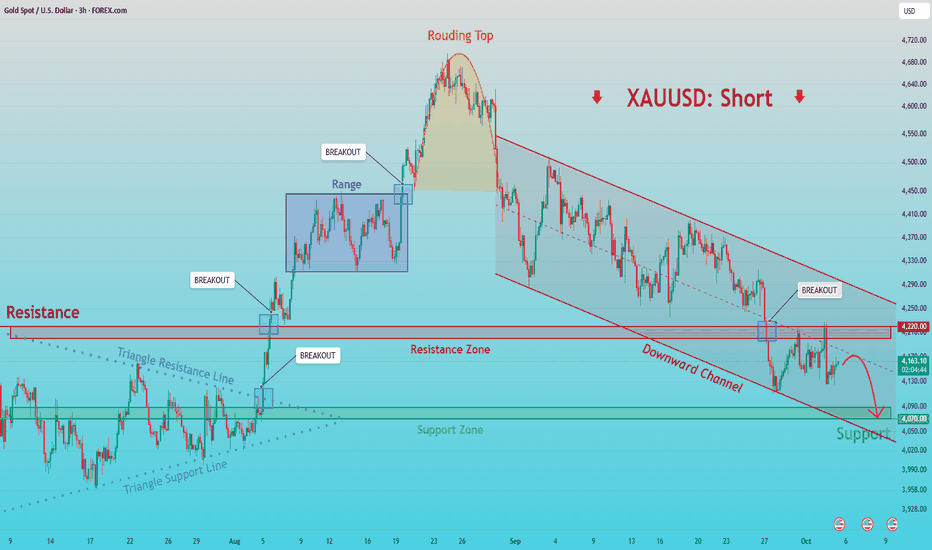
XAUUSD: Turns Lower as 4,220$ Continues to Reject PriceHello everyone, here is my breakdown of the current XAUUSD setup.
Market Analysis
XAUUSD previously formed a Rounding Top near the highs before breaking lower into a downward channel. Price then tested the Resistance Zone near 4,220 and was rejected, confirming the bearish shift.
Currently, XAUUSD is trading below the 4,220 Resistance Zone while holding above the 4,070 Support Zone. The completed Rounding Top and recent rejection suggest sellers may attempt another move lower.
My Scenario &
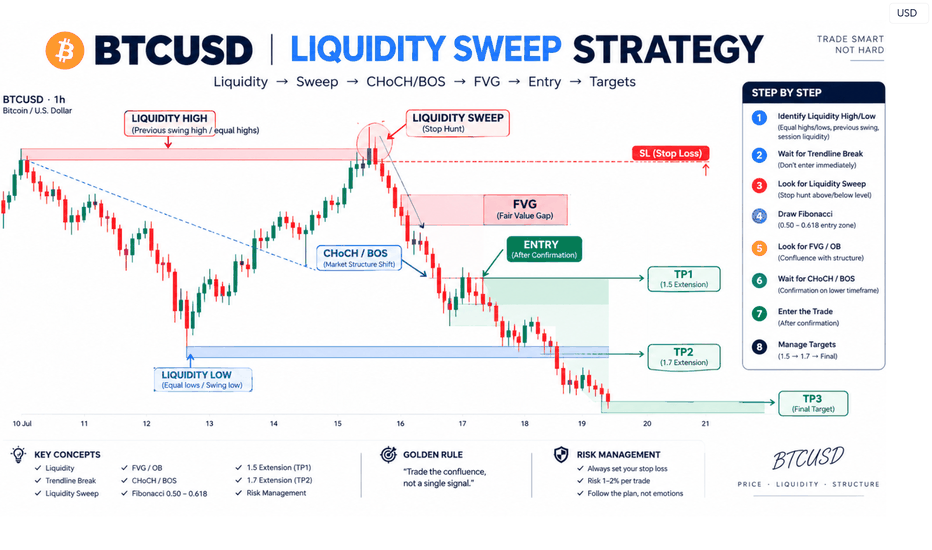
BTCUSD Liquidity & Fibonacci Expansion ModelBTCUSD Liquidity Sweep + Fibonacci SMC Strategy — Full Candle-by-Candle Explanation
This chart demonstrates how liquidity, candle behaviour, trendline structure, Fibonacci 0.50–0.618, CHoCH/BOS and FVG can be combined into one SMC execution model. The important point is that each candle gives information about the battle between buyers and sellers. One candle alone is not a trade signal; the sequence and location of candles create the setup.
1. Initial Bullish Candles — Building Buy-Side Press
XAUUSD — Bearish Wave 5 Toward 4,060
From Kelly’s view, gold has shifted into a short-term bearish structure after losing the previous rising channel. Price is currently trading around 4,160, directly below an important Wave (2) sell zone, while the latest rebound still looks corrective rather than a confirmed bullish reversal.
The key idea is simple: if sellers continue to defend the 4,160–4,180 resistance area, gold may resume the bearish Elliott Wave sequence toward 4,110 first and potentially the 4,055–4,065 Fibonacci target z
Could Bitcoin Be Primed for a Break Up?Bitcoin had an impressive Q3, adding over 40% between July and September, which was its best quarter since the back end of 2024. In doing so, it managed to shrug off the disappointment of the US Senate failing to advance a crypto regulation bill, as well as avoiding the negativity created by rising global yields, the continuation of hostilities in the Middle East and a first interest rate hike in 2026 from the Federal Reserve last month.
Looking forward, there could be reasons for traders to b
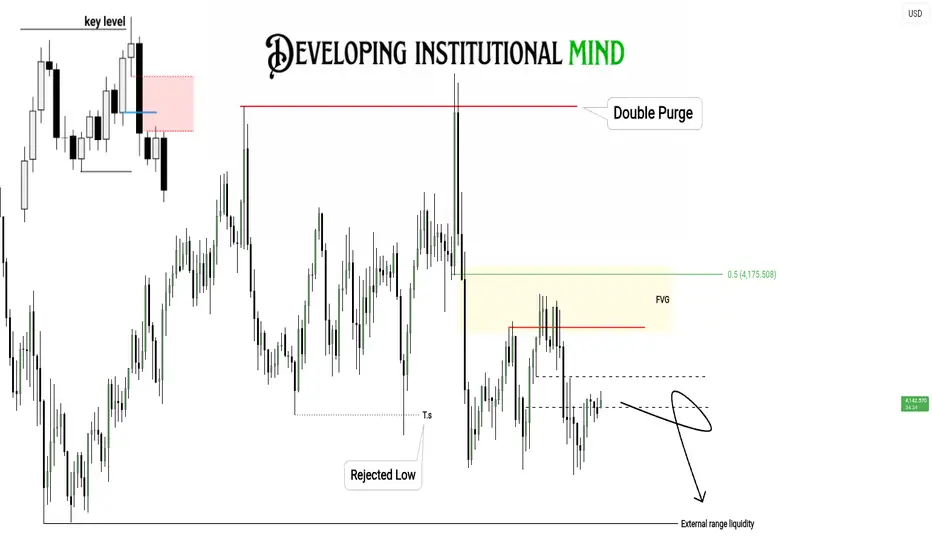
ICT TURTLE SOUP — SELL MODEL 📊 ICT TURTLE SOUP — CHART-BASED CONCEPT
This chart illustrates a liquidity-driven reversal model built around a key level, a double liquidity purge, rejection, Fair Value Gap (FVG), and a move toward external range liquidity. The objective is not to predict the market before the liquidity event, but to wait for price to reveal its intent and then participate from a high-probability area.
1. KEY LEVEL — Establish the Reference Point
The setup begins with a clearly defined key level, normally r
GBPAUD 4H - Bullish Structure Holding at Fibonacci SupportGBPAUD remains bullish on the 4-hour structure after a strong impulsive move from the major demand zone around 1.8700–1.8750. Price rallied into the 1.9100–1.9120 resistance area, establishing the latest swing high, and is now undergoing a healthy retracement.
The current pullback has brought price directly into an important confluence area. The 0.382–0.50 Fibonacci retracement zone, approximately 1.8970–1.8920, overlaps with the previous support/resistance zone highlighted on the chart. This ma
AAPL | October 5, 2026 | Time Frames, Key Levels & Trading AlertToday's AAPL review focused on using the right time frames, identifying the levels that actually matter, and creating alerts so I don't have to stare at the chart waiting for something to happen.
Once I've done my top-down analysis and marked my points of interest, the next step isn't to watch every candle.
It's to let price come to me.
In today's video, I covered:
- Using multiple time frames to build context around AAPL
- Choosing time frames that actually match my day-trading strategy
- Iden
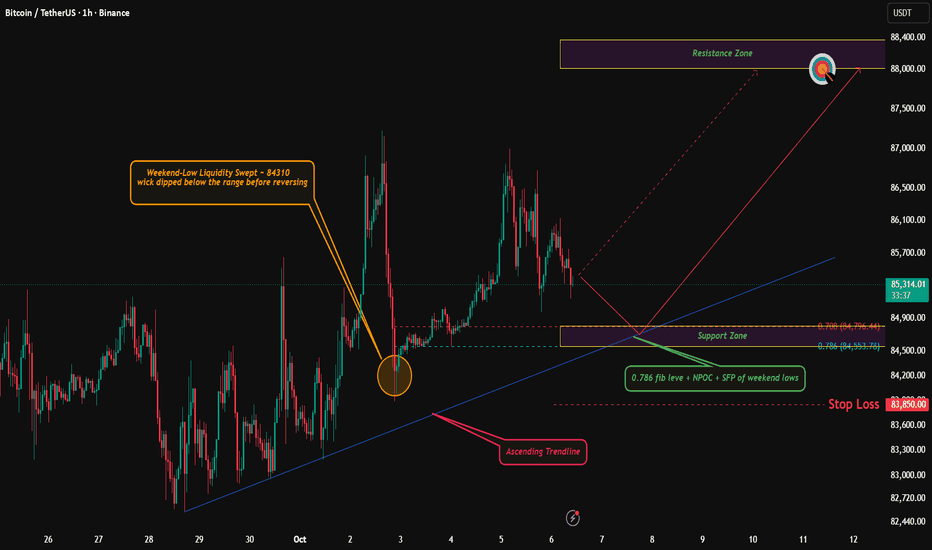
BTCUSDT: Retesting the Breakout Range, Eyeing 88,000Hook :
BINANCE:BTCUSDT broke out of a multi-day range, rallied over 2,000 points, and is now coming back to retest the exact box it broke from — right where a trendline, a 0.786 Fib, and a swept weekend low all stack up.
Market Context:
After consolidating inside 84,620–85,460 for several days, BTCUSDT broke higher and ran to 86,980 before pulling back. Price is now retesting that former range as support, with the ascending trendline arriving at almost the same level.
Reasoning:
Bre
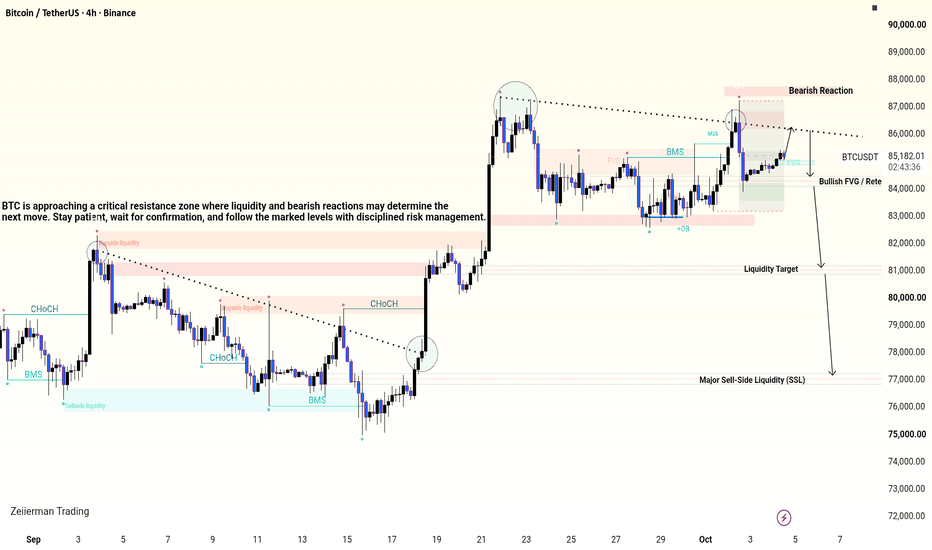
BTCUSD 4H | Liquidity Sweep MSS & Bearish Rejection — Key LevelsBTCUSD 4H — Liquidity Sweep, Market Structure Shift & Potential Bearish Expansion
Market Overview
Bitcoin is currently trading around 85,122, following a strong bullish expansion from the 75,000–77,000 demand region toward the 87,300 liquidity area.
The chart highlights an important transition from bullish expansion into consolidation and potential distribution.
After reaching the previous high, price experienced rejection and began forming lower highs beneath descending resistance. However,
AUD/USD Monthly: Three W-X-Y Structures🌊 AUD/USD: W-X-Y, W-X-Y, W-X-Y — What Comes Next?
FX_IDC:AUDUSD has developed an unusually complex long-term structure since the 2001 low at 0.47780 . Instead of viewing the entire price history as one simple impulse or one simple correction, my current monthly-wave interpretation divides the price action into three large W-X-Y structures .
1️⃣ First Structure: 2001 → 2011
🔻Wave (W): 2001 → 2008
From the 2001 low at 0.47780, AUD/USD advances toward the 2008 high near 0.98, with multipl
How to Trade Gold XAUUSD with Fibonacci Levels
Today, I will show you a simple way to trade Gold XAUUSD with Fibonacci.
You will learn how to use Fibonacci retracement levels for the identification of strong reversal zones and accurate entries.
Take notes and get a complete step-by-step strategy and trading plan.
The best time frame to use this strategy is daily .
But you can use the same rules for trading on any time frame.
Step 1
First, we should identify major price movements, as they will provide a base for fibonacci r
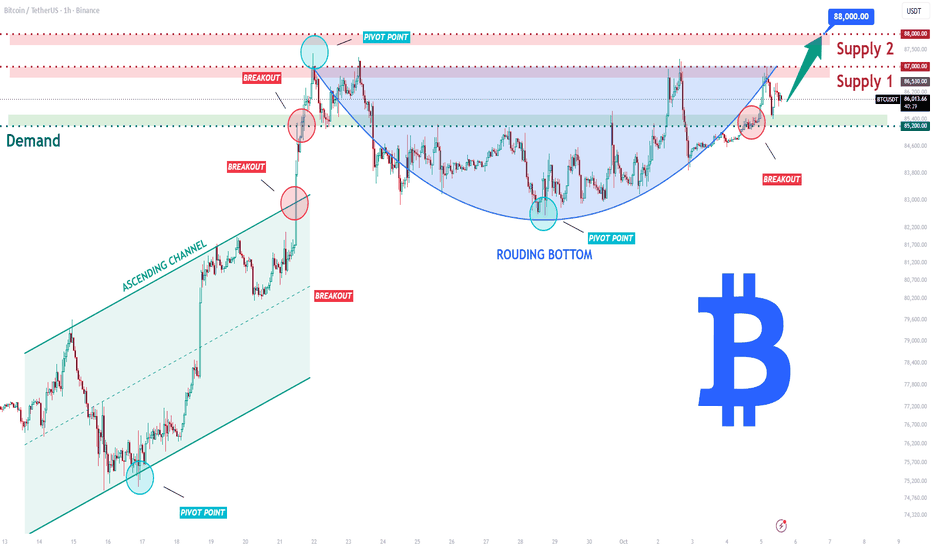
BTCUSDT Long: Builds a Bullish Base as 88K Comes Back Into FocusHello traders! Here’s my technical outlook based on the current BTCUSDT (1H) chart structure. BTCUSDT previously traded inside an ascending channel before breaking higher and later forming a Rounding Bottom near the Demand Zone. Price then bounced and is now testing higher levels.
Currently, BTCUSDT is trading below the 88,000 Supply Zone while holding above the 85,200 Demand Zone. The completed Rounding Bottom and recent bounce suggest buyers are preparing for another move higher.
As long as
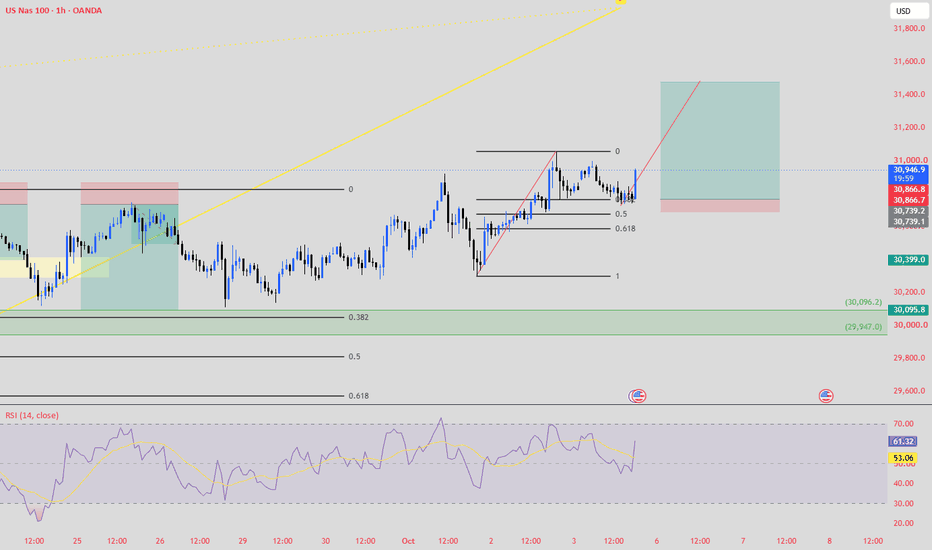
US100 — Bullish setupThe main move starts around 30,399 and rallies to approximately 31,050. I have drawn the Fibonacci retracement from that swing low to the swing high. After reaching the high, US100 corrected and moved back into the important retracement area.
The key part of the chart is the 0.50–0.618 Fibonacci zone, roughly 30,739–30,867. Price has tested this region and appears to be finding buyers. The recent candles around this area show rejection followed by a push back upward, with price currently around
GBPJPY at Fib Resistance — Bearish Move to 203.47?Hook:
FX:GBPJPY has recovered into a major Fibonacci resistance cluster, with the 0.618 and 0.786 retracement levels converging around the 209.74–210.64 area. If sellers defend this zone, the recovery could unwind toward 203.47. 🔥
Market Context:
GBPJPY is approaching a key decision area after its recent recovery. Rather than chasing the move higher, the setup is focused on a potential bearish reaction from the Fibonacci retracement zone.
The 209.74–210.64 area is the critical region to
EURUSD – Could the Sell Off be Over-Extended? EURUSD grabbed the headlines yesterday when it fell to a 17 month low at 1.1161 in early trading as rumours circulated over the weekend that the Spanish Prime Minister was going to call a snap election after parliament rejected key measures aimed at tackling the country’s housing crisis, a rumour that was confirmed later in the day.
This development added a new level of political risk to the fiscal concerns that have been building across the Eurozone, predominantly focused on France’s inabilit
XAUUSD — Gold coils into the apex: descending trendline vs. 4,12
Gold is at 4,140.53 on the 4H chart, pressed into the apex of a descending triangle that has been forming since the late-August high at 4,681.02.
The structure is clean. The descending trendline off that high has delivered a series of lower highs through September, while horizontal support at 4,121.50 — the swing low that anchors the Fibonacci range — has held every test so far. Those two lines are now within roughly 20 points of each other, which means the pattern is out of room. Compressio
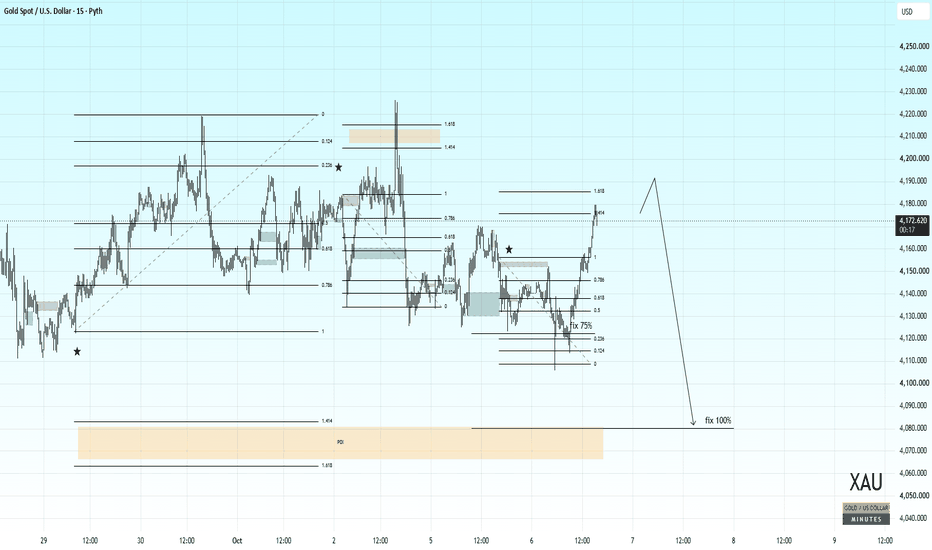
XAUUSD · M15 — Rebalancing Before a Potential Move Lower
Following the rebound from local lows, price has reached the external Fibonacci extension of 1.414–1.618 around 4175–4185. I view this recovery as a correction within the broader downward move.
My main scenario is a completion of the rebalance in this area, with a possible push toward 4190, followed by renewed selling toward the lower POI.
Profit-taking levels:
• Around 4122 — close 75% of the position.
• Around 4080 — close the remaining position near the upper boundary of the lower POI.
T
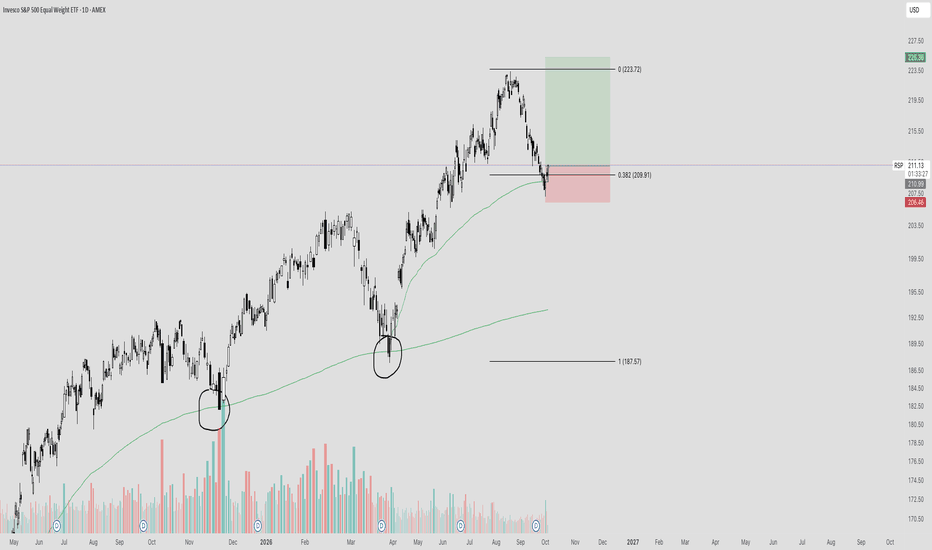
SP500 Equal Weight Index Buy Opportunity U.S. equities remain structurally strong, with the Nasdaq pushing into record territory and the S&P 500 trading near all-time highs. However, underneath the surface, market breadth has deteriorated significantly. Unlike SPY, where a handful of mega-cap technology companies can drive the entire index higher, RSP gives approximately equal weight to every S&P 500 company. This makes it a much better representation of how the average large-cap U.S. stock is actually performing.
Right now, the diver
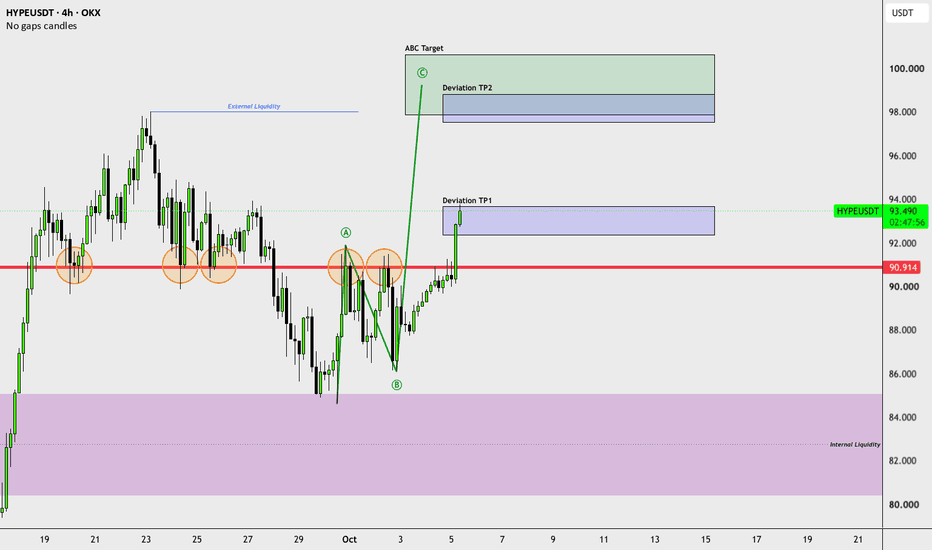
HYPEUSDT: Bullish Sequence Activation Eyes Point C ExpansionOKX:HYPEUSDT has transitioned into a confirmed bullish cycle following a clean demand reaction out of the internal liquidity basin between 80.00 and 84.00. The foundational impulse established an initial structural high at Point A, directly engaging the multi-tested horizontal pivot line at 90.914. The subsequent clearance and price acceptance above Point A validates a formal sequence activation under Stefan Kassing market geometry, unlocking the path toward higher structural targets.
The pull
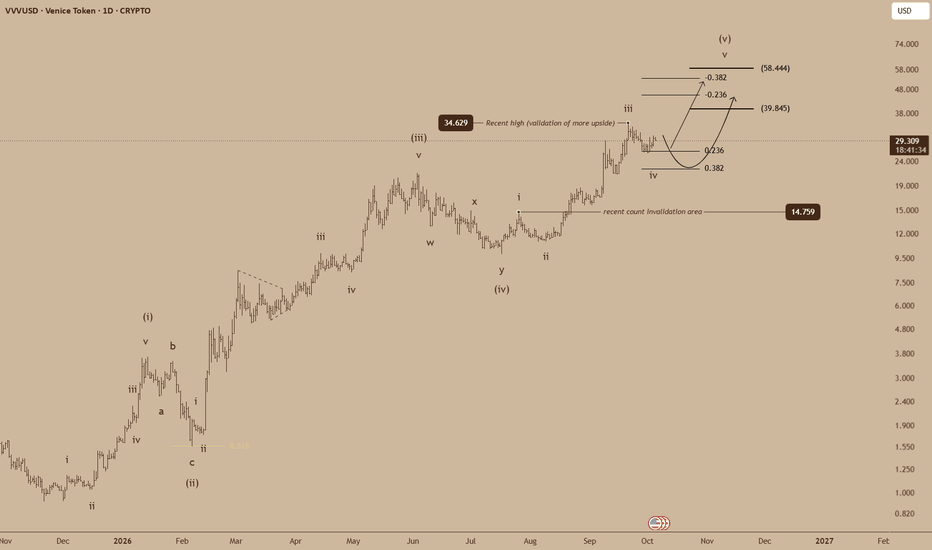
VENICE TOKEN (VVVUSD): One More Dip or Straight to $58? The current structure leaves two possibilities for Wave IV:
Scenario 1: Wave IV is already complete, and VENU begins the next impulse toward the -$0.382 target at $58.44.
Scenario 2: Wave IV needs a little more time, with price retracing toward the 0.382 area before the next advance toward the -$0.236 target at $39.85.
Rather than trying to predict exactly which of these two paths develops, the practical approach is to focus on the common destination.
The target zone
The final-wave target
Bitcoin BTC price analysis for SeptemberCRYPTOCAP:BTC is now approaching the critical $86,250 level, and this is where we need to pay very close attention.
If buyers manage to break through and hold above it, OKX:BTCUSDT gets a chance to crawl into the $91,100–93,100 zone. And altcoins may still have a few more days to keep firing by inertia. 🙂
If not, the market may enter a correction earlier than most retail traders would like.
A correction in OKX:BTCUSDT toward $72,500 could still be considered very mild. In fact, it would