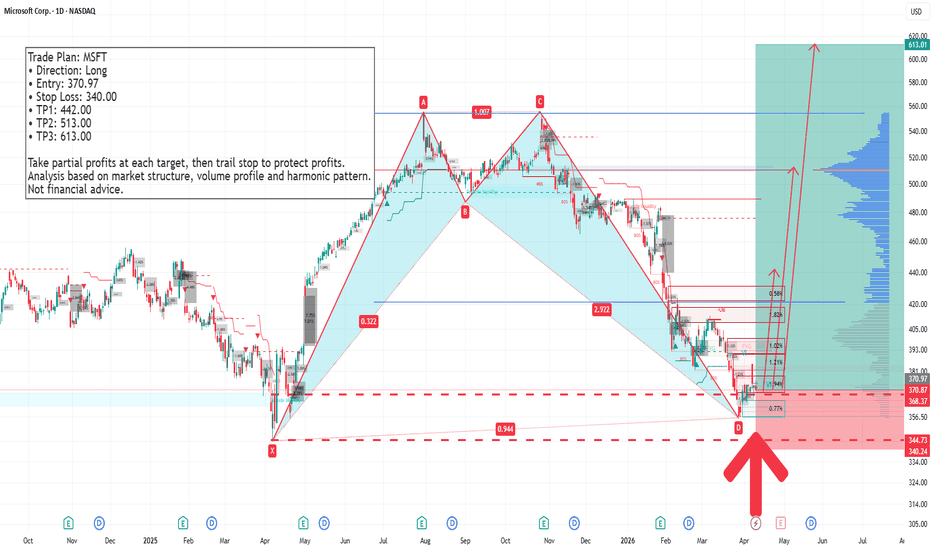
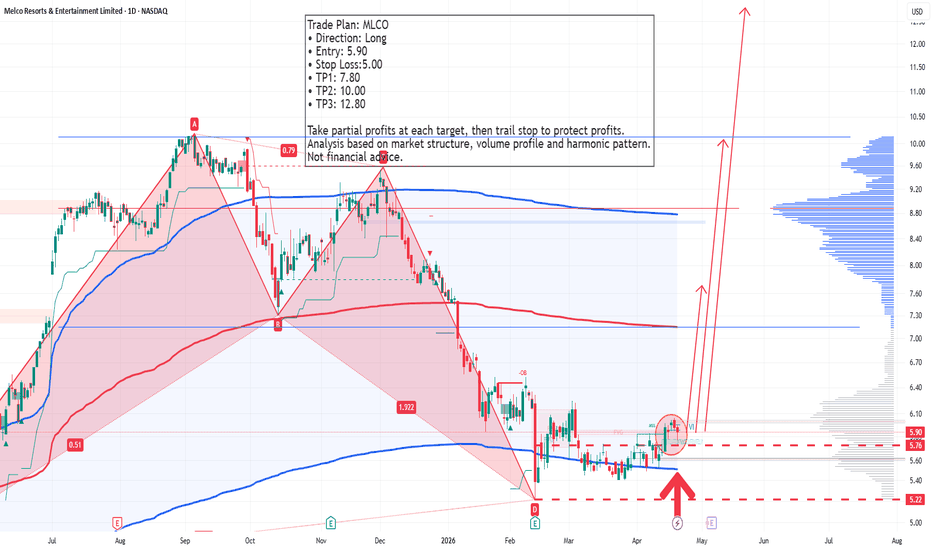
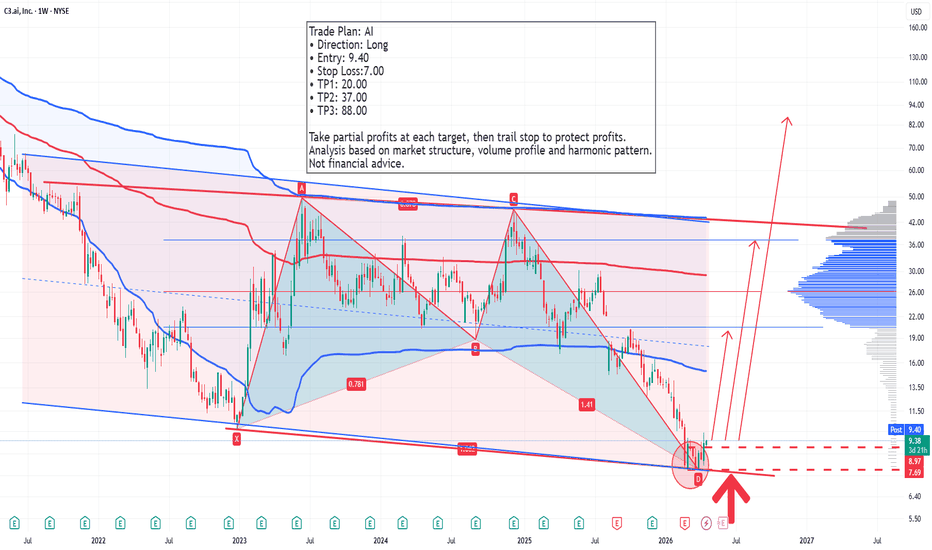
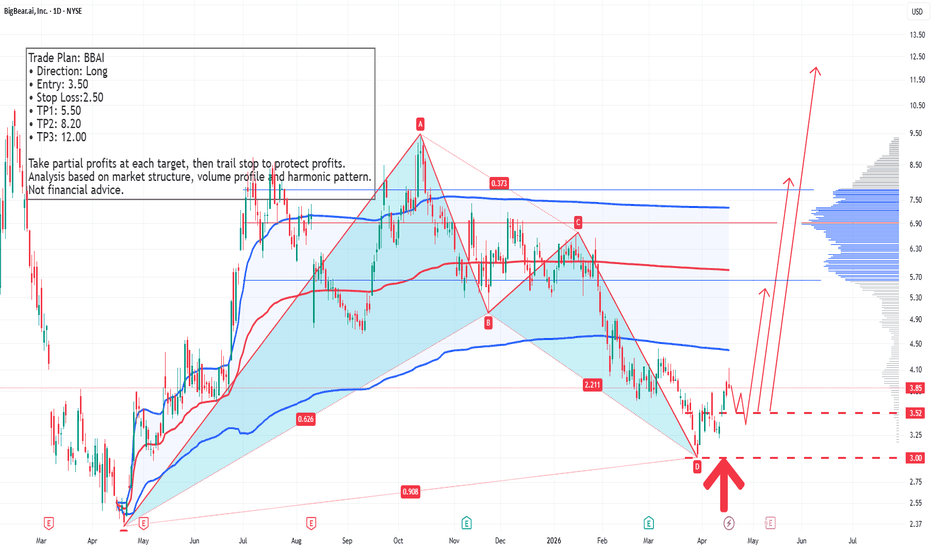
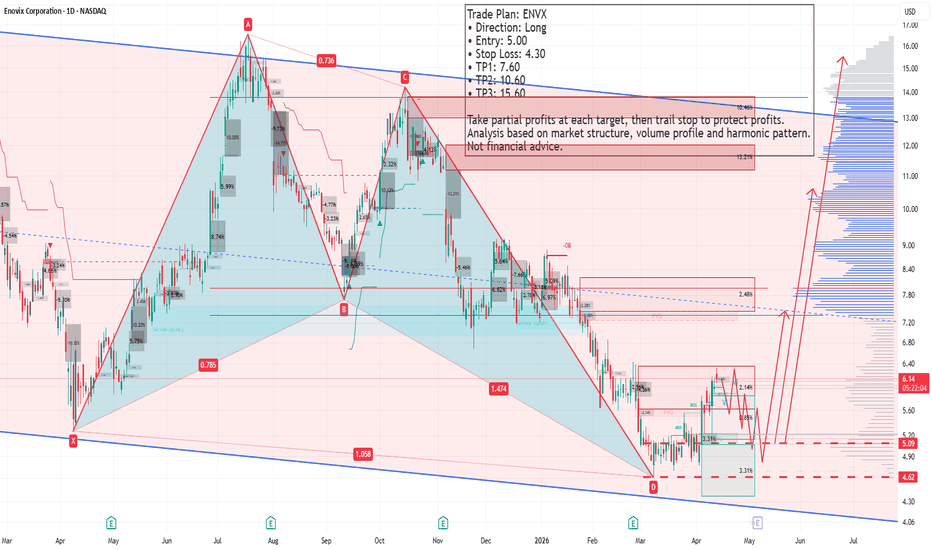
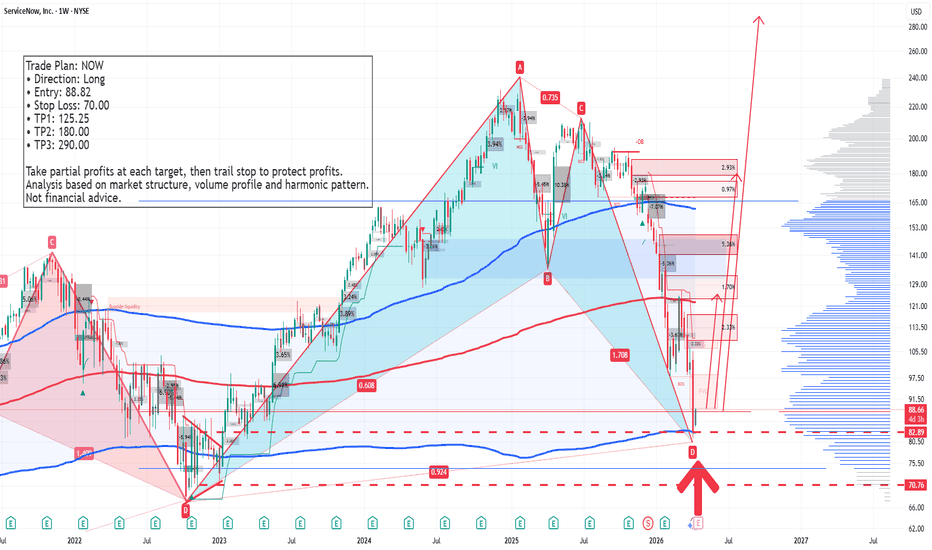
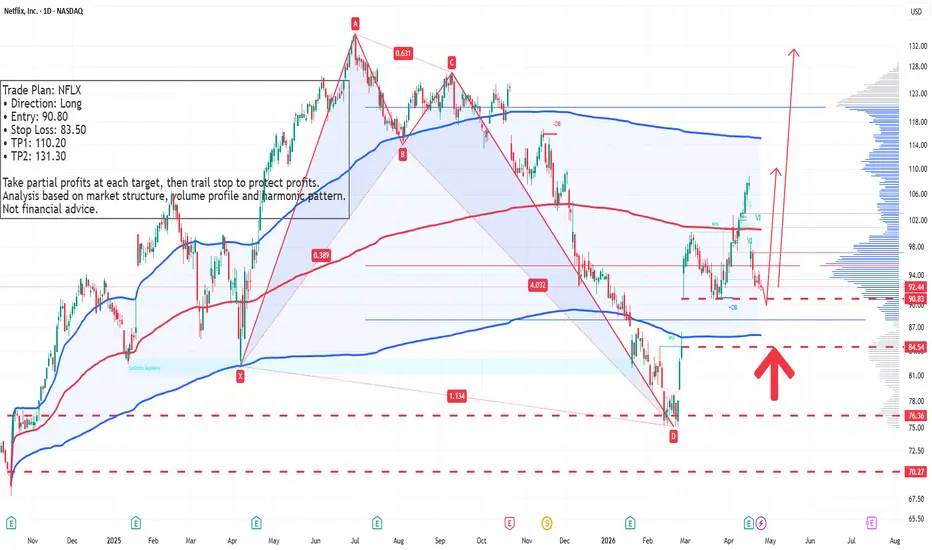
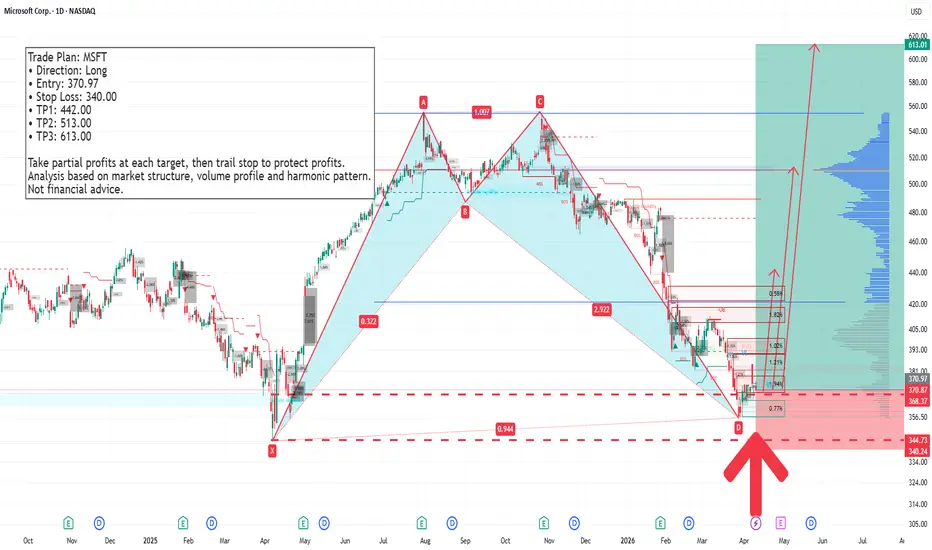
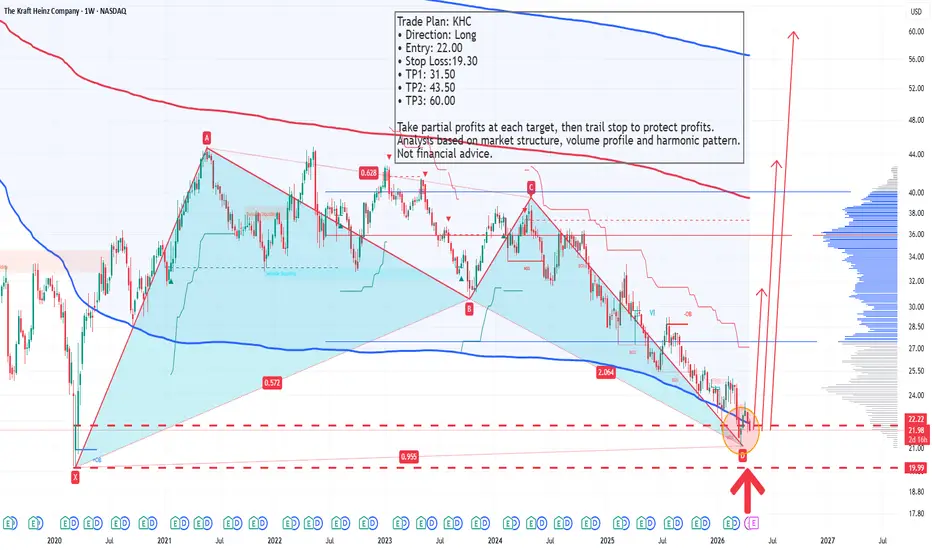
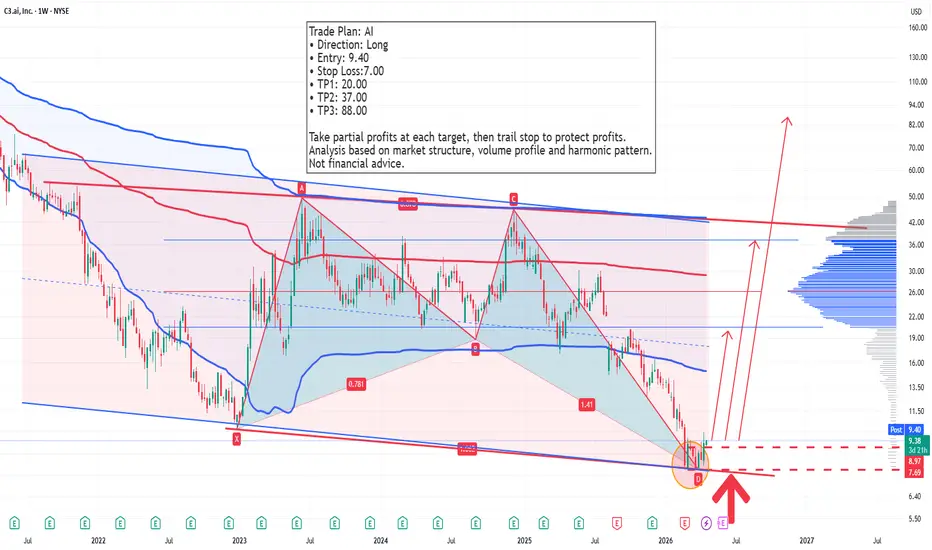
Bat
The Bullish Setup on ETH Has More Potential Than Once ThoughtFollowing up on this initial Bullish idea on the 4 Hour:
and this Bullish idea on the daily:
It would seem that ETH also has a big bullish setup on the weekly as seen in the current chart. We are at the all-time 0.618 Retrace and at this retrace we are making a local 0.886 and completing a Bullish Bat visible on the Weekly with Hidden Bullish Divergence on the RSI. If ETH really starts to bounce here at this heavy level of confluence it would be confirming a Partial-Decline of a Right-angled and Descending Broadening Formation, (a pattern of which that seems to be serving a secondary purpose of being the potential handle of a bigger Cup with Handle Pattern). If this starts to trade back towards 5000, chances of a Breakout are increased due to the partial decline, and the measured move of the Cup with handle and the Right-angled and Descending Broadening Formation both would take ETH to the 1.618-1.902 Fibonacci extension zones between $7,000, and $8,500.
It's also worth noting that ETHBTC on higher timeframes has also completed a Bullish Bat pattern and if you inflation adjust ETH's current price using the older metrics of the M1 Money supply before the rule change in 2020, ETH's price right now would actually be around $770 in terms of 2018 dollar value which is pretty cheap. So I'd say now would be as good of chance as any for ETH to stage a bottoming rally and this rally would likely be in line with the bottoming fractal we see on BTC:
and the topping pattern we see on USDT Dominance:
USOIL SELL 99.02On the 4-hour chart, USOIL has stabilized and is trending upwards, with bulls holding the upper hand in the short term. Currently, attention should be paid to the resistance around 99.02, which is a potential shorting entry point for a bearish bat pattern and is also located within a previous supply zone.
Basic Attention Token: bounce potential? key levels to monitorBasic Attention Token – ready for a bounce or about to fall through the floor? While majors are chopping after the latest crypto headline storm about regulation and ETF flows, BAT quietly slid back into a big historical demand zone. According to industry sources, interest around privacy and ad‑tech tokens is picking up again, so this pullback happens right where longer‑term players tend to reload.
On the 4H chart, price is sitting in that thick orange support block with visible volume memory and RSI hanging near the low 30s after a sharp dump. I’m leaning bullish from here – classic “liquidity grab into demand” vibe – looking for a mean‑reversion push back toward the recent local highs. If buyers step in, this could turn into a short‑squeeze setup as late shorts get trapped.
My plan: ✅ look for a higher low or a strong green 4H candle from this zone and target the mid‑range levels above, then potentially the upper red resistance area if momentum really kicks in. If we lose this orange block with clear selling volume, I switch bias – below here it can quickly slide to fresh lows and the bounce idea is dead. I might be wrong, but for now I’m stalking longs and letting price action prove me right or stop me out fast.
Basic Attention Token 8X Long with 1,248% profits potentialWe have many signals to support this chart setup. The MACD has a bullish cross, marketwide action, Bitcoin closing seven consecutive days green while trading above $70,000, several altcoins moving ahead...
Basic Attention Token, BATUSDT, is now moving to complete the classic Adam & Eve bottom reversal pattern. This formation supports higher prices.
See the full trade-numbers for a wonderful trade:
_____
LONG BATUSDT
Leverage: 8X
Potential: 1248%
Allocation: 5%
Entry zone: $0.0945 - $0.1050
Targets:
1) $0.1250
2) $0.1433
3) $0.1735
4) $0.1982
5) $0.2222
6) $0.2578
Stop: Close weekly below $0.0940
_____
Thank you for reading, your continued support is highly appreciated.
This is a time sensitive chart setup. The entry zone can be gone within hours. A few days at the most.
My strategy is simple, buy and hold while prices are low. No pyramiding, no rebuying on the way up. Buy and hold.
Sell when the action goes above 100%.
I am wishing for you tons of health, wealth and success.
Namaste.
XAUUSD SELL 5371On the 4-hour chart, XAUUSD has stabilized and rebounded. Currently, attention should be paid to the resistance around 5371, a potential shorting entry point for a bearish bat pattern, which also falls within a previous supply zone. If the price breaks through the resistance around 5420, an upward trend will begin.
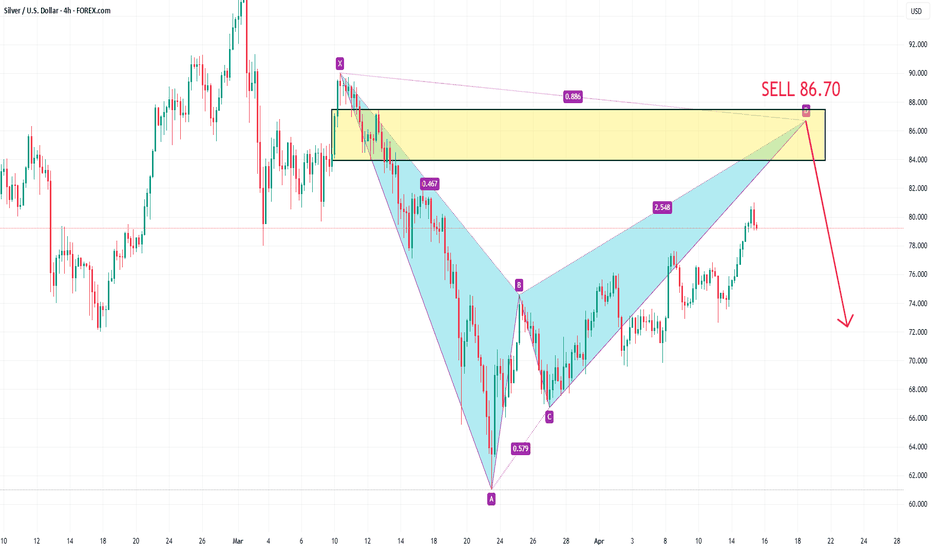
XAGUSD SELL 94.18On the 4-hour chart, XAGUSD has stabilized and rebounded, and the price is expected to continue rising in the short term. Currently, attention should be paid to the area around 94.18, which is a potential shorting entry point for a bearish bat pattern and is also within a previous supply zone. If the price breaks through the resistance around 96.30, the bearish bat pattern will fail.
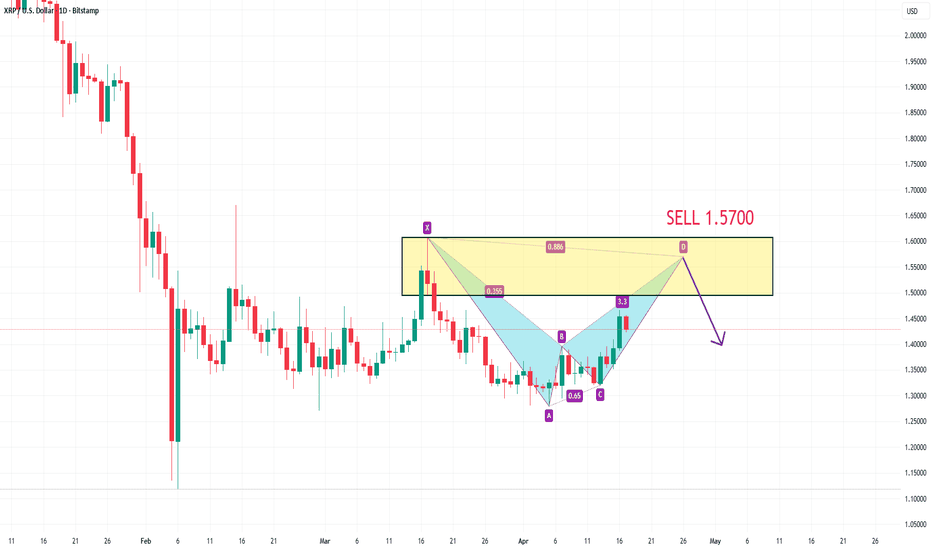
USDT Dominance: Bearish Bat; 3 Line Strike; RSI BreakdownOne of the main contributing technical reasons to my recent shift in being Bullish on crypto at these lows has been the USDT Dominance chart. Previously when I was Bearish, USDT.D was holding support at a trendline which aligned with the 61.8% retrace and had developed a local harmonic at the low and during the recent drop in crypto, the USDT Dominance rose back up and made a 0.886 retrace. It just so happens that in the process of doing so USDT.D completed an even bigger potential Bearish Bat Pattern. As its spent the last few weekly candles trading around the 0.886 retrace and rejecting it, the weekly candle now looks like it's going to take out the last few weeks of attempted bullish price action to confirm a Bullish 3 Line Strike which has historically been a very powerful Bearish Reversal candlestick pattern; and to do so on such a high time frame (the weekly) at the 0.886 Completion of this Bearish Bat while showing buyer exhaustion on the RSI which seems close to breaking down its trendline and killing the momentum; seems to all but confirm that the USDT Dominance will see a notable decline in the near future; one that may even result in the break of the uptrend and of the 61.8% retrace. If these supports break the only Harmonic BAMM Target for the USDT Dominance will be down at the lows of the 0.786 or even the 0.886 which from there we could be on the look out for a potential future Bullish Gartley, but for the time being declining to those retraces would result in a 50-80% decline in the US Dollar Dominance within the crypto market, which would mean that on the other end of that trade you will see the TOTAL marketcap dominance of Bitcoin and Other Cryptos start to rise at a similar rate.
USDCAD SELL 1.3878On the daily chart, USD/CAD has stabilized at lower levels. Currently, attention should be paid to the resistance around 1.3725; a break above this level could lead to further upward movement, with a target around 1.3878. When the price reaches 1.3878, watch for a potential bearish bat pattern, as this level falls within a previous supply zone.
XAUUSD TP 5460On the 4-hour chart, XAUUSD is trending upwards, with bulls holding the upper hand in the short term. Currently, watch for support around 5120; a pullback that holds above this level could lead to further gains, with an upside target around 5460. When the price reaches around 5460, watch for a potential bearish bat pattern.
Hesheng Silicon (603260.SH) Weekly Long SetupHesheng Silicon Industry (603260.SH) Weekly Chart Swing Long Trading Plan
Ticker: 603260.SH
Timeframe: Weekly
Direction: Long
• Entry: Around 44.50 CNY
Wait for a bottoming confirmation / bullish reversal candlestick signal on lower timeframe before entering long.
• Stop Loss: 41.00 CNY
• TP1: Around 65.00 CNY
Close 50% position, trail stop / move SL to breakeven.
• TP2: Around 90.00 CNY
Close another 50% of remaining position, trail stop.
• TP3: Around 130 CNY
Close another 50% of remaining position, trail stop.
• Remaining position: Let run with trailing stop.
Zhuosheng Micro (300782.SZ) Daily Chart Swing Long Trading PlanZhuosheng Micro (300782.SZ) Daily Chart Swing Long Trading Plan
Ticker: 300782.SZ
Timeframe: Daily
Direction: Long
• Entry: Around 70 CNY
Wait for a bullish reversal candlestick pattern / bottoming confirmation before going long.
• Stop Loss: Around 66.55 CNY
• TP1: Around 86.50 CNY
Close 50% position, trail stop / move SL to breakeven.
• TP2: Around 100.00 CNY
Close another 50% of remaining position, trail stop.
• TP3: Around 120.00 CNY
Close another 50% of remaining position, trail stop.
• TP4: Around 140.00 CNY
Close another 50% of remaining position, trail stop.
• Remaining position: Let run with trailing stop.
ETHUSDT Daily Chart Swing Trading - Long Setup ETHUSDT Daily Chart Swing Trading - Long Setup
ETHUSDT, Daily timeframe, swing trade, long position.
• Entry: around 1750.00 USDT
• Stop loss: around 1383.00 USDT
• Take Profit 1 (TP1): around 3000 USDT
Close 50% position, move stop loss to break-even / trail stop.
• Take Profit 2 (TP2): around 4200 USDT
Close another 50% of remaining position, trail stop.
• Take Profit 3 (TP3): around 6000 USDT
Close another 50% of remaining position, trail stop.
• Let the final small position run with trailing stop.
Basic Attention Token: ready for a bounce? key levels to watchBasic Attention Token. Waiting for this thing to finally stop dripping and give a bounce? Recently the whole altcoin pack has been moving in the shadow of the major coins, and according to market sources ad-related tokens are still under quiet accumulation while the browser project keeps shipping updates in the background.
On the 4H chart BAT is sitting right on local support around 0.12 with a clear volume node just above price that acts like a magnet. RSI bounced from oversold and is curling up, so I lean to a corrective move higher rather than a fresh dump. I might be wrong, but for now I treat the prior fall as overextended and expect a retest of the 0.126-0.13 resistance cluster.
My plan: look for longs on dips closer to 0.12 with a tight invalidation under 0.118. ✅ Base case - push into 0.126 then 0.13 where I would start locking in profit. ⚠️ If 0.118 gives way and we close below it on 4H, I flip the script and expect continuation down toward 0.112-0.11, staying flat until a new base forms.
JSW HOLDINGS -Bullish Bat Hrmonics🦇 Bullish Bat Harmonic Pattern – JSW Holdings
1. Pattern Structure
X → A: Initial strong decline forming the base leg.
A → B: Retracement to ~0.50–0.618 of XA (observed near 2.04 ratio in your chart).
B → C: Extension between 0.382–0.886 of AB (your chart shows ~0.925, which is valid for Bat).
C → D: Final leg completing near the 0.886 retracement of XA (classic Bat completion zone).
This alignment confirms a Bullish Bat, which is one of the most reliable harmonic reversal setups.
2. Key Technical Levels
Completion Point (D): Near ₹17,281 (current price zone).
Daily ATR: ₹650 → suggests average daily volatility.
Today’s Range: ₹440 vs Yesterday’s ₹730 → contraction in volatility, often preceding a reversal.
Support Zone: Around the “BS2 daily” horizontal level marked on chart.
Fibonacci Confluence:
XD ≈ 0.886 (ideal Bat completion).
BC ≈ 0.925 (within tolerance).
CD ≈ 2.04 (acceptable extension).
3. Technical Bias
Pattern Implication: Bullish reversal expected from point D.
Momentum Check: Price has tested deep retracement levels, aligning with harmonic completion.
Volatility Context: ATR contraction suggests potential breakout move once reversal confirms.
Moving Average: Yellow MA line indicates medium-term trend support aligning with harmonic zone.
4. Trading Strategy (Bias Only – Not Advice)
Entry Zone: Near completion point D (~₹17,200–₹17,300).
Stop-Loss Bias: Below X (~₹16,600–₹16,700).
Upside Targets:
T1: B point (~₹18,200).
T2: A point (~₹19,000).
Extended: Prior swing highs if momentum sustains.
5. Verdict
The Bullish Bat Harmonic in JSW Holdings signals a high-probability reversal zone around ₹17,200–₹17,300. With ATR contraction and harmonic completion, the setup favors a bullish bias provided price holds above the X‑point.