RSI as a Trend ToolMost people use the RSI as a momentum indicator,
trying to find Overbought/Oversold (OBOS) conditions,
and/or divergences.
However there is also a way to use it as a Trend Tool.
There is a mathematical relationship that connects the RSI and EMA's.
The formula is RSI(x) cross-over 50-line = Close cross-over EMA(2x)
i.e. RSI(14) cross-over 50 line = Close cross-over EMA(28)
This one of the properties of the RSI,
which I discovered when taking a more indept look into momentum indicators,
which
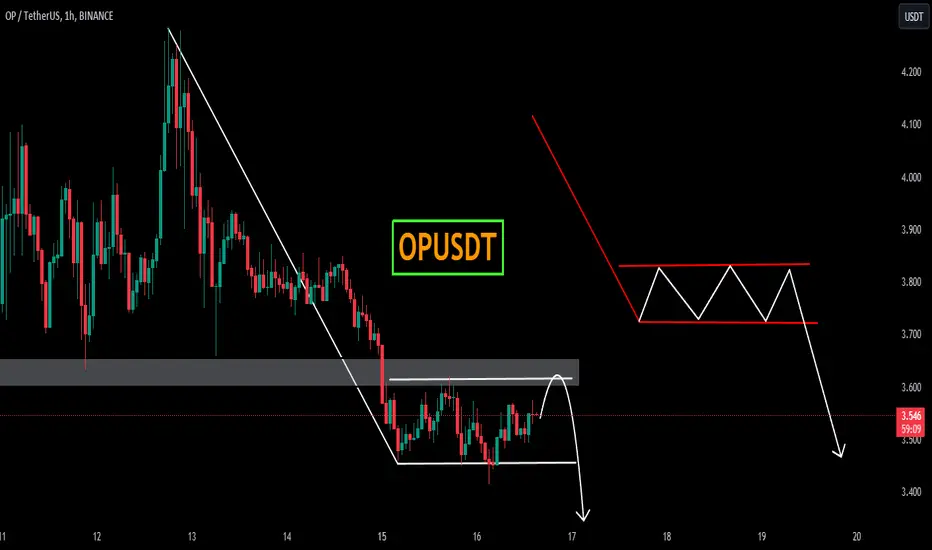
Bearish Flag
US Dollar Four Day OutlookIt's always important to look the US Dollar when determining the outlook for Bitcoin. Remember, when the US Dollar rises, Bitcoin does the opposite, which is why the price of BTC is experience in the red.
However, looking at the US Dollar Chart, the DXY is oversold on the Relative Strength Index. This is a bullish momentum for Bitcoin, as the US Dollar can experience a pullback for the next four days.
We need to wait confirmation on the MACD on the four hour timeframe.
THIS IS NOT FINANCIAL
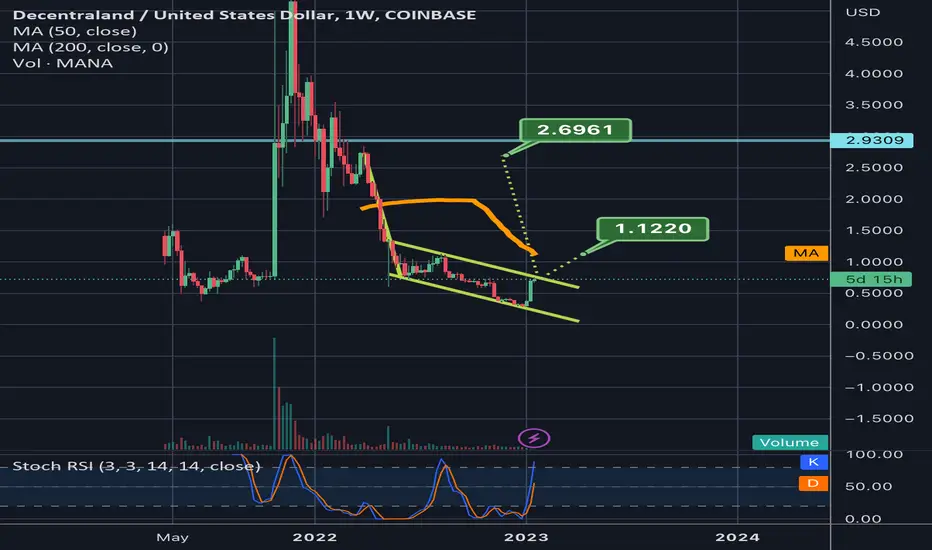
Mana in a similar bear flag as gala was.Just like my previous idea I posted on gala, mana is also currently inside a similar bear flag where the flag is also a descending channel. The full breakdown target for this would be negative 1.80 so I think it’s more likely this bear flag breaks upward…the descending channel on its own usually breaks up so often when you see it as the flag of a bear flag it can increase the likelihood the bear flag breaks upward instead of down like they usually do. It could still break downward and not hit th
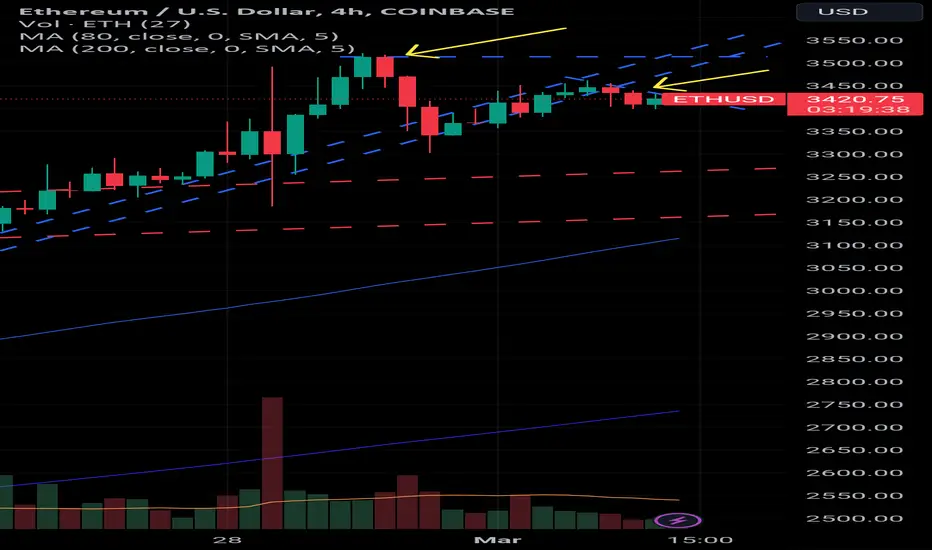
ETH is showing weakness in its long term rallyETH recently has been losing momentum. The rally now showing one of two scenarios:
Consolidation where profit taking is occuring before another rally
Reversal in the trend
We can see this weakness by identifying two aspects in the price action.
Fails to make a higher high
Breaks long term upward trend
SNOW - buy the disappointment discount sale LONGSNOW beat the earnings estimates by 150% and slightly exceeded revenue estimates. Price
dropped in printing a bear flag in a 22% move yesterday at the close. Buying from the bottom
has begun and I have the idea that I should join. My pre-earnings play was closed going into the
earnings in the high liquidity that proceeds it. I got my ask price on that position. The chart
shows today's buyng volume and volatility. On the slow resumption of bullish price action, I have
taken a long trad
Bearish flag pattern Price will potentially move towards taping into the 90% Rule area to retrace and move down towards taping into the previous weekly support area, which will form an area of equal daily lows. Price is potentially going to shoot up towards or close to target area, if not, price will move further down to the lowest weekly support area. Enter at 15min timeframe to maximise RR.
Paytm - Royal Trapping of Retailers (or) Real Bullish Reversal ?Paytm is Hot News for the past couple of weeks on all Social Media channels for obvious reasons. While RBI and Central Govt turned their back on Paytm, the once famed as Hero is now on the verge of becoming Zero.
Right from the IPO valuations, Paytm is not in good books of many investors and has been losing its value continuously from 2000 all the way down to 300 range now
While Many Retailers who are Trapped in there - looking up to the almighty for a saving hand, many feel the new about Axi
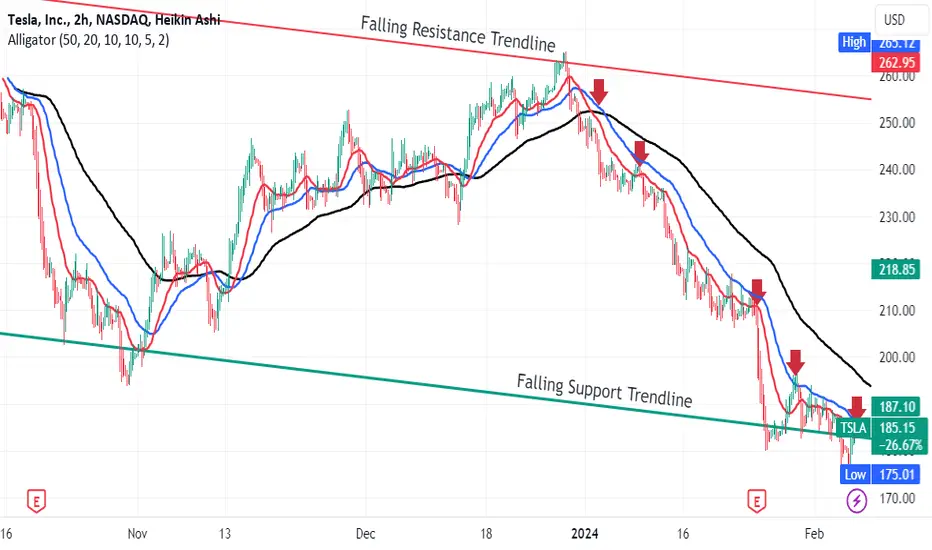
TSLA 120 minutes Chart Moving Average pullbacks for Short EntryTSLA has been trending down in a channel since it marked the first trading day of this new year.
The chart is set up on a 120-minute time frame with the Williams Alligator indicator of
SMA10 SMA20 and SMA50 ( offsets 10, 5, & 2). In a strong downtrend, the averages are parallel
with SMA50 higher then SMA20 and SMA 10. For a good short entry, the price should pullback (
and up) through the SMA10 but not through the SMA20. An entry is taken when price falls
back through the SMA10. The supe
ROKU falls after an earnings beat dissapointmentROKU on the 30 minute chart had a sell-off after earnings which were okay not great. Traders
reacted. The question is whether it was an overreaction. I think it was. I am looking for a slow
recovery over a week or more to at least the standard retracement level which I will call 98 as
drawn by the tool. further upside targets are 101 and 104 based on VWAP bandlines.
Buying on the discount is sometimes an excellent tool to reduce risk and use the reversion to
the mean to best advantage an
TSLA Reports and goes for a deeper dive SHORTOn this 4H Chart, I find good cause to continue my lot of 10 put options on TSLA. TSLA has
dropped another $ 25.00 per share price during the earnings report time frame. While the
overall long time frame supertrend is up, TSLA is presently in a sustained pullback likely due
to significant fundamental and economic factors. The antics of its CEO demanding an award of
more shares so he can launch a big AI initiative within TSLA is not helpful. He has taken a big
haircut but he can easily a
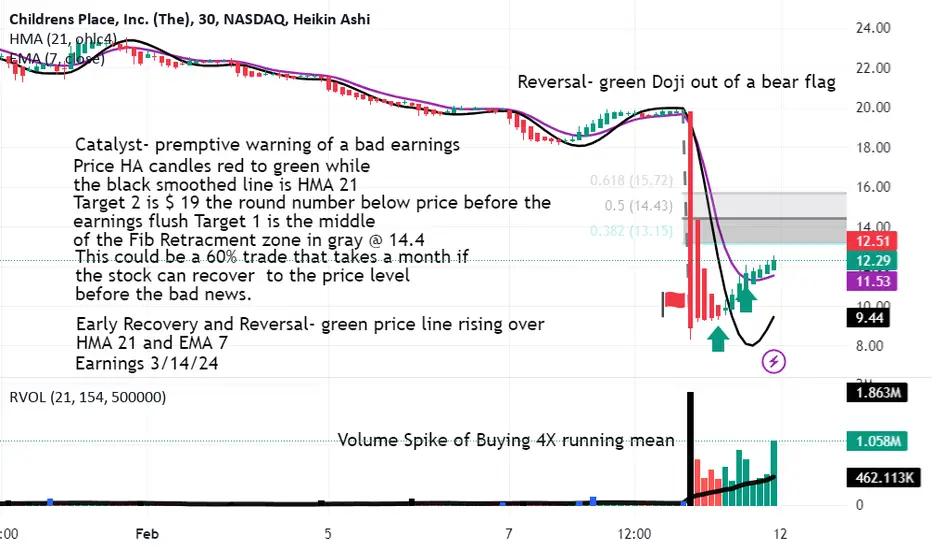
PLCE crash and flush on pre-emptive warning from executives LONGPLCE as shown on the 30 minute time frame had a "waterfall" event when a bad news catalyst
hit the wires. Executives announced earnings issues one month out from the report due about
March 14th. Maybe is real and may not. The are no filings available to show any insider sell-
off unlike what is going on at General Dynamics at its all-time high. Could those executives
push traders to bail on the stock, force it to crater and then buy even more at the bottom or
have friends and family h
EURUAD potential sell updateas you guys can see euruad is playing out as planned ill make sure to put analysis i shared a hour or two ago to this description but now ill just waiting on a pull back for confirmation so ill just be watching closely because this move could happen really fast.
*EURAUD/SELL
Bearish Flag on EUR/USD @ D1A bearish flag pattern has formed on the daily EUR/USD chart following a downtrend that lasts since the end of 2023. The pole and the flag's borders are shown with the yellow lines. The stop-loss level (the red line at 1.07953) is set to the highest point of the flag area. The take-profit level (the green line at 1.06210) is set to the pole's length subtracted from the stop-loss level. I will open this short position only if the currency pair closes significantly below the flag's lower border.
Potential Bear Flag?? - EJHere I have EUR/JPY on the 4Hr Chart!
Ever Since the beginning of the sight of the Double Top Reversal Pattern on the Weekly Timeframe, Price for EJ has been slowly forming what looks to be a Bearish Channel!
Now over the weekend of Jan. 19th - 21st, Price crested inside the Channel and made a strong decline signaling the Buying Power has waned allowing Bearish pressure to come in and take over!!
Now if my Bearish Bias turns out correct, we will be looking at a potential Trend Continuation pa
Oil Remains Channeled!Here I have USOIL on the 4Hr Chart!
The beginning of this week seen what was a Fake-Out of the Bearish Break of this Bullish Channel!
Now typically in this case, a Bullish Channel preceded by a Strong Downtrend move signals a Trend Continuation pattern in the potential form of a Bear Flag!
With this possible trade idea, my expectation is that we look for a VALID BREAK to the DOWNSIDE!!
BUT there is always the possibility Oil was able to find enough Support after having visited the 68 - 67 Su
Momentum Indicator for USDEUR turns positiveMomentum Indicator for USDEUR turns positive, indicating new upward trend
USDEUR saw its Momentum Indicator move above the 0 level on February 04, 2024. This is an indication that the stock could be shifting in to a new upward move. Traders may want to consider buying the stock or buying call options. Tickeron's A.I.dvisor looked at 125 similar instances where the indicator turned positive. In 46 of the 125 cases, the stock moved higher in the following days. The odds of a move higher are at 37
SEIUSDTSEIUSDT is in strong bearish trend and also form bearish flag pattern. Recently the instrument has break through important support zone.
Now the price is trading within the bearish flag and seems like it getting ready to break it.
Will the sellers took benefits from these bearish confluences?