London cocoa: Bearish channel points to £3,817London cocoa does not have a consolidation; rather, it has a distribution. This difference is important and it is being highlighted in the chart, the fundamental analysis, and the seasonal calendar. The Ivory Coast exported 2.14 million metric tons of cocoa in the current marketing year, up 19% on last year, and methodically destroying the deficit story that saw prices hit record highs of £10,820 in December 2024. Meanwhile, the regulator in that country has just announced plans to increase proc
Bearish Trend Line
Short term trade Idea for BITCOIN - SHORTSWe could see a range form here before the next massive leg up.
We will see a lot of search and destroy PA for the next 2 months while Institutions build their orders here.
Looking for Sweep of Buyside Liquidity and then Sellside Liquidity.
We should see an ugly wick to downside in Oct or Nov to flush out longs.
Gold (XAU/USD): Resistance and Scenarios to WatchGold (XAU/USD) Technical Analysis: Key Support, Resistance and Scenarios to Watch
Gold remains one of the most closely watched markets for investors assessing changes in risk sentiment, interest-rate expectations and the U.S. dollar.
Rather than attempting to predict the next move, technical analysis can help identify the price levels that may determine whether the current market structure remains intact or begins to change.
In this analysis, Capital Regency examines the current XAU/USD struct
Gold (XAUUSD) — Liquidity Grab at Trendline, Eyes on the Bullish**Gold (XAUUSD) — Liquidity Grab at Trendline, Eyes on the Bullish OB 🟡📉**
Price just swept the highs of a descending trendline that's been capping rallies since the 4,520 top — classic **liquidity grab** before rejection. Since that grab near 4,440, price has been carving out a bearish channel, printing lower highs and lower lows straight into the 4,400 zone.
**What the chart is showing:**
🔸 **Liquidity Grab (~4,440):** Price wicked above the descending trendline, triggering breakout buy sto
OIL INDIA — GOLDEN RATIO AT A CRITICAL DECISION ZONEOil India – Key Technical Setup
Oil India is currently trading within its Fibonacci golden-ratio zone between the 0.5 and 0.382 levels, roughly ₹430–₹441. Despite giving a trendline breakdown, the stock is still respecting this important Fibonacci support zone.
At present, the structure remains range-bound, and the next major move will depend on which side the stock breaks.
Bullish Scenario:
If Oil India manages to reclaim and break above the upper trendline, the Fibonacci zone will continue
XAU/USD (15M) BREAKOUT ALERT: Mass Liquidity Grab Before MD?📊 HIGH-ENGAGEMENT SIGNAL CARD
Instrument: Gold / U.S. Dollar (XAU/USD) 🪙
Timeframe: 15-Minute (15M)
Trading Bias: Short / Bearish Rejection 🔴
Key Reaction Zone (Sell): 4,258.34
Invalidation / Stop Loss (SL): 4,286.33
Primary Target (TP): 4,161.31 (Bullish Order Block)
Risk/Reward Profile: 1 : 3.47 (High R:R Ratio)
💡 DEEP DIVE ANALYSIS (SMC + PRICE ACTION)
Is Gold setting up a massive trap for retail buyers? Here is the exact technical framework showing why the path of least resistance poi
Title XAUUSD | 4H Bearish Outlook | Sell Entry & Liquidity
Step 1: Price has reached a key Sell Entry Zone, where sellers may regain control after rejecting higher prices.
Step 2: The bearish trendline and recent price action continue to support a bearish market structure with lower highs.
Step 3: A rejection from the current resistance zone could push price toward Target 1, which acts as the first bearish objective.
Step 4: If bearish momentum remains strong, price may sweep the Swing Low / Liquidity area to collect resting liquidity.
Step 5: A c
CRUDE OIL |Major Channel Resistance in Focus,Bearish Bias IntactCRUDE OIL ANALYSIS
Price has rallied sharply into a major descending channel resistance, a zone that has repeatedly triggered selling pressure in the past.
Bearish view remains valid as long as the channel resistance holds.
A sustained move below 8,500 could accelerate the downside towards:
Target 1: 8,000
Target 2: 7,800
Invalidation: If price manages to break and sustain above the channel resistance, the bearish outlook will no longer remain valid.
Expected Reversal Zone: 9,300 – 9,500
Crash in MorphousdtHello Traders!
MORPHOUSE is at the peak and bulls are not able to push it further and market is forming bearish pattern. There will be a crash in Morphousdt.
We can see a rising triangle in MORPHOUSE and there will be a crash soon after breakout and there are multiple bearish patterns in Morphousdt.
We are selling Morphousdt from 2.1
Stoploss 2.2695(-7.9%)
Target 1.7612(+16.2%)
My goal is to be recognized as one of the highest win-rate traders in the TradingView community. :)
Trade Analy
STG near unbreakable resistanceHello Traders!
STG is at very strong resistance level and its very hard to break this level for now. So it is ready for a dive.
Target 0.1732 (+8%)
Stoploss 0.1908(-1.3%)
My goal is to be recognized as one of the highest win-rate traders in the TradingView community. :)
Trade Analysis Based on
> Fibonacci Tool (A1000x Way) – Custom Fibonacci approach for precise market analysis
> Candlestick Patterns – Strong price action confirmation through key candle formations
> A1000x Breakout Strateg
SShort
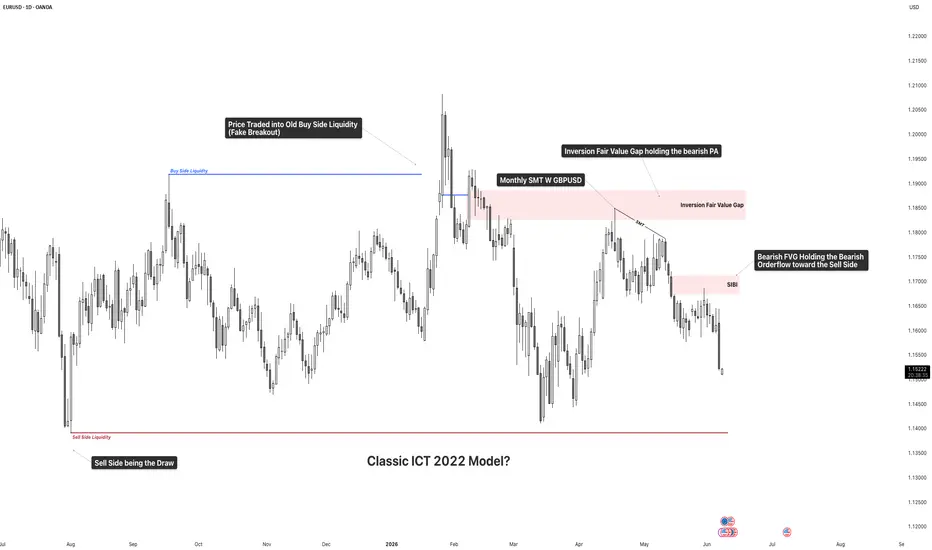
Monthly SMT Says EURUSD Isn't Done FallingHigher Timeframe Context
EURUSD appears to be following a classic ICT 2022-style distribution model.
- Price raided old Buy Side Liquidity and failed to continue higher
- Monthly SMT formed against GBPUSD
- Inversion Fair Value Gap remains respected
- Bearish orderflow continues to hold
👉 As long as these bearish PD Arrays remain intact, the path of least resistance remains lower.
What Happened?
After taking liquidity above the previous highs, EURUSD delivered a fake breakout and quickly re
XAUUSD SELLER STRONG OR PULLBACK (READ CAPTION)Hi traders what do you think about gold
Gold is currently trading within a bearish market structure, with sellers maintaining control below key resistance levels. Recent price action suggests that any short-term recovery may face selling pressure, keeping the overall outlook negative unless buyers can regain momentum above resistance.
The resistance zones at 4177 and 4224 are important areas to watch. A rejection from these levels could strengthen bearish momentum and increase the likelihood of
Gold Chart Review, Is The March Low The Next Target?Higher Timeframe Context
Gold continues to respect bearish orderflow across multiple timeframes.
- Daily chart created SMT with Silver inside a Daily SIBI
- Price traded above old Buy Side Liquidity and failed to continue higher
- Multiple SMT confirmations formed during the retracement
- Bearish FVGs remain untouched overhead
👉 As long as these bearish PD Arrays continue holding, lower prices remain favored.
What Happened?
Price engineered liquidity above previous highs before reversing aggr
Bitcoin Breaking Second Bear Channel - Down We GoTrading Fam,
If you've been following me for any length of time, no surprises here. I told you long ago that 81k was our line in the sand. The bulls gave us a touch and were immediately exhausted, dropping us all the way back down to the bottom of our bear channel. I was honestly expecting a little bit of a bounce here, but the bulls couldn't even muster enough energy to do that. At every turn, the bulls have continually surprised me with their lack of strength. I have almost always given them
ZEC must Pay the priceHello Traders!
First of all congrats on 5 win streak since last week and we are looking for streak continuation.
Recently ZEC showed strong bullish move and it extended further than it was supposed to move. So it has to pay the price for that. Now Bulls are over and we will see strong bearish moves from now onwards. There is a strong resistance near our stoploss but its too high to break. This fall will be Mega fall in ZEC as it will be 50% dump.
Stoploss 781.93 (-18%)
Target 346.9 (+47.5%)
4H ETH/USDT📊 Context
Short-term trend: downward / consolidation under resistance
Structure: lower highs → classic supply pressure
You have a downward trendline drawn and it's working correctly
🔑 Key levels
🟢 Resistance:
2312 – current local struggle zone
2341 – mid-range / often reacts
2387 – main resistance (recent rejections)
🔴 Support:
2247
2218 – 2209 (important demand zone)
2159 (if everything lets up – next target)
📉 What just happened?
Strong upside breakout → rejection on the trendline
Quick dump
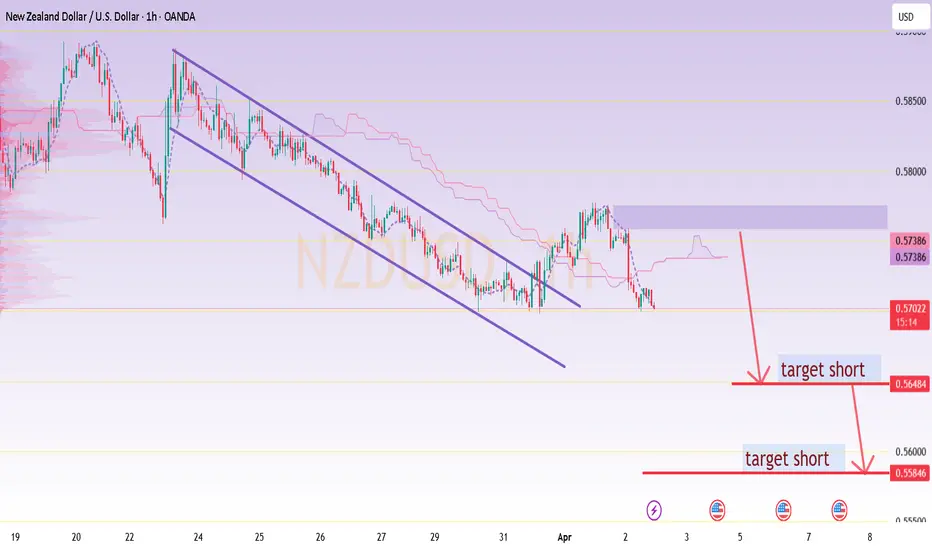
NZDUSD Bearish Continuation – Channel Breakdown Signals Further NZDUSD was trading within a well-defined descending channel, maintaining a clear bearish structure. Recently, price broke below the channel support, signaling a potential continuation of the downtrend.
After a brief pullback, price faced rejection from the resistance zone around 0.5738, confirming strong selling pressure. Currently, price is holding below the key support level near 0.5703, which further strengthens the bearish bias.
If price continues to stay below this level, the next downsid
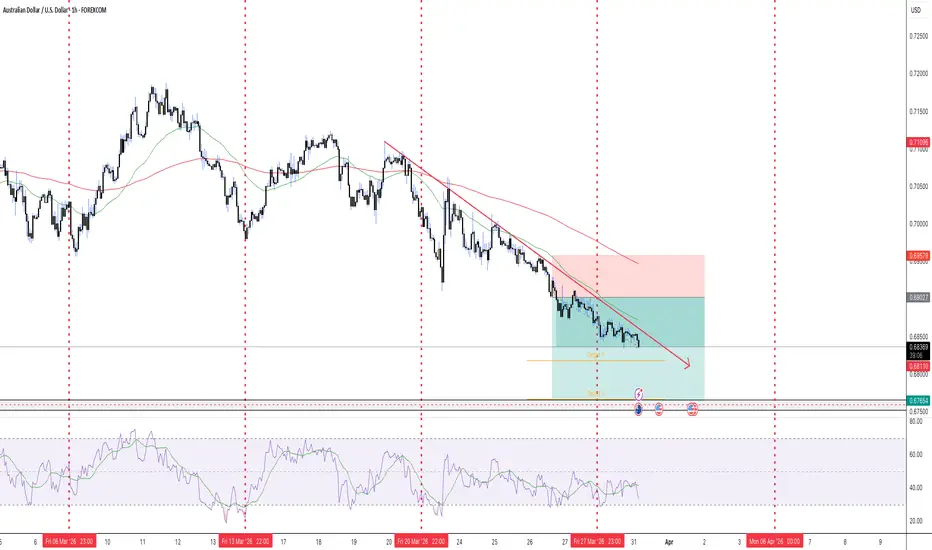
Bearish AUDUSD Continuation of Trend!Coming off a strong week of movement, the market has given us a clean bearish setup.
Price is currently respecting the established downtrend, with structure continuing to favor downside continuation.
As long as price remains below the trendline, we’re looking for continuation toward:
Target 1: 0.68180
Target 2: 0.67650
However, if price breaks above the trendline, the focus shifts.
In that case, we want to see:
A clean break and close above the trendline
Followed by a retest holding as s
TAO/USDT Breakdown Below Resistance — Bearish Pressure BuildingTAO/USDT is showing clear weakness after rejecting and breaking down from its trendline resistance. As long as price remains below the $180 level, bearish momentum is likely to stay active.
If selling pressure continues, the next potential downside target stands around $159.91.
In current market conditions, it’s important to trade cautiously, wait for proper confirmation before entering, and always manage risk wisely.
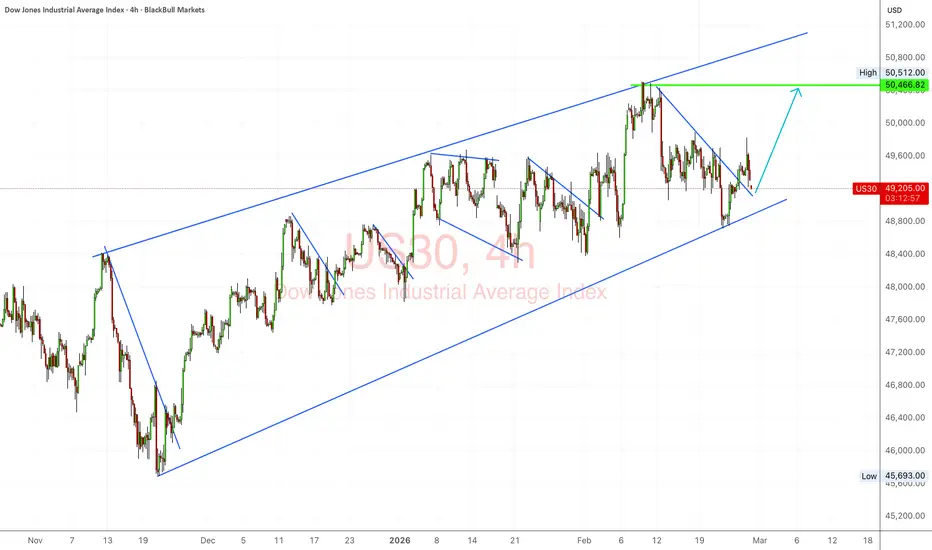
US30 Grinding Higher Within StructureDow has respected its broader rising channel for months, and once again we’re sitting near the lower half of that structure after a sharp pullback from the 50,500 area. What stands out to me is how quickly buyers stepped in near the ascending support. That tells me this isn’t panic selling — it’s rotation. But rotation inside a channel isn’t the same as expansion.
Right now, the Dow is at a decision point. Either this is a healthy higher low before another attempt at 50,500+, or we’re starting
Rising Wedge Pattern S&P 500There is clear a Rising Wedge Pattern formed on S&P 500 4h chart .
There was even a retracement from all-time highs of 6979 back inside the wedge before the weekend.
My suggested SL is 7030-7050 and TP 6500-6550 for the short-to-mid term.
On a larger scale, there is also a huge channel that we are testing the top of right now:
Going all the way back to 2008..
It could easily end up like this:
So for longer term I can see 6100, 5500, 5000 and if recession hits than even 3500