The power and simplicity of Camarilla PivotsWhy Camarilla Pivots?
They are simple
They are objective
They give you market context
They provide good levels for trades
They can be used in both ranging and trending markets
The Basics
The Camarilla Pivots system contains the following levels, which are automatically plotted for each session:
H1, H2, H3, H4, H5, H6.
CP
L1, L2, L3, L4, L5, L6.
Each of these pivots carries a specific meaning and can provide important market context.
CP is the center pivot , or close pivot
Camarilla Pivot Points
Two zones to long the SPX500Hello Traders, there are 2 zones that you can enter market.
the first one is between 5980 and 5950. If it coincides with Bollinger lower band, it could go up more sharply.
in that case top of red bearish channel could be considered as the 1st tp.
The 2nd option available after breaking the top zone, in reverse to 6132 we could enter the market again. Remember that again Bollinger band could help us to confirm the long trade. 6240 could be used as TP, as well as the higher band of Bollinger ban
NFP Incoming - Will SPX Smash 6100?NFP Incoming – Will SPX Smash 6100? | SPX Market Analysis 7 Feb 2025
The bulls keep charging as SPX edges closer to 6100. But with the NFP report dropping pre-market, things could get lively.
Will we blast through resistance or bounce back down? Expect some whipsaw chaos before the market settles – but with a bullish trend already in play, we should at least get one more push toward target exits before the dust settles.
---
SPX Deeper Dive Analysis:
📈 Bullish Move On Track
SPX has ridde
(BTC) bitcoin "BB Trend - long range view"Here is another look at the BollingerBand Trend indicator with a greater reach in view. As seen in the graph with correlated indicator BTC reached a red zone at the time when the price was at its highest this year before falling and as the price fell the indicator began to rise once more. Being in a red, or under 0, with the BBTrend indicator right now and what does it mean is a good question to try to answer. There are too many indicators and all of them cannot be laid on top of one another to
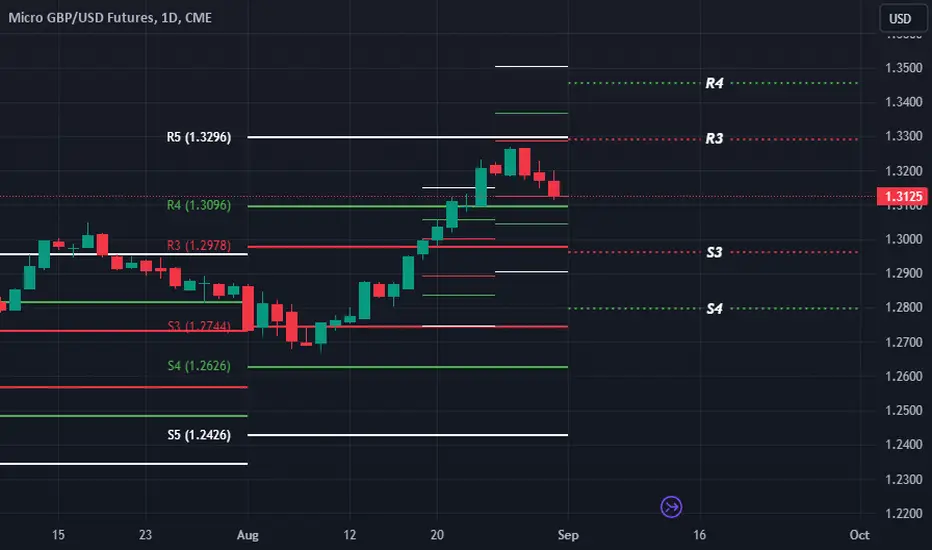
Navigating September 2024: British Pound Trading ForecastAs we approach the close of Q3 2024, key pivot levels on the Camarilla indicator suggest pivotal moments ahead for the British Pound. The currency's performance at these levels could dictate the trading strategy for the upcoming period.
Camarilla Insights and Strategic Levels:
The British Pound reached a significant juncture at the $1.3220 level, identified as the R5 resistance and a prime profit-taking zone during Q1 2024. This level is now expected to serve as a focal point for institutio
Advances Camarilla Concepts (2)Advanced Camarilla Concepts: Mastering Two-Period Relationships
In the sophisticated realm of Camarilla pivot trading, understanding two-period relationships is crucial for discerning the market's directional bias and anticipating movements in upcoming sessions. This analytical approach focuses on the third layer (S3 and R3) of the Camarilla pivots, similar to Pivot Width Analysis, but delves deeper into nuanced market signals across seven distinct types of relationships.
Exploring the Seven T
Advanced Camarilla Concepts (1)Exploring Advanced Camarilla Concepts: The Strategic Role of Pivot Width
In the realm of technical analysis, understanding the nuances of pivot points, particularly within the Camarilla framework, can significantly enhance a trader's ability to forecast and capitalize on market movements. A key aspect often overlooked is the analysis of pivot width, especially the width between the third layers, S3 and R3, which offers crucial insights into impending market dynamics.
Pivot Width Analysis: Deco
Camarilla Pivots: A Guide to Mastering Reversals and BreakoutsIntroduction to Camarilla Pivot Points
Before delving into the personal challenges I've encountered with Camarilla Pivots, and the often stark contrast between theoretical strategies and real-world trading outcomes, it's crucial to lay a foundational understanding of the Camarilla Pivot Points. This will set the stage for discussing the adjustments and solutions I implemented to navigate these challenges effectively.
Understanding the Core Layers of Camarilla Pivots: S3 and R3
Camarilla Pi
Mastering Market Dynamics with Camarilla Pivot PointsIntroduction to Camarilla Pivot Points: A Game-Changing Indicator
Camarilla Pivot Points stand out as one of the most effective leading indicators in the realm of technical analysis. Franklin O. Ochoa's "Secrets of a Pivot Boss" offers a profound exploration of this method, widely used for identifying pivotal support and resistance levels in the financial markets. The book is acclaimed for its clear exposition of complex concepts and actionable strategies that cater to both novice and experien
5ADR - Average Range of Last 5 CandlesticksAverage Daily Range (ADR) Indicator for the Last 5 Days
This script calculates the Average Daily Range (ADR) for the last 5 trading days. It helps traders to understand the average movement in pips, providing insights into potential price movements.
How to Use:
Set Chart to Daily Timeframe : Ensure your chart is set to the daily timeframe.
Hover Over Previous Day : To see the ADR for today, hover your mouse over the previous trading day.
For example, if today is Tuesday, hover over Mond
Indicator
Divergence into a Reversal?? - AUHere I have AUD/USD on the 1Hr Chart!
Our two current Lows @ ( .9498 ) on Wed. April 10th and ( .9456 ) on Fri. April 12th show an interesting underlying story when it comes to our indicators!
1) Looking to the RSI and comparing the Lows to Price on the chart, we can see that the RSI is showing a STRONG Divergence meaning Price could potentially be looking to move up now!
2) Our Momentum & Volatility indicators are showing Consolidation or Sideways movement meaning there is really no more tre
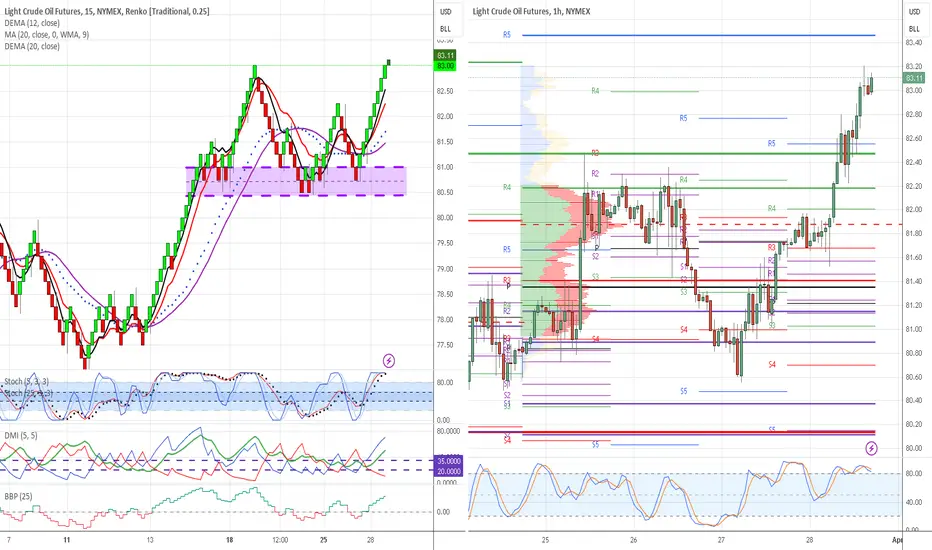
A Renko Trading Strategy with Multiple Indicators (Update 3)An update from the last summary: Stating the obvious but the recurring pattern did not play out.
This was a painful past couple of days but some realizations that I will walk through here for anyone who may be on a similar journey or realizations.
“Buy high and sell low” or “buy support and sell resistance” are simple words to speak, to walk through in back testing, but, in the heat of the moment with live data and markets unfolding in ways you weren’t expecting make these phrases an near im
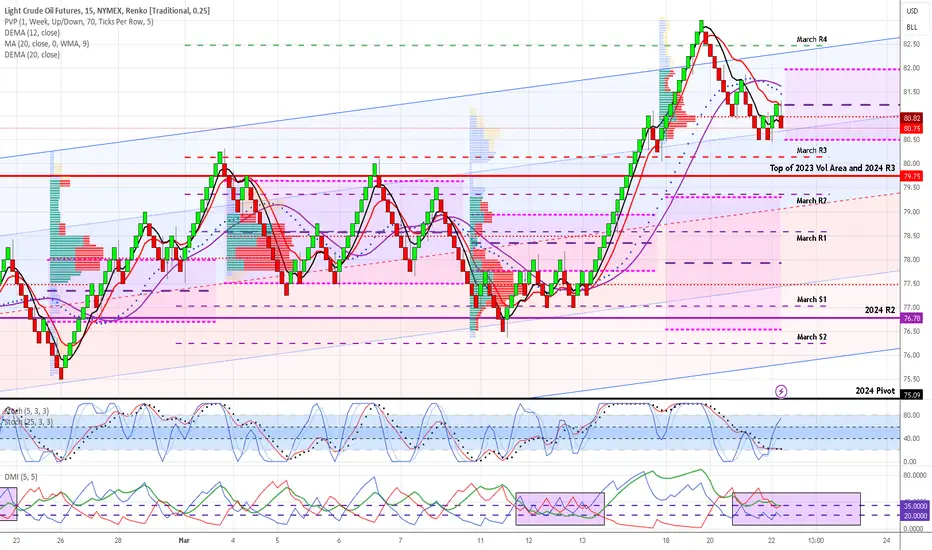
A Renko Trading Strategy with Multiple Indicators (update 1)This will serve as an update to the previous discussion specifically to some of the chart settings and the approach.
Going into the open on 25-March-2024, I was looking for price to move lower to test the monthly and yearly Camarilla R3. My reasoning was that neither seemed to have been tested yet and that these two together would provide a good level for support. My long term view on crude oil is bullish and I believed this type of action would provide a good entry point.
However, this plan
A Renko Trading Strategy with Multiple IndicatorsThis study will walk through several concepts in analyzing crude oil. The primary chart type will be a Renko chart with the block size (ticks) set to 25 (0.25 in TV) and with a timeframe set to 15 minutes. The significance of timeframe is that in TV, it will take this amount of time for the price to maintain a full block change (25 cents) in order for it to be ‘printed’. In times of high volatility, a 15-minute window can allow for more than one block to print at the same time. While this ma
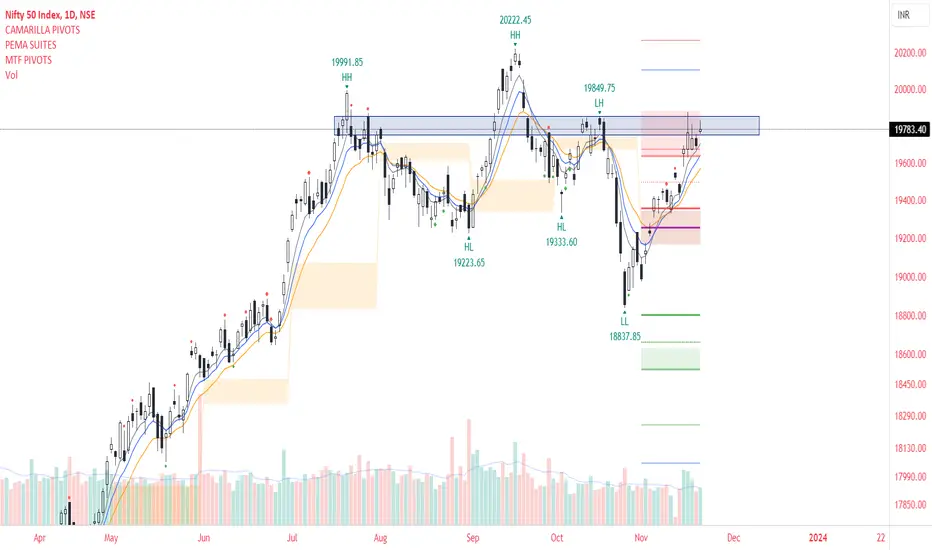
#NIFTY50 - Move ahead.1. Nifty is breached Bearish Golden Pivot Zone (GPZ) and trading above Monthly Cam H4( Bullish Breakout) and traditional pivot level R1.
2. Nifty levels 19751-19851 having very strong supply zone but the good news is Quarterly pivot is at 19695 above this level and past 3 sessions nifty closed above this level. we can say above 19700 is now a very strong support.
3. Volume on daily time frame is increasing and above 13 moving average.
4. If Nifty Daily close above 19888 then we will see new
How not to trade Gold. Really.Double Top preceded by a 50% Fibonacci was a bad trade idea. Lost 1K on this for trying someone else idea. Also lifted the SL to 1779-1782 area to act as the biggest risk I would take in this position. Even thought I knew the risks. I normally do not trade Gold since I do not have enough money. I could have taken gains at 1770 instead 📞 I'm such a noob.
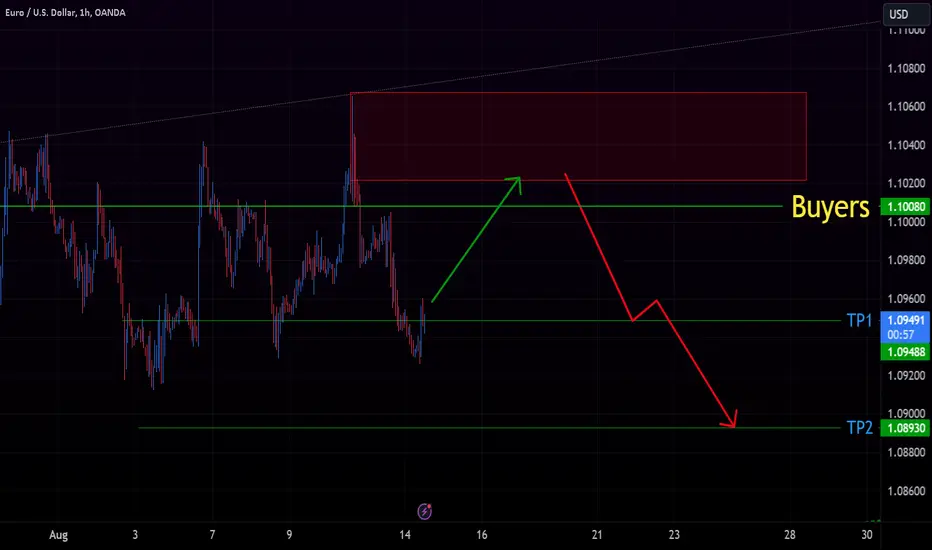
EURUSD levels and trading guide! Currently there are almost more buyers in the market
EURUSD is bearish! In case of any correction we could see a reversal from the level!
Shorter-term traders could enter long positions now. We don't enter!
These are best levels regarding Support and resistance, Channels, Weekly pivots, Buyers and Sellers focus and order_block.
USDJPY AnalysisHello, traders. The support and resistance area of 139 may soon be approached by the USDJPY, which is now in a correction phase. The trend is currently upward. Throughout this and the following trading week, we'll be keeping an eye on USDJPY in case a buying chance presents itself close to the 139 zone.
EURUSD full weekly AnalysisSMA 20 of Daily chart alamost matches with SMA 480 of hourly chart.
SMA20 of daily chart was a great trend detector for the pair recently so I'll use 480 in hourlt chart.
According the SMA20 we are still bullish.
By deeper look at Daily chart a bullish channel could be seen that proves bullish trend. Also a great SNR zone is obviously clear in daily chart.
I think last week was just a correction.
By looking at 1H zone, we could see conflux of mighty SMA480, Camarilla pivot level of S3
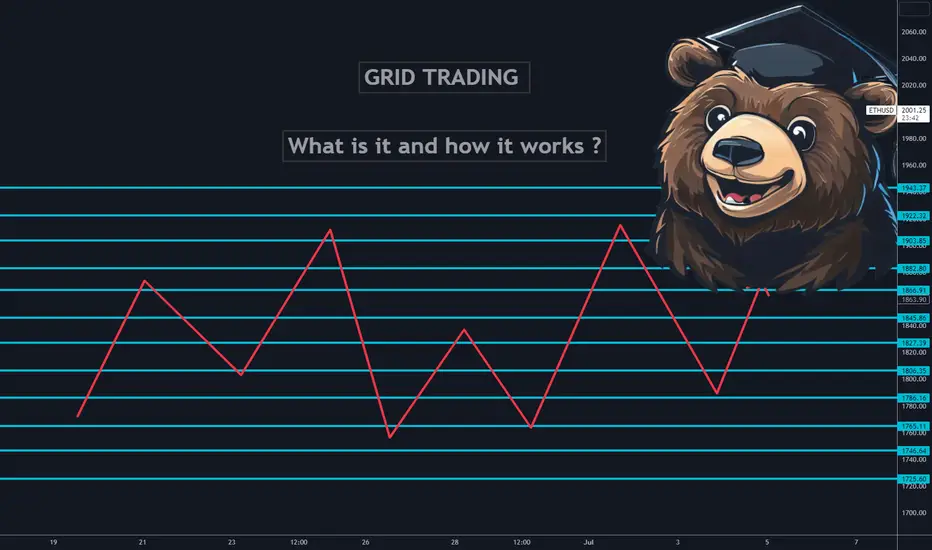
Educational: Grid Trading, What is it? How it works?Grid trading is often marketed as a way to win every trade. People usually get away with this type of marketing of the trading style due to the fact that grid trading does not care for market execution in the sense of market direction because you will close profitable trades if the market goes up or down. But it's not as simple as that.
What is Grid trading?
Grid trading is a type of trading strategy that makes use of market price variations by placing buy and sell orders at regular inte
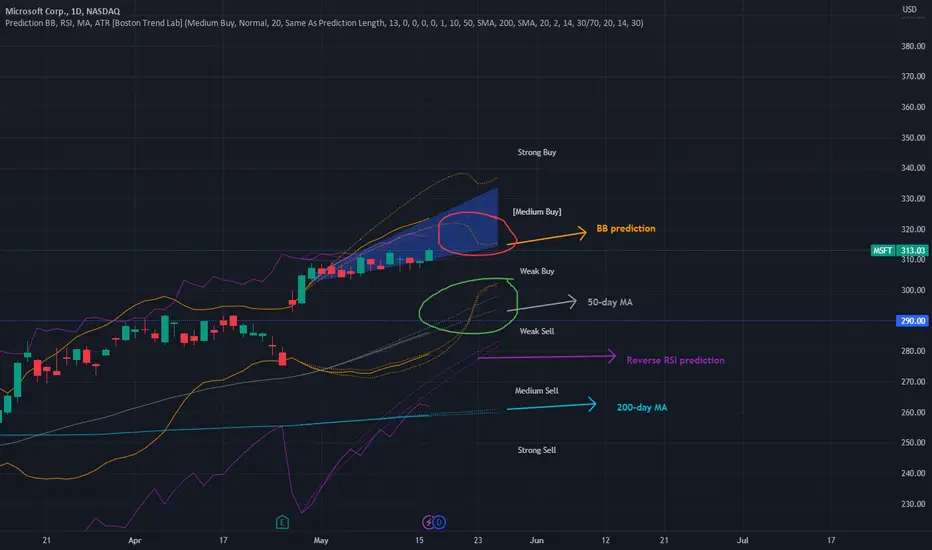
Small fall for growthThe stock's growth has been impressive in recent times; however, the prediction indicates that if the next breakout does not occur by May 19th, the upper band of the 20-day Bollinger Band will decrease, which may hinder sustained attainment of levels above 320. (Red circle)
To facilitate further growth, it would be beneficial to reinforce the resistance level at 290 - 295 at the intersection of the 50-day moving average. (Green circle)
Additionally, the RSI's 70 level limits further growth poten
2nd Pine Script Lesson: Coding the Entry Logic - Bollinger BandWelcome back to our Trading View tutorial series! In this second lesson, be learning how to code the entry logic for a Bollinger Band indicator using Pine Script.
If you're new here and missed the first lesson, we highly recommend starting there as it provides a solid foundation for understanding the concepts we'll be covering today:
In this hands-on lesson, we'll guide you through every step of coding the entry logic for your own Bollinger Band indicator using Pine Script. By the end of thi
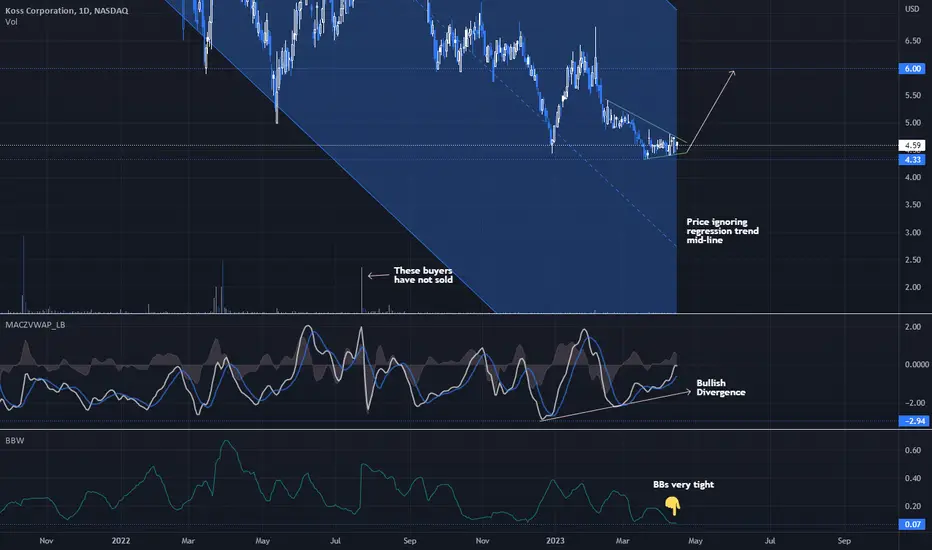
KOSS - ready to moveKOSS daily showing bullish diversion on a number of indicators and is resting on strong historic support levels at the current price. Further the price has been drifting away from the longer term regression trend midline, suggesting a change in direction is occurring.
Per the OBV buyers have generally held onto their shares since the run up that occurred last July. With the Bollinger's getting and staying tight, I expect KOSS will make a move to the upside fairly soon. Trade target is $6.