Short
Short
RUNEUSDT structural reclaim: targeting $0.50The Macro Picture 🗺️
RUNE has executed the full sweep-and-reclaim sequence the broader range demanded — and the chart has now climbed all the way back to the $0.40 trigger level it lost in late May. Every checkpoint of the prior framing fired in order: capitulation wick at $0.30, reclaim of $0.355 from below, base-build above the floor, and now an active test of the battle level that defined the breakdown. RSI has cleared its 50 midline from deep oversold near 22, the kind of momentum reset that historically backs trigger-level reclaims. The bullish destination keeps extending — from $0.45 originally projected to the $0.50 key decision zone, the same structural ceiling that capped May's local highs.
The Setup ⚙️
The Reclaimed Trigger: The $0.40 level is the active battle — broken in late May, swept below twice, and now reclaimed from underneath. A clean daily close above this trigger confirms the reversal and unlocks the runway toward the next major decision zone.
The Momentum Reset: RSI has rotated from a deeply oversold ~22 at the sweep low to the 50 midline, a full reset that historically precedes the second leg of post-capitulation reversals rather than mean-reverting back down.
The Supply Band: The $0.45–0.50 zone is the final resistance band before the broader decision — $0.45 acts as an intermediate magnet, and $0.50 is the key decision zone where the broader range either reclaims or rejects.
The Roadmap: Primary target sits at $0.50 — as indicated by the white projection, the roadmap points toward the structural ceiling once the $0.40 trigger holds as support. Invalidation: a sustained daily close back below $0.355 would invalidate this bullish thesis and confirm the trigger test was a failed reclaim with downside continuation back to the $0.30 sweep low.  Long
Long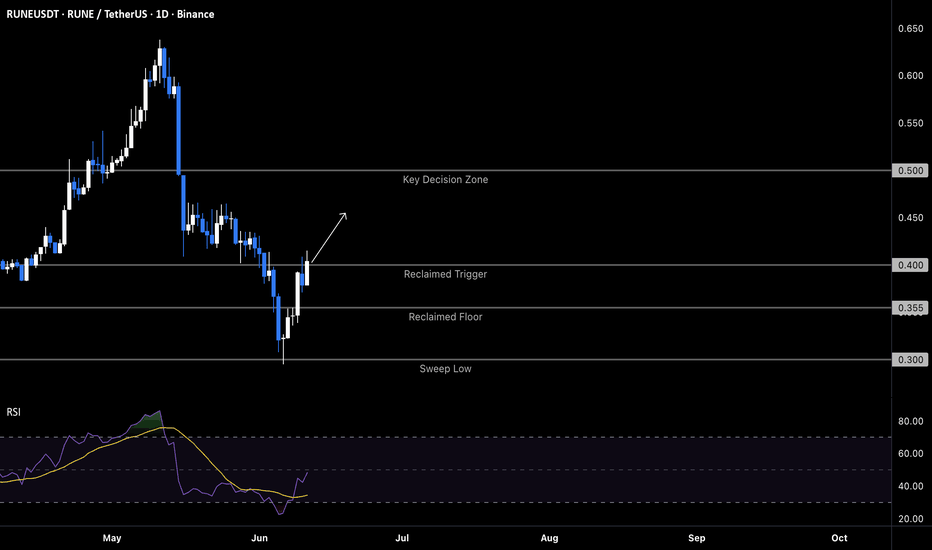
 Long
Long
 Long
Long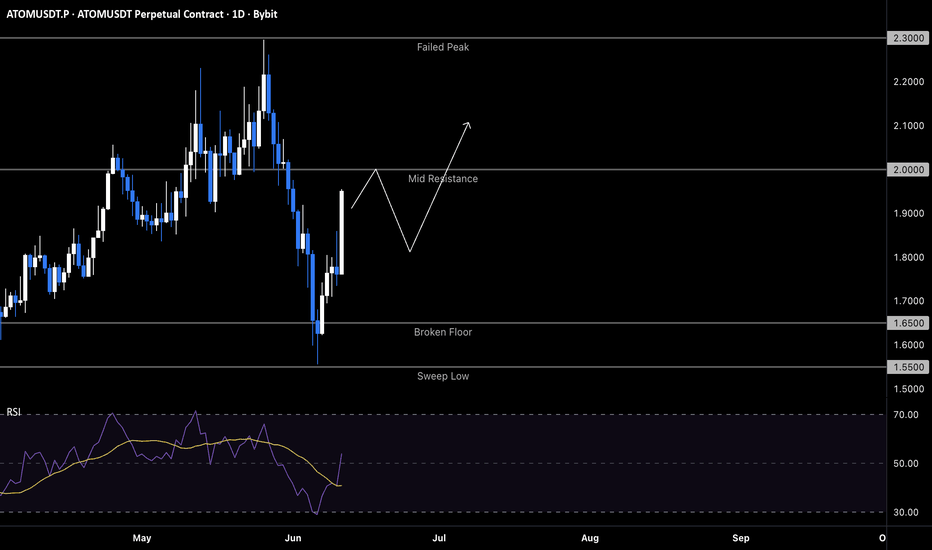
 Long
Long
M&M Bullish Engulfing Candlestick PatternMahindra & Mahindra Swing Setup: Bullish Reversal Pattern Challenges Negative Production Narrative
________________________________________
Mahindra & Mahindra Ltd. (NSE: M&M)
Technical Research Report | Daily Timeframe
Current Price: ₹3,001.00 (+1.64%)
Volume: 3.18 Million Shares
Pattern: Bullish Engulfing
Pattern Reliability: 79.0%
Trend Status: Weakening Downtrend
Setup Classification: Multi-Day Swing Setup
________________________________________
1. Fundamental Disconnect vs. Structural Shift
Mahindra & Mahindra currently presents an interesting divergence between short-term fundamental sentiment and emerging technical behaviour.
Recent reports indicating a 15% decline in June SUV production due to supply-chain labour shortages have naturally introduced near-term concerns regarding operational efficiency and production throughput. From a fundamental perspective, such developments often create uncertainty regarding delivery schedules, inventory planning, and near-term earnings expectations.
However, markets frequently discount information before it becomes visible in reported numbers. As a result, the more important question becomes whether market participants are using the news as a reason to distribute holdings or as an opportunity to accumulate positions at attractive structural levels.
The current chart suggests the latter possibility.
Despite the negative news flow, M&M generated a Bullish Engulfing pattern with a reliability score of 79.0%, while simultaneously attracting 3.18 million shares of volume, reflecting above-average participation and visible buying dominance.
From an institutional market structure perspective, this behaviour is noteworthy because the reversal signal is occurring near the lower boundary of a multi-month trading range.
The market is effectively communicating three important observations:
Negative news has not produced a structural breakdown.
Buyers continue to defend the lower range region.
Price is attempting stabilization despite weakening sentiment.
This creates what technicians often refer to as a fundamental disconnect, where headline news remains negative while price behaviour begins showing signs of stabilization.
The significance of the Bullish Engulfing pattern increases because it appears within a Lower Range Consolidation environment, where downside momentum is already showing signs of exhaustion.
While the broader trend remains technically weak, the current setup suggests that institutional participants may be selectively accumulating exposure while market sentiment remains cautious.
________________________________________
2. Multi-Day Swing Architecture
The current swing framework revolves around the Reference Entry Zone at ₹3,128.15.
This level represents the primary technical decision area for the ongoing recovery attempt.
At present, the stock remains below the reference zone, indicating that the reversal signal has emerged but has not yet transitioned into full confirmation. The objective for bulls is not merely to sustain the Bullish Engulfing pattern but to establish acceptance above the reference area.
Reference Entry Zone
₹3,128.15
A sustained move toward and above this level would signal improving market acceptance and strengthen the probability that the current recovery extends beyond a short-term reaction.
________________________________________
First Objective
Resistance 1 (R1): ₹3,041.93
This represents the nearest supply zone and the first technical hurdle within the recovery process.
________________________________________
Secondary Objective
Resistance 2 (R2): ₹3,082.97
A move through this region would indicate increasing buyer commitment and continued structural repair.
________________________________________
Primary Swing Objective
Resistance 3 (R3): ₹3,153.73
This level carries elevated significance because it sits slightly above the reference framework and would demonstrate that the market is successfully overcoming recent supply pressure.
________________________________________
Macro Structural Objective
Higher Range: ₹3,399.00
The broader technical ceiling remains located near ₹3,399.00.
A successful progression toward this zone would represent a substantial improvement in structure and would effectively signal a transition from recovery into trend restoration.
From a technical perspective, the journey from the current lower-range environment toward ₹3,399 would require multiple layers of confirmation, including improving momentum indicators and sustained participation.
________________________________________
3. Risk Mitigation & Support Grids
Although the Bullish Engulfing pattern provides a constructive signal, risk management remains essential because several momentum indicators continue to show caution.
Current indicator conditions include:
RSI: 43.92 (below neutral equilibrium)
MACD: -46.98 (bearish momentum remains present)
Bollinger Bands: Compression phase (BB Squeeze)
Trend Structure: Weakening Downtrend
Market State: Lower Range Consolidation
These conditions suggest that the market is attempting stabilization but has not yet completed a full trend reversal.
________________________________________
Support Infrastructure
Support 1
₹2,930.13
The nearest support level and the first area expected to attract buyers during any pullback.
Support 2
₹2,859.37
A more significant support zone that would become relevant if the recovery loses momentum.
Support 3
₹2,818.33
The final major structural support visible within the current framework.
Lower Range
₹2,900.40
This level represents the broader accumulation zone currently supporting price.
________________________________________
Technical Invalidation
Stop Loss
₹2,919.25
This level serves as the primary technical invalidation point for the current swing setup.
A decisive breakdown below this level would indicate that the lower-range accumulation thesis is failing and that sellers have regained control of the market structure.
________________________________________
Position Sizing & Risk Profile
The current setup carries a defined risk of:
₹115.10 per share
This is a relatively wide risk parameter and therefore requires disciplined capital allocation.
Professional traders typically adjust position size according to predefined risk exposure rather than increasing exposure based solely on conviction. The wider the stop distance, the smaller the position size required to maintain consistent portfolio risk.
The presence of a Bollinger Band Squeeze adds another layer of importance to risk management.
Compression environments often precede volatility expansion. While the eventual expansion may occur in favour of the reversal pattern, technicians must acknowledge that compressed markets can produce sharp directional moves in either direction.
As a result, maintaining strict adherence to predefined invalidation levels remains critical.
________________________________________
Technical Conclusion
Mahindra & Mahindra currently represents a compelling example of technical behaviour diverging from short-term fundamental sentiment.
While recent production disruptions and labour-related supply constraints have introduced negative headlines, price action has thus far resisted a broader breakdown. Instead, the stock has formed a Bullish Engulfing pattern with 79.0% reliability, supported by 3.18 million shares of volume and visible buying dominance.
The market remains within a weakening downtrend and several momentum indicators continue to require improvement. However, the combination of lower-range stabilization, expanding participation, and Bollinger Band compression suggests that the stock may be entering an important structural inflection phase.
The immediate focus remains on the progression toward the ₹3,128.15 reference zone, while the broader technical framework continues to monitor the pathway through ₹3,041.93, ₹3,082.97, and ₹3,153.73, ultimately extending toward the higher-range ceiling at ₹3,399.00.
Until additional confirmation emerges, the setup should be viewed as a developing recovery attempt supported by improving participation rather than a fully established trend reversal.
________________________________________
Educational Disclaimer
This analysis is provided solely for educational and informational purposes and reflects a technical interpretation of price action, market structure, volume behaviour, and publicly known developments. It does not constitute investment advice, a recommendation, or a solicitation to buy or sell any financial instrument. Market conditions can change rapidly, and technical patterns do not guarantee future outcomes. Investors and traders should conduct their own independent research and consult a SEBI-registered investment advisor before making any investment or trading decisions.
 Long
Long
 Short
Short
ICICIBANK Three White Soldiers - Developing W PatternICICI Bank: High-Volume Reversal Attempt Emerges as Weakening Downtrend Approaches Critical Structural Pivot
Market Context & Structural Shift
ICICI Bank is displaying an increasingly constructive technical profile on the daily timeframe as a weakening downtrend begins transitioning into a potential recovery phase. While the broader trend has not yet fully reversed, recent price action suggests that selling pressure is losing intensity and buyers are gradually regaining control.
The most significant development on the chart is the emergence of a Three White Soldiers reversal pattern accompanied by exceptionally strong participation. The latest session recorded volume of 35.92 million shares, one of the strongest volume expansions observed in recent weeks. From an institutional perspective, volume acts as the validation mechanism behind price movement. Strong bullish candles supported by expanding participation often indicate that buying interest is becoming more committed rather than merely speculative.
The recent advance is particularly noteworthy because it follows a prolonged corrective phase. Instead of continuing lower, the stock established a higher low structure and subsequently attracted increasingly aggressive buying activity. This shift suggests a gradual transition from distribution toward accumulation.
While some market participants may identify a developing W-shaped recovery structure, it is important to note that the pattern remains incomplete. The neckline region has not yet been tested, meaning the current move should be viewed as a recovery attempt within a broader structural repair process rather than a confirmed major breakout.
At present, the technical evidence supports a narrative of improving momentum, strengthening participation, and a weakening downtrend that is approaching an important decision point.
________________________________________
Multi-Day Swing Setup & Execution Framework
The current setup revolves around the Reference Zone at ₹1,333.00, which serves as the primary structural pivot for the ongoing recovery.
With price currently trading at ₹1,317.00, the market remains slightly below this confirmation area. A sustained move toward and above ₹1,333.00 would indicate improving acceptance of higher prices and strengthen the probability of continuation toward overhead resistance levels.
Immediate Structural Hurdle
Reference Zone: ₹1,333.00
This remains the most important level in the near term. Successful acceptance above this zone would confirm that buyers are maintaining control following the recent reversal signal.
Resistance Framework
Resistance 1: ₹1,337.83
The first supply area likely to attract short-term profit-taking activity. Sustained trading above this level would further strengthen the recovery narrative.
Resistance 2: ₹1,358.67
A move into this zone would indicate increasing confidence among market participants and continued trend repair.
Resistance 3: ₹1,384.33
This level carries elevated significance because it aligns closely with the upper boundary of the recent trading structure and represents a major supply region.
Higher Range: ₹1,393.10
The ₹1,384–₹1,393 region represents the most important upside decision zone visible on the chart. This area may effectively function as the neckline region of the developing W-shaped structure. A decisive breakout above this zone would materially strengthen the medium-term technical outlook.
Extended Upside Reference Zones
Upside Reference 1: ₹1,414.70
A move toward this region would indicate that the recovery has evolved into a broader trend continuation phase rather than a simple rebound.
Upside Reference 2: ₹1,496.35
This represents the larger structural upside reference visible on the chart and would only become relevant if momentum remains strong following a successful breakout above the higher range.
________________________________________
Support Infrastructure & Risk Management
Despite the improving technical backdrop, disciplined risk management remains critical because the stock is still operating within a broader recovery framework.
Support Structure
Support 1: ₹1,291.33
This is the nearest support level and serves as the first indication of whether buyers remain committed during any pullback.
Support 2: ₹1,265.67
A decline toward this region would suggest weakening momentum and require closer monitoring of the recovery structure.
Support 3: ₹1,244.83
This level represents the final major support zone before the broader bullish thesis begins to deteriorate.
Lower Range: ₹1,200.50
A move toward this area would indicate a significant breakdown in the current recovery attempt and re-establish broader downside pressure.
Technical Invalidation
Stop Loss: ₹1,251.30
This level serves as the primary technical invalidation point for the current swing framework. A decisive break below this level would suggest that buyers have failed to maintain control following the recent reversal signal.
Risk Assessment
The setup currently carries a defined risk of ₹81.70 per share between the reference zone and the stop-loss level.
Given this risk profile, position sizing should be adjusted appropriately to ensure that portfolio exposure remains aligned with individual risk-management objectives. Strong technical setups may improve probabilities, but preserving capital remains the primary objective of professional market participation.
________________________________________
Technical Conclusion
ICICI Bank is exhibiting multiple signs of technical improvement as a weakening downtrend begins showing characteristics of a potential recovery phase. The emergence of a Three White Soldiers reversal pattern, combined with exceptionally strong volume of 35.92 million shares, provides meaningful evidence that buying participation is increasing.
The key observation is not merely the candlestick formation itself, but the combination of higher lows, expanding volume, improving momentum, and strengthening demand participation. Together, these factors suggest that the stock is undergoing a process of structural repair.
The immediate focus remains on the ₹1,333.00 reference zone. Sustained acceptance above this level would strengthen the bullish case and open the path toward ₹1,337.83, ₹1,358.67, and ultimately the major ₹1,384–₹1,393 decision zone.
While a developing W-shaped recovery structure may be emerging, confirmation would require a decisive breakout above the higher-range resistance area. Until then, the chart should be viewed as a volume-confirmed recovery attempt with improving technical characteristics rather than a completed trend reversal.
________________________________________
Educational Disclaimer
This analysis is provided solely for educational and informational purposes and reflects a technical interpretation of price action, volume behaviour, market structure, and chart patterns. It does not constitute investment advice, a recommendation, or an offer to buy or sell any financial instrument. All market participants should conduct their own independent research and consult a SEBI-registered investment advisor before making any investment or trading decisions.
 Long
Long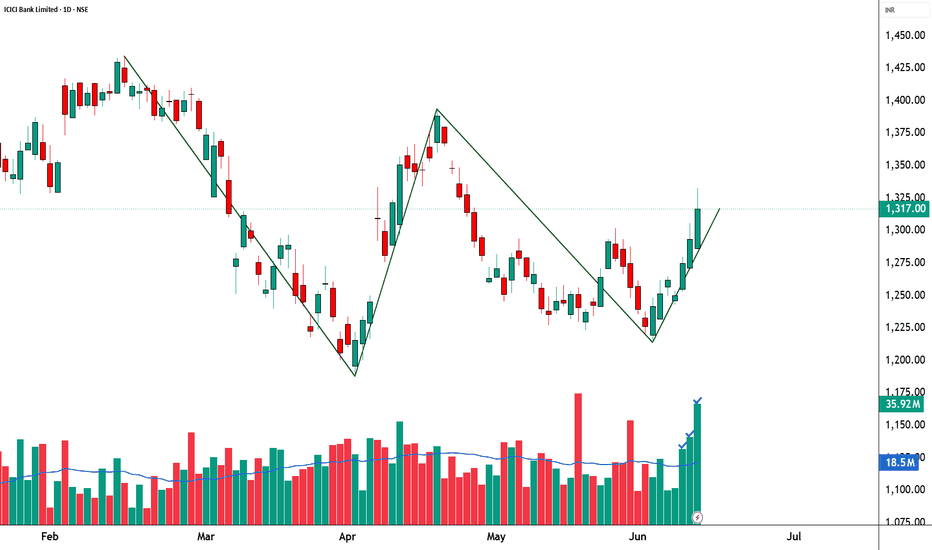
 Long
Long
 Short
Short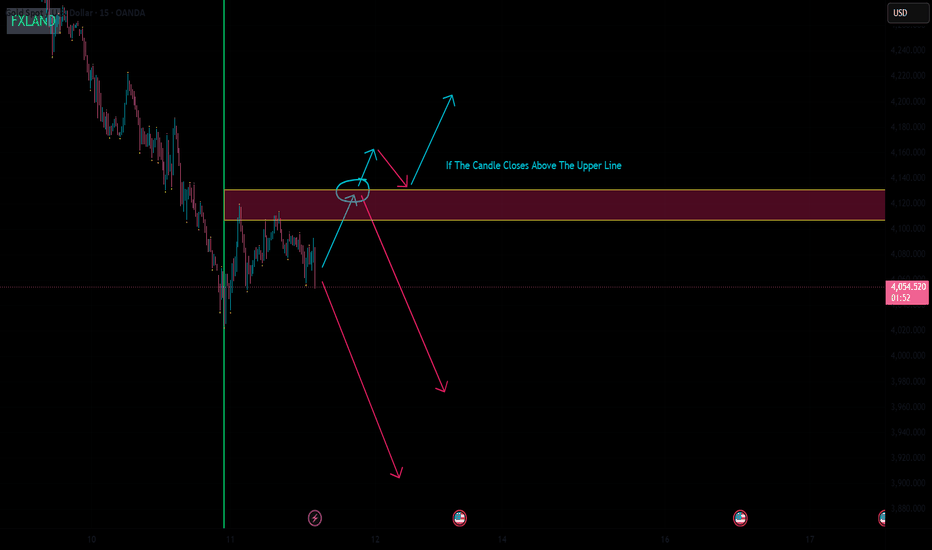
 Short
Short
Short 
Long 
Long 
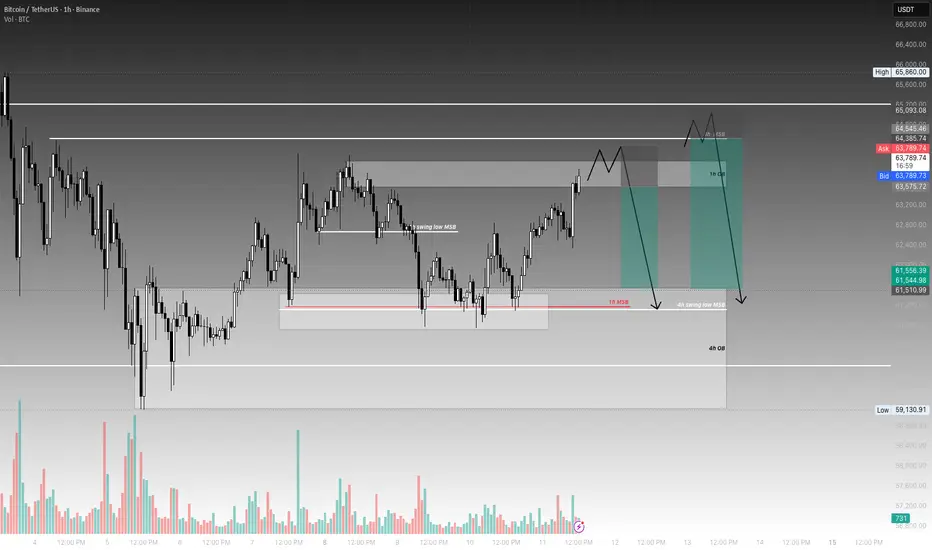
BTC may have found its floor, explosive upside ahead!BTC has recently tested the support zone of 60,000-58,000 again. Clearly, the region still provides strong support in the short term and has withstood the test.
From the current chart pattern, although BTC still appears weak, it has been able to rebound immediately after testing the 59,000 level multiple times, and the candlestick chart shows multiple lines with long lower shadows, establishing the support role and status of this area. Moreover, the lows of BTC's pullbacks are gradually rising, and it is gradually shifting from a clear downtrend to a sideways trend. It is possible that BTC will strengthen again after consolidating and bottoming out in this area.
Moreover, from a cyclical perspective, BTC has stabilized earlier than gold and is now consolidating sideways, which may attract more funds and drive BTC to gradually strengthen, retesting the 64,000-66,000 range. Moreover, the 60,000-59,000 range serves as a key low point and starting point for the previous upward trend, making it a worthwhile base for us to try buying BTC.
Short-term technical support level: 60000-59000
Short-term technical resistance level: 64000-66000
Therefore, in terms of short-term trading, since BTC shows signs of gradual stabilization, it may be worth considering placing long positions in the 62000-60000 range before the price rises. Long 
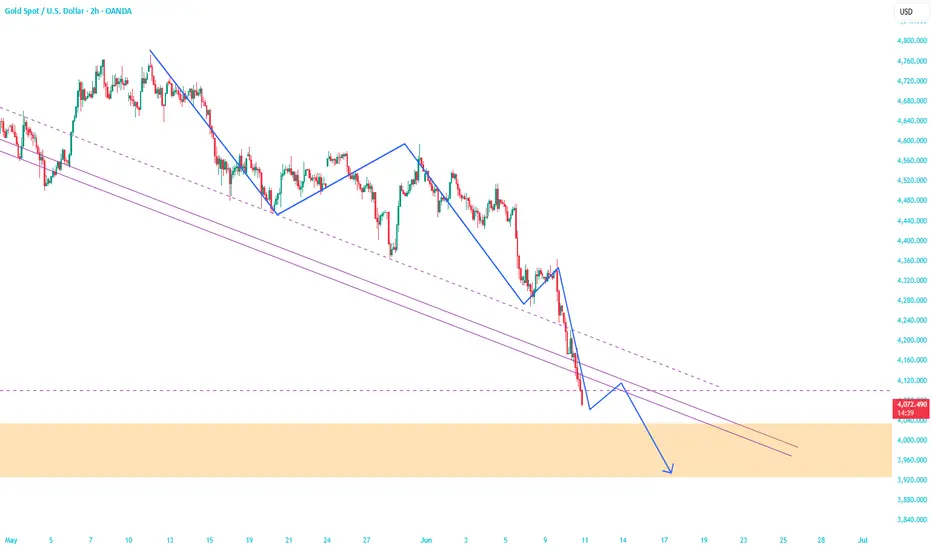
The breakdown is confirmed: Sell every bounce!Gold has decisively broken through the previous structural low of 4099, laying the foundation for a strong downtrend. The one-sided downtrend has been confirmed, and there is currently no resistance to stop the release of bearish sentiment. After gold broke below the previous structural low of 4099, the bearish momentum remains strong, and it will continue to be under pressure in the short term. Moreover, there are no clear signs of a bottom yet, and based on the current trend, gold may continue to move towards the 3900-3800 range.
As gold continues to fall, the current short-term resistance has shifted to the 4120-4140 area, followed by the 4190-4210 area. There is no obvious support below, and given the current downward momentum, it is unlikely that the bulls will be able to mount an effective counterattack in the short term. Moreover, with the spread of market panic, there may be even more room for further decline.
Short-term technical support level: 4000-
Short-term technical resistance levels: 4120-4140 / 4190-4210
Therefore, in short-term trading, if gold can rebound to the 4115-4135 area, I will first consider shorting gold. Short 
 Long
Long
INJ post-parabolic unwind: targeting $4.50The Macro Picture 🗺️
The parabolic expansion from $5.40 to $7.40 across late May and early June has been fully retraced in under two weeks — a textbook structural exhaustion where the same liquidity that fueled the vertical move is now being hunted from above on the way down. Every bullish reference has failed in sequence: the $7.00 round number lost as support, the $6.50 prior structural shelf gone, the $6.00 macro flip surrendered, and the ascending trendline from February's $2.65 floor cleanly broken. Price is now testing the $5.00 critical floor — the same launchpad that originally fired the May rally, now positioned as the last meaningful defensive line. RSI has rolled out of the bullish regime and is curling toward the mid-40s with no divergence support, confirming the momentum shift.
The Setup ⚙️
The Distribution: The $7.40 print marked clean structural exhaustion, and the cascading lower highs through $6.00 and $5.50 have built an overhead supply shelf where bears are now defending every bounce attempt with conviction.
The Floor: The $5.00 zone is the high-confluence decision band where the May launchpad, the round-number psychological anchor, and the post-breakout structure all stack — bulls desperately need to defend it to keep any bullish read alive.
The Trigger: A sustained daily close below $5.00 would confirm the structural failure and activate the path of least resistance toward $4.50, where the April–May equilibrium pocket sits as the next liquidity magnet.
The Roadmap: Primary target sits at $4.50 — once $5.00 gives way, the white projection points through the dead-air pocket between $5.00 and $4.50 toward the prior equilibrium shelf where structural buyers last reloaded. Invalidation: a clean daily close back above $5.50 would invalidate this bearish thesis and reopen the upper-boundary retest toward $6.00. XLM: liquidity sweep before bearish moveThe Macro Picture 🗺️
XLM spent five months locked inside a rectangle between $0.1450 macro support and the $0.1800 range top — exactly the kind of compressed structure that becomes a playground for liquidity hunts. The early-June vertical impulse to $0.2980 swept every stop resting above the range, tagged the local high, and snapped straight back: a textbook hunt, not a trend. Price has now retraced the entire leg and sits back on the former range top, with RSI cooling from overbought 80+ territory toward the midline.
The Setup ⚙️
The Rejection: The sweep candle wicked to $0.2980 but daily bodies failed to hold above $0.2550 macro resistance. Sellers absorbed the entire breakout within days — large players used the spike to unload into late buyers.
The Support Flip: Bulls now need to flip $0.1800 — the five-month range ceiling and key decision zone — into support. The reaction so far is hesitant: shallow bounces, no impulse, the path of least resistance pointing down.
The Trigger: A clean daily close below $0.1800 confirms the failed flip and triggers the sell stops parked under the breakout base. That is the moment the white projection on the chart activates — chop first, then resolution lower.
The Roadmap: Primary target sits at the body of the former range near $0.165, as indicated by the white projection — once price is back inside the rectangle, the structure that contained it for five months becomes the magnet again, with $0.1450 macro support as the deeper draw. Invalidation: a sustained 1D close above $0.2200 would invalidate this bearish thesis and signal that the breakout leg is being reclaimed rather than distributed.  Short
Short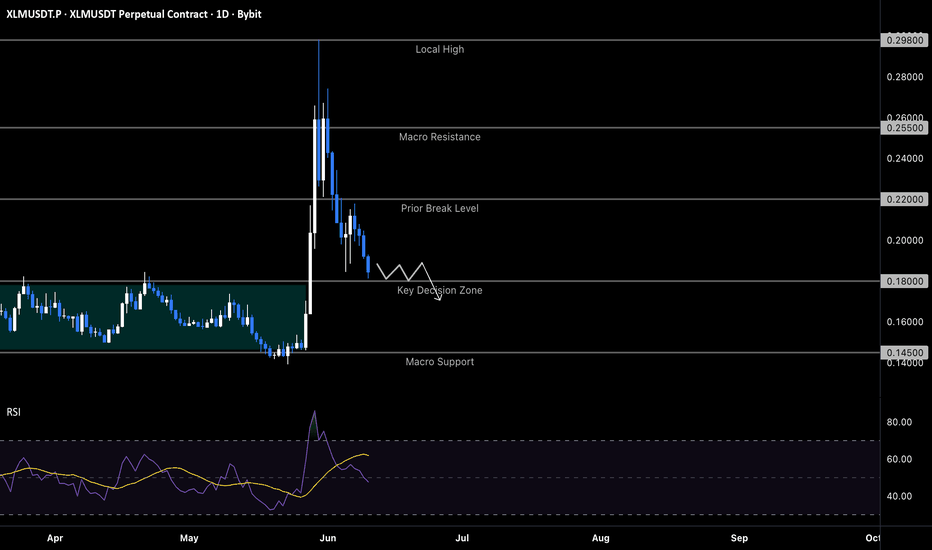
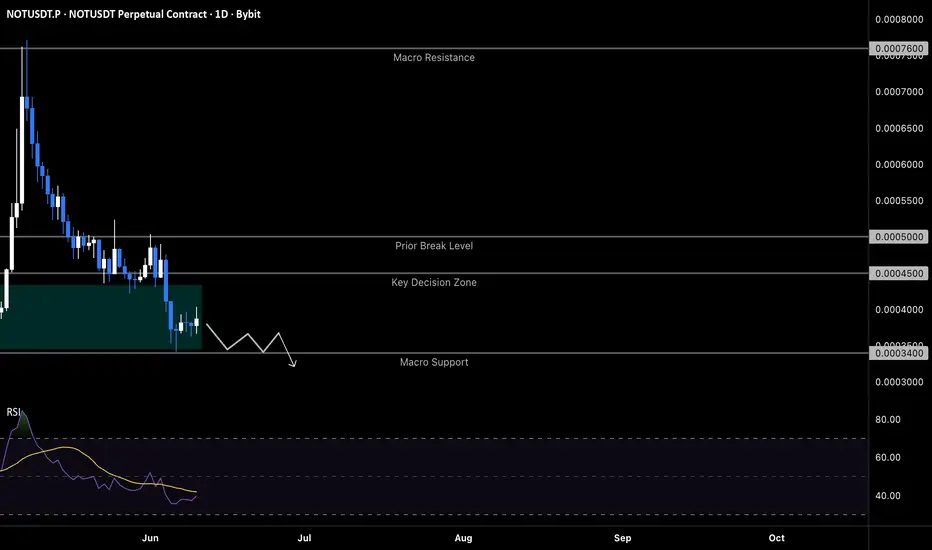
NOT at macro floor: breakdown toward $0.000300The Macro Picture 🗺️
The May vertical rally into $0.000760 has been fully unwound — a textbook structural reset. That spike was a liquidity hunt above the range highs, not a trend change: price tagged the macro ceiling, cleared out breakout buyers, and returned the entire move within five weeks. NOT is now back at the lower boundary of the multi-month accumulation box between $0.000340 and $0.000435, and the macro floor at $0.000340 desperately needs to be tested again. Each revisit — late March, early April, early June — has absorbed fewer bids.
The Setup ⚙️
The Support Flip: The descent from $0.000500 turned the Prior Break Level into active resistance, and the Key Decision Zone at $0.000450 capped every recovery attempt since. Bears are defending each lower high with consistency.
The Floor: The price box sitting at $0.000340 marks the macro floor — swept once already in early June. Stops from three separate floor tests now cluster directly beneath it, forming a clean liquidity pocket that large players have every incentive to tap.
The Accumulation Zone: A deeper flush toward $0.000300 opens a textbook pocket for staggered, averaging-based entries — the kind of zone where patient capital absorbs panic exits.
The Roadmap: Primary target sits at $0.000300 — the path of least resistance runs through the floor sweep, as indicated by the white projection: choppy distribution first, then the flush that clears over-leveraged longs. Invalidation: a sustained 1D close above $0.000450 would invalidate this bearish thesis and put the $0.000500 Prior Break Level back in play.  Short
Short