XAU/USD 45min Swing Trading PlanXAU/USD 45min Swing Trading Plan
Basic Trading Information
• Trading Asset: XAU/USD (Gold vs US Dollar)
• Trading Timeframe: 45 Minutes Swing Trade
• Trade Direction: Long
• Risk-Reward Ratio: 1 : 15.41
Core Trading Parameters
• Entry Price: Around 4271.485
• Stop Loss: 4262.000
Tiered Take-Profit & Risk Management Rules
1. First Target Level: Around 4312.000
Close 50% of the position once price reaches this level. Trail stop loss to break-even to eliminate trade risk.
2. Second Targe
Candlestick Analysis
NVDA FOLLOW-UPMy first idea was for NVDA to move lower toward the $210 area, but price invalidated that path and pushed higher instead.
Now the structure has changed again.
NVDA is currently trading between the external liquidity levels I’ve marked:
( )
🔼 ELH — External Liquidity High: around $241
🔽 ELL — External Liquidity Low: around $189
Price has already reclaimed the liquidity around the $220–$223 area and is now sitting in the middle of that larger range.
The immediate level I’m watching is the
KIE a fascinating VPA setup. I wanted to start with something a little different here, an illustration and a cracking example of VPA in action.
Normally when I see explosive moves like this I find it very hard to get involved, because you can get whipsawed out of a position very quickly. But it’s a great example of why Volume Price Analysis matters.
What we have is an anomaly in price versus volume over the last three trading sessions.
Wednesday16th: Price move 11.49% - Volume traded 6.34m
Thursday 17th: Price move 4.46
GBPCAD SHORTMarket structure bearish on HTFs 3
Entry at both Weekly and Daily AOi
Weekly Rejection at AOi
Previous Weekly Structure Point
Daily Rejection at AOi
Previous Daily Structure Point
Daily EMA retest
Around Psychological Level 1.87500
H4 Candlestick rejection
Rejection from Previous structure
REMEMBER : Trading is a Game Of Probability
: Manage Your Risk
: Be Patient
: Every Moment Is Unique
: Rinse, Wash, Repeat!
: Christ is King
TP: WHO KNOWS!
Entry 120%
NZDCHF SHORTsMarket structure bearish on HTFs DH
Entry at Daily AOi
Weekly rejection at AOi
Daily Rejection at AOi
Daily EMA retest
Previous Structure point Daily
Touching EMA H4
H4 Candlestick rejection
Rejection from Previous structure
TP: WHO KNOWS!
Entry 90%
REMEMBER : Trading is a Game Of Probability
: Manage Your Risk
: Be Patient
: Every Moment Is Unique
: Rinse, Wash, Repeat!
: Christ is King
BTC/USD | Bitcoin Holds Strong Above $82.3K, Is $90K Next?By analyzing the #Bitcoin chart on the weekly timeframe, we can see that after the previous analysis, BTC continued higher and reached $87,460 before entering a minor correction. Bitcoin is currently trading around $84,600 .
As long as price manages to stabilize above $82,300 , I expect the broader bullish move to continue, with $90,000 as the next major target.
If you've been following these Bitcoin updates and found them useful, give this analysis a Boost to support my work . 🙌
The k
2 Hour USD/JPY Swing Trading Plan2 Hour USD/JPY Swing Trading Plan
Basic Trading Information
• Trading Asset: USD/JPY
• Trading Timeframe: 2-Hour Chart
• Trading Direction: Short
• Risk-Reward Ratio: 1:10.55
Core Trading Parameters
• Entry Price: Around 158.018
• Stop Loss Price: 158.200
Hierarchical Take-Profit & Stop-Loss Protection Strategy
1. First Target Level: 156.260
Close 50% of the position upon hitting the first target. Move stop loss to break-even to lock in profits and eliminate trade risk.
2. Second Targ
USD/CHF: Intraday Bullish SignalThe 📈USD/CHF pair shows significant bullish momentum following a retest of the recently breached daily/intraday structural resistance.
I see a confirmed bullish change of character on a 4H timeframe.
This indicates a high probability of continued bullish movement.
The next target is 0.8253.
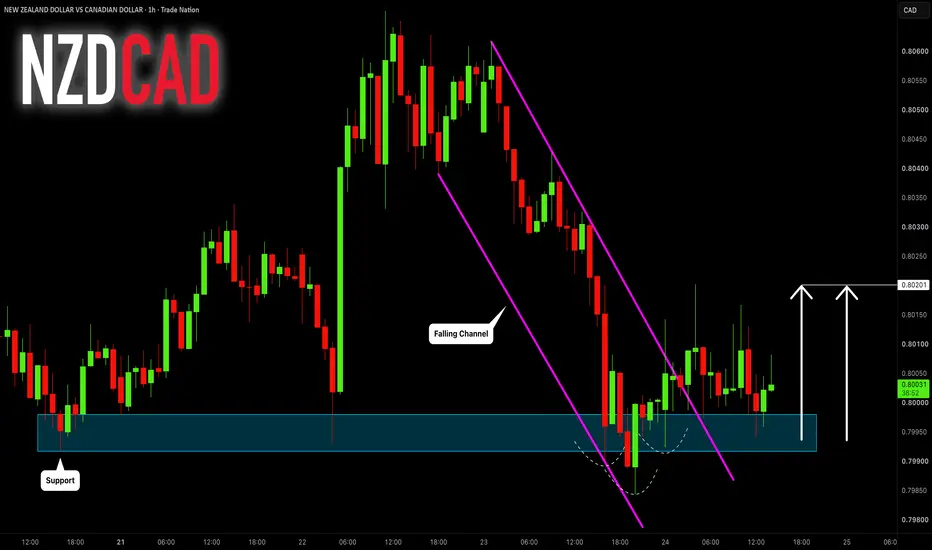
NZDCAD: Pullback From Support 🇳🇿🇨🇦
NZDCAD will likely pull back from a strong intraday support.
As confirmation, I see 2 bullish price action patterns:
an inverted head and shoulders and a falling wedge.
Goal - 0.802
❤️Please, support my work with like, thank you!❤️
I am part of Trade Nation's Influencer program and receive a monthly fee for using their TradingView charts in my analysis.
BTCUSDT: Liquidity Sweep Sets Up a Potential Push to $89K?Hook:
BINANCE:BTCUSDT.P swept the recent lows into the 83,100–83,500 support zone and quickly recovered — now the key question is whether this liquidity grab can fuel a move toward 87,000 and eventually 89,000. 🔥
Market Context:
BTC is trading on the 1H chart after a sharp rejection from the 87K area. The sell-off pushed price beneath the recent local lows and into the marked support zone, where buyers immediately responded.
Above current price, two major resistance areas remain visibl
USDJPY: Bullish Continuation 🇺🇸🇯🇵
As I predicted earlier, USDJPY keeps rising.
I see another strong bullish confirmation after a valid breakout of a key horizontal resistance.
The price formed a double-bottom pattern, retesting that.
We see a strong buying imbalance now.
I expect a rise to 158.6
❤️Please, support my work with like, thank you!❤️
I am part of Trade Nation's Influencer program and receive a monthly fee for using their TradingView charts in my analysis.
SVS sellers distributing into the recent run?Savills has been on a lovely run since summer. It’s a global real estate advisory business, transactions, valuations, capital markets, so earnings lean more on deal volumes than on steady rental income, worth bearing that in mind given how sensitive it’s been to transaction activity in the past.
Price action shows clear exhaustion as it’s approached a previous level, sellers distributing into the move. The last three sessions are the real story though, big volume three days running, yet price h
NQ Power Range Report with FIB Ext - 9/24/2026 SessionCME_MINI:NQZ2026
- PR High: 30813.00
- PR Low: 30778.00
- NZ Spread: 78.5
Key scheduled economic events:
08:30 | Initial Jobless Claims
10:00 | New Home Sales
Session Open Stats (As of 1:15 AM)
- Session Open ATR: 445.70
- Volume: 42K
- Open Int: 275K
- Trend Grade: Neutral
- From BA ATH: -2.2% (Rounded)
Key Levels (Rounded - Think of these as ranges)
- Long: 32282
- Mid: 29785
- Short: 27288
Keep in mind this is not speculation or a prediction. Only a report of the Power Range with F
30 Minute XAG/USD Trading Plan30 Minute XAG/USD Trading Plan
Basic Trading Information
• Trading Asset: XAG/USD (Silver)
• Trading Timeframe: 30-Minute Chart
• Trading Direction: Long
• Risk-Reward Ratio: 1:7.76
Core Trading Parameters
• Entry Price: Around 64.000
• Stop Loss Price: 63.500
Hierarchical Take-Profit & Stop-Loss Protection Strategy
1. First Target Level: 65.500
Half of the position will be closed when price reaches the first target. Move stop loss to break-even to lock in profits and remove risk on th
GBPJPY 120M: What Happens When Price Revisits These Zones?Market Context
On the GBPJPY 120-minute timeframe, both a Demand Zone and a Supply Zone are being observed as important areas of market structure.
The Demand Zone originated from a Rally-Base-Rally (RBR) structure, where a quality basing phase was followed by a strong bullish leg-out.
The Supply Zone developed through a Drop-Base-Drop (DBD) structure, where a period of consolidation was followed by a strong bearish leg-out.
Why Are These Zones Technically Significant?
Both zones
30 Minute XAU/USD Trading Plan30 Minute XAU/USD Trading Plan
Basic Trading Information
• Trading Asset: XAU/USD (Gold)
• Trading Timeframe: 30-Minute Chart
• Trading Direction: Long
• Risk-Reward Ratio: 1:9.14
Core Trading Parameters
• Entry Price: Around 4284.765
• Stop Loss Price: 4271.000
Hierarchical Take-Profit & Stop-Loss Protection Strategy
1. First Target Level: 4322.500
Half of the position will be closed when price reaches the first target. Move stop loss to break-even to lock in profits and remove risk o
1 Hour COMEX Silver (SI1!) Futures Trading Plan1 Hour COMEX Silver (SI1!) Futures Trading Plan
Basic Trading Information
• Trading Asset: COMEX Silver Futures (SI1!)
• Trading Timeframe: 1-Hour Chart
• Trading Direction: Long
• Risk-Reward Ratio: 1:8.15
Core Trading Parameters
• Entry Price: Around 64.745
• Stop Loss Price: 64.440
Hierarchical Take-Profit & Stop-Loss Protection Strategy
1. First Target Level: 65.950
Half of the position will be closed when price reaches the first target. Move stop loss to break-even to lock in prof
30 Minute XAU/USD Trading Plan30 Minute XAU/USD Trading Plan
Basic Trading Information
• Trading Asset: XAU/USD (Gold)
• Trading Timeframe: 30-Minute Chart
• Trading Direction: Long
• Risk-Reward Ratio: 1:10.56
Core Trading Parameters
• Entry Price: Around 4293.665
• Stop Loss Price: 4293.000
Hierarchical Take-Profit & Stop-Loss Protection Strategy
1. First Target Level: 4330.500
Half of the position will be closed when price reaches the first target. Move stop loss to break-even to lock in profits and remove risk
45 Minute BTC/USDT Trading Plan45 Minute BTC/USDT Trading Plan
Basic Trading Information
• Trading Asset: BTC/USDT
• Trading Timeframe: 45-Minute Chart
• Trading Direction: Long
• Risk-Reward Ratio: 1:7.13
Core Trading Parameters
• Entry Price: Around 84252.00
• Stop Loss Price: 83710.76
Hierarchical Take-Profit & Stop-Loss Protection Strategy
1. First Target Level: 85761.00
Half of the position will be closed when price reaches the first target. Move stop loss to break-even to lock in profits and remove risk on the