Learn more about Indicators using the Help CenterThe Help Center is a great resource that offers a lot of information for users on all kinds of topics.
Within the Help Center is the “I’d like to learn more about indicators” page which holds a vast amount of information about built-in indicators that are offered on TradingView.
You can access the information on these indicators by following the directions above or by visiting this link:
www.tradingview.com
It is important to note that user created indicator’s and scripts are not featured
Commodity Channel Index (CCI)
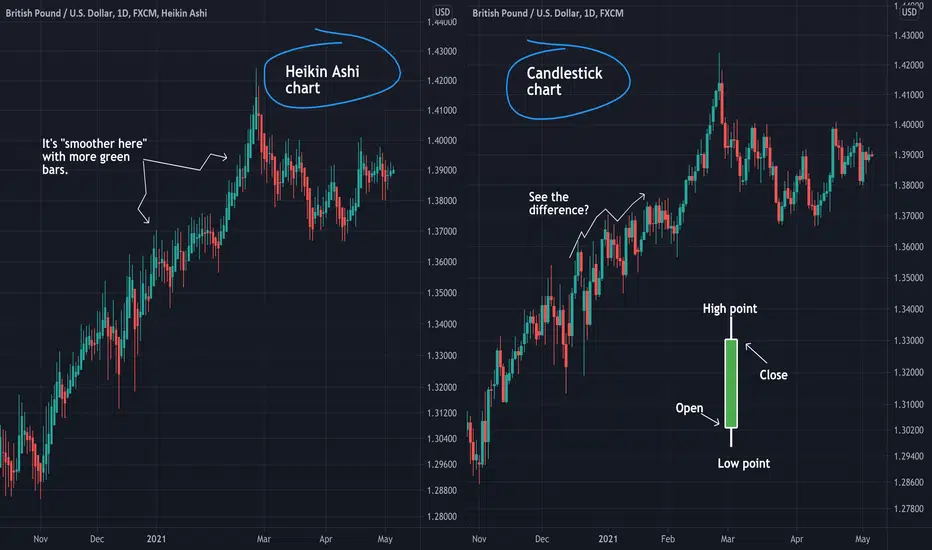
Heikin Ashi Charts vs. Candlestick ChartsFollowing price action is at the core of markets. One glance at a chart can show you a trend, trade idea, or serve as a quick way to check the holdings in your portfolio.
Candlestick charts are one of the most popular ways to look at price action. A single candlestick shows the high, low, open, and close for a specific time period. This means that a lot of price information is stored in a single candlestick . However, sometimes, that price information is filled with volatility or chaotic tradi
Ripple, XRP, SEC and the FUD of the century - My final idea.
SEC's price suppression on XRP is coming to an end as it is rumoured that SEC employees and whales have already bought as much as they could at low prices.
Earlier this year the defence case for the San Francisco firm had looked dead in the water with maximum FUD, haters clapped and weak hands sold, according to crypto observers.
The SEC file its lawsuit a few days before Christmas 2020, claiming its founders were selling it's product, imagine that? a company selling products is something un
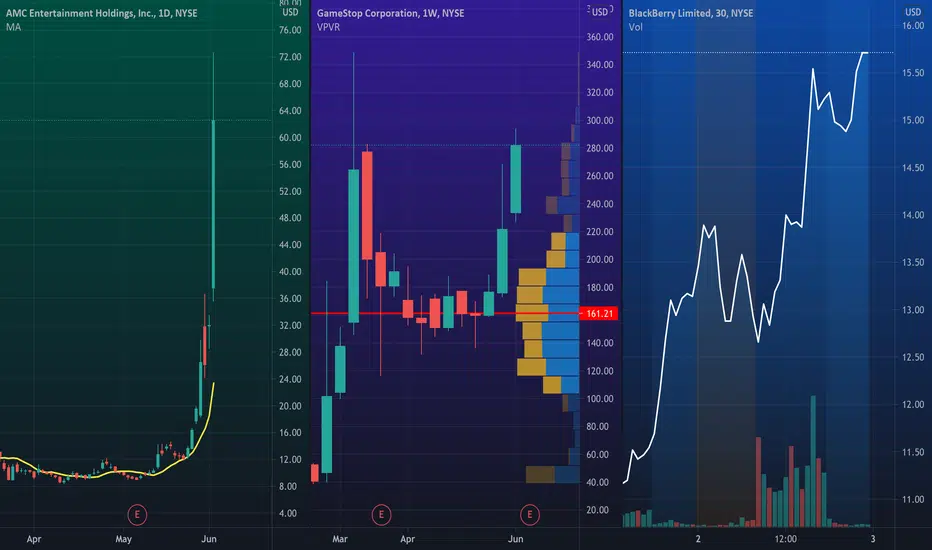
Five Ways To Use The Multiple Chart LayoutOur multiple chart layout tool gives traders and investors an easy way to study multiple symbols or timeframes at once. In this post, we'll explain five ways to use the multiple chart layout feature to optimize your process.
Chart different timeframes
If you look closely at the charts above, you will notice that there are different timeframes for each chart. One is a daily chart, one is a weekly chart, and another is a 30-minute. The multiple chart layout makes it possible to see these differ
EURCAD H4 Short 13CCI tlbBoth Daily and H4 13CCI have a short signal from trendline break on CCI. Can this overcome a wedge on weekly chart? If so, first target may be the H&S target, and if no bounce there, there is a lot of open space below for a few hundred pips.
Long signal will be when a down trendline on CCI is broken to upside
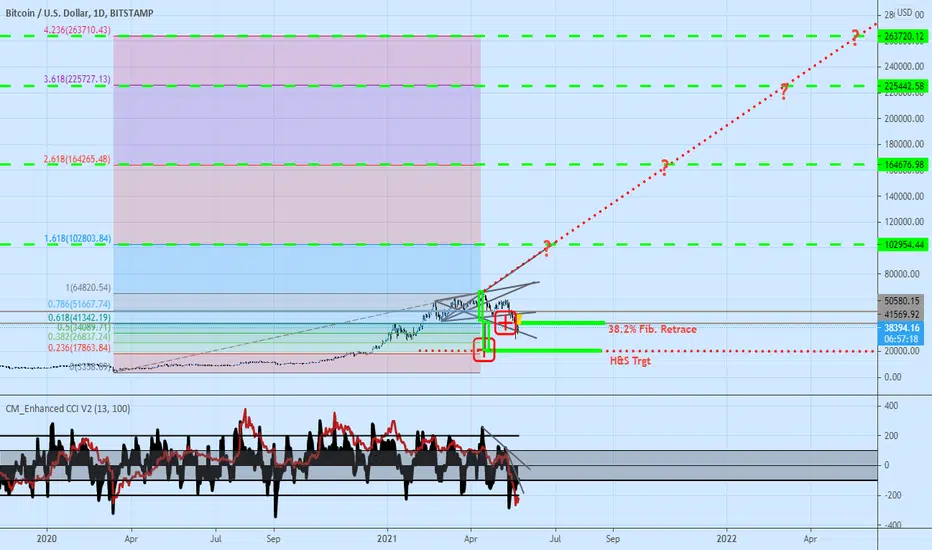
BTCUSD Daily Fib extensions. CCI tlb. Getting ahead of myselfHead and Shoulders target marked on chart is below the fib retracement tagged last week. 13 CCI is turning up but it may be temporary. For a real upmove, After any divergence, normally we need a retest of low, then a move of 13 CCI above -100. However, should we get a lower new low, we have to start over looking for Longsm looking first for divergence in next price/time cycle, then a retet of low, then a crossing of 13 CCI up through -100. Or, for an easier but solid Long signal, When I see
How to Draw Fibonacci Channels
Fibonacci Channels are used to determine fibonacci support and resistance levels within an identified trend.
These channels can easily be drawn in both uptrends or downtrends to find potential areas where price action could change.
Uptrend
When drawing a Fibonacci Channel on an uptrend, a clearly identified trend needs to be established with higher lows being created.
To draw the channel, first select the two low points on the trend, and then the high point in-between them.
After the
BLong
Introducing The Satoshi All Time History IndexStarting today you can chart, follow, and research the price of Satoshis going back to 2010. Our new index is called Satoshi All Time History Index.
Satoshis, or sats, are the smallest unit of bitcoin (BTC). 100,000,000 satoshis make up one Bitcoin.
Satoshis are particularly important to the Bitcoin community because transaction fees are often measured as satoshis per byte or satoshis/byte. This makes the unit important to chart, follow, and analyze in detail. In addition, some people see sa
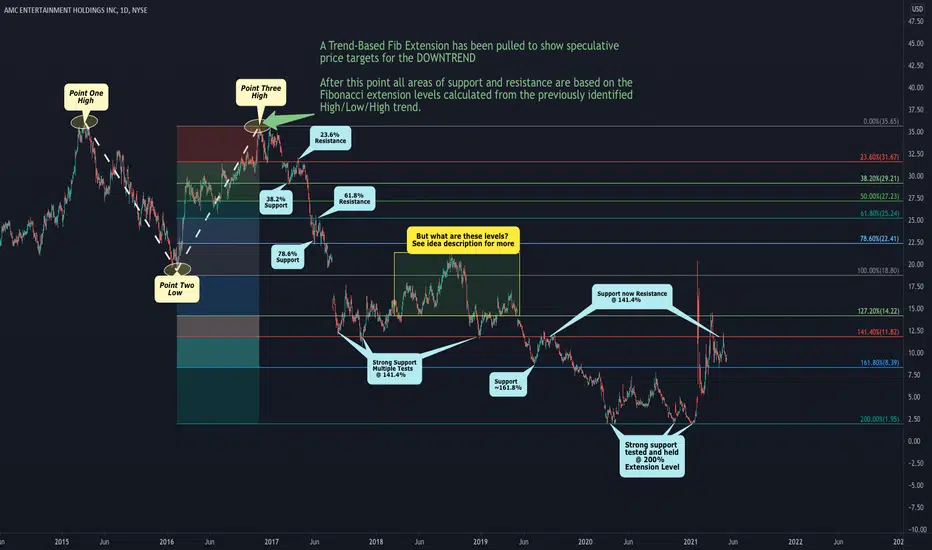
Using the Trend-Based Fib Extension ToolThe Fibonacci ratios are widely used among traders to help identify potential areas of reversal in the movement of price action.
The Trend-based Fibonacci Extension tool utilizes three points on a previously identified trend in order to draw the Fib ratios on the chart.
In the chart above, price was rejected twice at the ~$35.50 level, forming a double top which is a fairly strong reversal pattern. To help identify potential areas of support and resistance we have drawn a Trend-Based Fib Exte
Heikin Ashi Charts vs. Candlestick ChartsFollowing price action is at the core of markets. One glance at a chart can show you a trend, trade idea, or serve as a quick way to check the holdings in your portfolio.
Candlestick charts are one of the most popular ways to look at price action. A single candlestick shows the high, low, open, and close for a specific time period. This means that a lot of price information is stored in a single candlestick. However, sometimes, that price information is filled with volatility or chaotic trading
$ATOS entry PTs 2.30 Target PTs 4.75-5.50-7 and higherPivoting off Support and up-trending towards Resistance, time sequence within Wave analysis
Atossa Therapeutics, Inc., a clinical-stage biopharmaceutical company, discovers and develops medicines in the areas of oncology and infectious diseases. The company's lead program is Endoxifen, an active metabolite of tamoxifen, which is in Phase II clinical trials to treat and prevent breast cancer. It is also developing AT-301, a proprietary drug candidate for nasal administration in patients diagnose
Using Linear Regression ChannelsLinear Regression Channels are a great way to identify potential key levels of future price action by graphing the normal distribution of a trend.
When using the Regression Trend tool (located in the drawing panel under the “Trend Line Tools” group) two points on a trend are chosen, generally at the beginning of the trend and the end of the trend.
When the two points on the chart are chosen, the normal distribution of the dataset is calculated between the two chosen points and displayed in
How To Add Emojis To Your ChartIf you publish a lot of research from your TradingView account, emojis will give readers another way to engage with your work. Emojis are recognized globally and can help others better understand how you're thinking or feeling. They can also be used as quick reminders or notes.
Here's how you can add emojis to your chart:
1. Copy and paste an emoji directly into the text box tool like this 👋. If you need help finding an emoji to copy and paste, there are several websites that make this easy
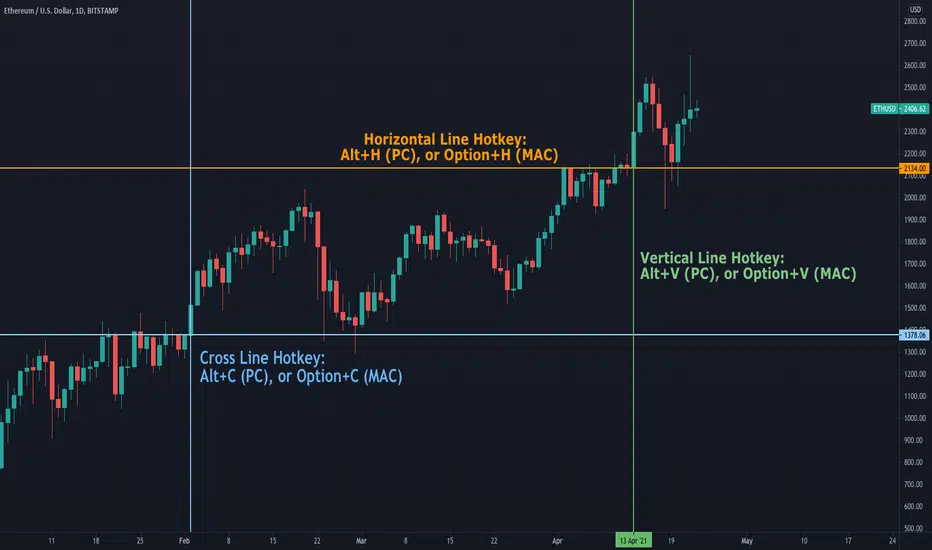
Creating Lines with ShortcutsCreating lines on a chart is one of the most fundamental methods of charting when performing technical analysis. Being able to create these effectively and quickly is a very useful skill to have.
Horizontal, Vertical and Cross lines can all be found on the drawings panel to the left of the chart in the subgroup “Trend Line Tools”. These tools can be added by selecting them from the subgroup and then placing them on the chart.
However, a more efficient method to creating these lines is to utili
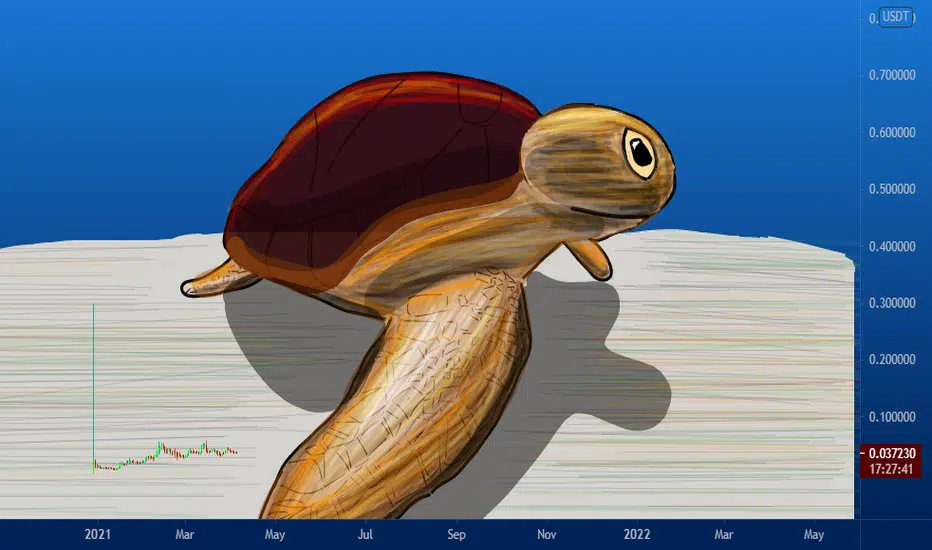
Be smart: think and act like a Reef Turtle.In the world of trading, you must always think like a reef turtle.
Reef turtles are an animal that acts wisely, with great patience, prudence, they wait for their moment, and they do not lose their heads.
They always trust what they do, have some of the best moods in the animal kingdom, and never panic at anything.
They have a hard shell, both physically and mentally; They are not influenced by stupid things that happen on the outside, and they are not intimidated by anyone.
They are a very
RLong
"Aw, 20 Dollars? I Wanted A Peanut!"Market Psychology simplified
Carrying on the Simsons theme - In the last couple of months, I have written several educational posts & have been lucky enough to see some being selected as "editor picks" After writing some more serious ones, I wanted to write some other posts to have a laugh.
I had some great comments, replies, and requests on the back of the first Bart one. Actually enjoyed the art side of it more than I expected.
Back in February, I posted a post about market psychology.
Do you agree with Drake's opinion?⚡️Every trader gets tired of constantly analyzing charts.
For you to relax, we will periodically release relaxation for your brain in our new rubric #Tradingmemes
So what do you prefer more?
Are you Producer or Consumer?
Work for it now
It will pay of later
_____________________________________________________
If you enjoy my FREE Technical Analysis , support the idea with a big LIKE👍
Feel free to leave comments✉️
And always remember: "we don't predict, we react".