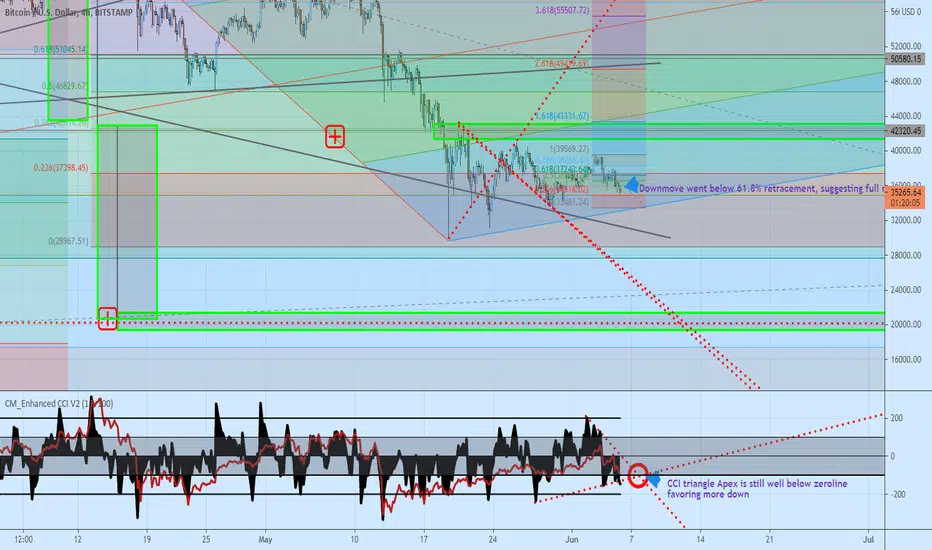
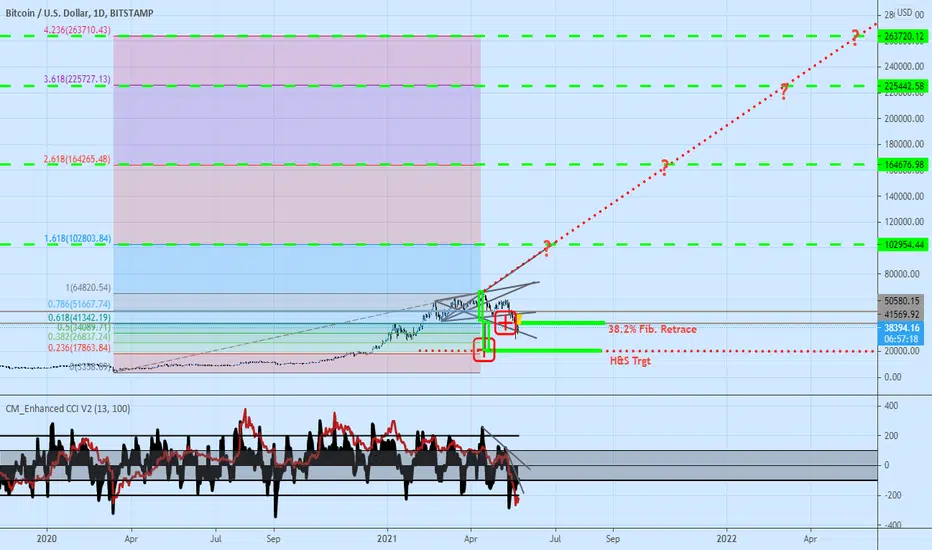
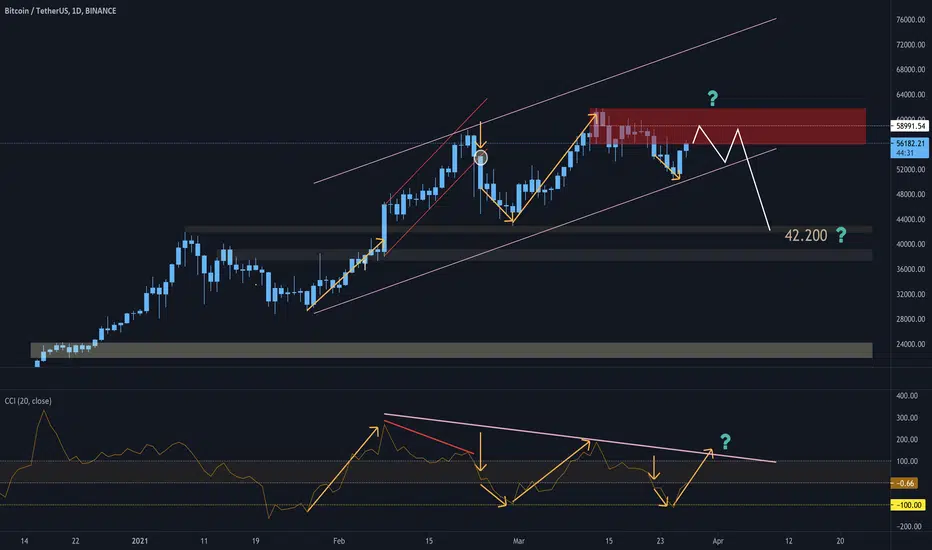
BTCUSD Long 7/20 13CCI tlb BUT no diver yetI hate late posts. Lost hard drive. y/d Jul 20, BTCUSD 4 hr and Daily had 13CCI trendline break signals Long. Fine to have taken those. However, my answer to whether the low is in yet requires
1) first, a divergence of 13 CCI in next price cycle (we don't yet have that)
2) retest of price low (we have that, but need to have it follow the CCI diver)
3) CCI cross up thru -100 following 1) and 2)
Soo, again, going Long on y/d CCI tlb was fine, but my divergence corollary for whether the low is in has not been satisfied by the 3 criteria above.
13 CCI trendline breaks are good trade signals. Nimble works
Commodity Channel Index (CCI)
BTCUSD Daily 13CCI tbl and triangle apex still Short until..In a big picture, standing aside until price breaks above $41.5k or below $28.5k can save a lot of whipsaw unless one is nimble, has low fees on trades, has limit and stop orders available, and is a good chart reader.
For those wanting to use 13CCI signals to trade in/out during this extended consolidation, daily CCI is currently on a short signal. It would change to a long signal when 13 CCI crosses up thru the last shown down-trendline. We would also expect to see that the apex of triangle drawn on CCI would have its apex at or above zeroline
EUR.USD H4 Short 13CCI Triangle Apex below zeroline>61.8% retracement of upmove May 29 -June 3 suggests more down to full retracement or more
13CCI pattern is still strongly negative, and the CCI triangle apex is still well below zeroline, strongly favoring Downmove in price.
Price H&S target is the horizontal red dotted line down near $20k
However, things can change rapidly with political manipulation, so be watchful esp. the next few days. Any reversal to Upside price within the next few days could be expected to be a powerful move, so it is no time to be complacent. CCI will signal any real turn up with a CCI break up thru a down trendline on CCI
EURCAD H4 Short 13CCI tlbBoth Daily and H4 13CCI have a short signal from trendline break on CCI. Can this overcome a wedge on weekly chart? If so, first target may be the H&S target, and if no bounce there, there is a lot of open space below for a few hundred pips.
Long signal will be when a down trendline on CCI is broken to upside
BTCUSD Daily Fib extensions. CCI tlb. Getting ahead of myselfHead and Shoulders target marked on chart is below the fib retracement tagged last week. 13 CCI is turning up but it may be temporary. For a real upmove, After any divergence, normally we need a retest of low, then a move of 13 CCI above -100. However, should we get a lower new low, we have to start over looking for Longsm looking first for divergence in next price/time cycle, then a retet of low, then a crossing of 13 CCI up through -100. Or, for an easier but solid Long signal, When I see 100 CCI turn and get above -100, that will be a clear signal for upmove.
This post isn't ment to be predictive, but for helping to think of just a few of many possibilities ahead, to help stay observant and nimble
BLong
CHFJPY: Chances are Back !If you have missed this one, then your chances are back. Our uptrend was broken then the price went back to the higher levels where it was trading last week. More confluence means less risk. RSI is reaching critical levels pushing bears more. The price can still trade inside the resistance zone for a couple of days, so trade safe and best of luck !
If you like the idea, support us with a like and follow.
MacroForex
MSTR Daily Long 13CCI tlb triangle apexMSTR Daily -13 CCI has a Long signal just triggered with a cross up thru a down trnedline on CCI for an aggressive Long at 773. The continuation of Up is favored by location of two CCI triangle apices being above zeroline.
More conservative traders may wait for a breakout above the swing high dotted line, to avoid any possible continuation of zigzag retracement down to the swing low solid line or lower.
Check out 16 Apr 750 Call for 107.00, 21 May 780 Call for 145.00. Feb 20021 high was above $1300
Reversal would be a 13 CCI break down through an Up trendline (not shown, to retain clarity)
BTCUSD H4 13CCI Triangles Long when tlbTwo 13 CCI triangle apices (apexes?) are above the CCI zeroline, which favors price moving up. The definitive Long would be when CCI crosses up through the downtrendline, at the green arrow
Reversal to short would be when 13 CCI crosses down thru an uptrendline not shown
DXY 1D 13CCI Still negative. Daily DXY 13CCI is still not showing much upside strength. The downward momentum is slowing, but a real trend change up in price ordinarily will first offer a CCI divergence, then a retest of low, then the 100CCI likely would shoot up thru -100. Jenner's Divergence Corollary is that if we have not seen a CCI diver, we have likely not yet seen the low. A powerful change of trend can obviate need to see that first, so if CCI crosses the zeroline before we see a diver, either a powerful move up has begun or a sideways consolidation is underway
BTCUSD Daily CCI & Wolfe waves I'll be buying between Wolfe waves 4 and 5, preferrably fading wave 5, coinciding with a CCI line (which is now on a short signal and dropping) going north back up thru the green down trendline
The exit would be after the next high after CCI crosses down thru an upline not yet shown
FLong
BLong