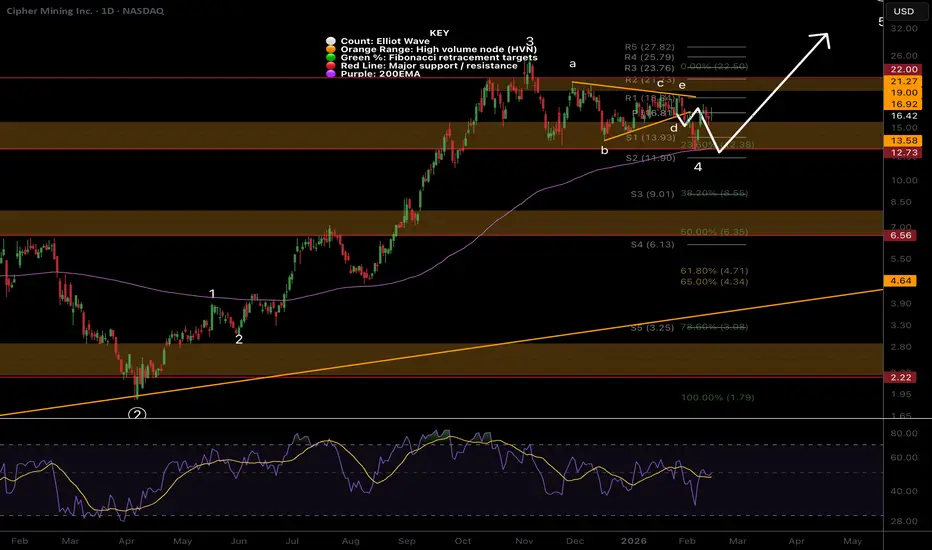
CIFR Macro analysis | The bigger picture | Long-term holdersNASDAQ:CIFR wave 4 appears complete at the triple support: weekly pivot, HVN and 0.382 Fibs, popping above the trend line resistance and challenging the ATH. Price has yet to make a higher high on the macro structure, so it is still bearish until it gets above $21.50. Wave 5 has a target of the R2 weekly pivot at $37.71. Bulls are still in control with price above the weekly 200EMA and pivot.
📈 Weekly RSI is trending down from overbought, but has flipped bullish with no divergences
👉 Analysis is invalidated if price falls below wave 4, keeping the downtrend alive with a target of the weekly 200EMA and 0.382 Fibs at $8.32
Safe trading
Cypher
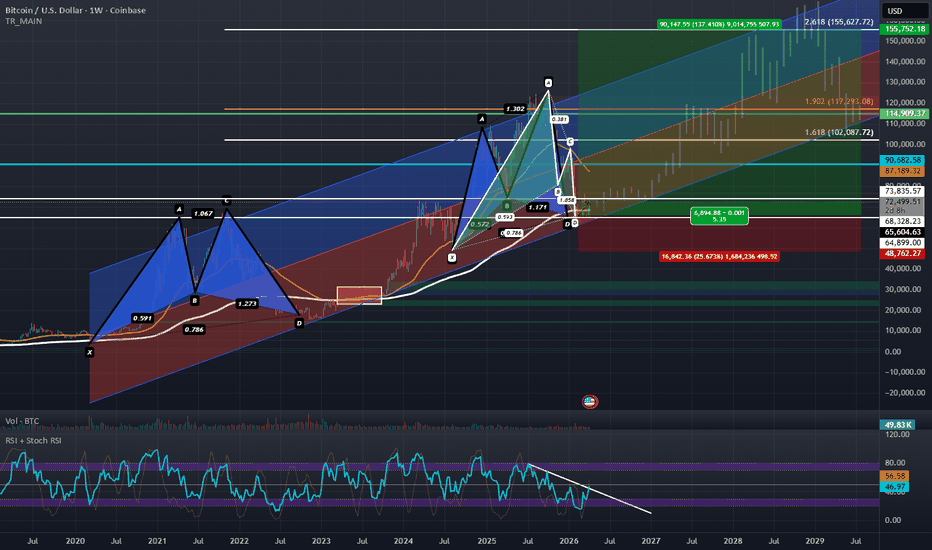
BTCUSD: Bullish Gartley Support Confirmed Targeting $155,627.72This is a follow-up to the previous bullish entry idea from 2 months ago at the bottom of the channel.
Over the last several weeks BTC has been putting in a bottom at the bottom of this channel both in terms of putting in a Double Bottom on the weekly timeframe and confirming a Bullish Inverted Hammer on last month's Monthly Close; in this time BTC has been taking back the 200-week moving average and given that BTC rarely stays below the 200-week Moving Average for long it is statistically likely that BTC begins a new bull cycle from here. We've also seen a significant rise in Demand Deposits and Physical Currency in Circulation which is likely to lead to this new money chasing fixed supply assets which is a category BTC fits perfectly into.
This macro bottom aligns with the combined PCZ of a Bullish Cypher and Bullish Gartley and seems to be setting up to repeat the end of the 2021-2022 Cycle Top to Bottom Fractal and is trading above the previous Cycle Highs. If this Cycle ends like it did in 2022 we should begin a new uptrend that can take BTC all the way up to the 2.618 Fibonacci Extension at the top of the Linear Regression Channel which aligns wit the $155,672.72 area.
It would seem that Bitcoin is trading around the previous Cycle High Horizontal Support/Resistance Zone. BTC has been holding above the lower end of the zone at $64,899.00 and has been finding resistance at upper end of the zone at $73,835.57, BTC is yet to break above the upper end of this zone but if it does BTC will likely be able to begin it's next major move to the LOBF (the middle line of the channel) where it might then find resistance but if it manages to push above that level too it could later rise to the 2.618 and perhaps even the 3.168-3.618 Extensions before pulling back.
The RSI has also begun to break free from it's downtrend and lastly the USDT.D has been showing some signs of potential weakness as explained here:
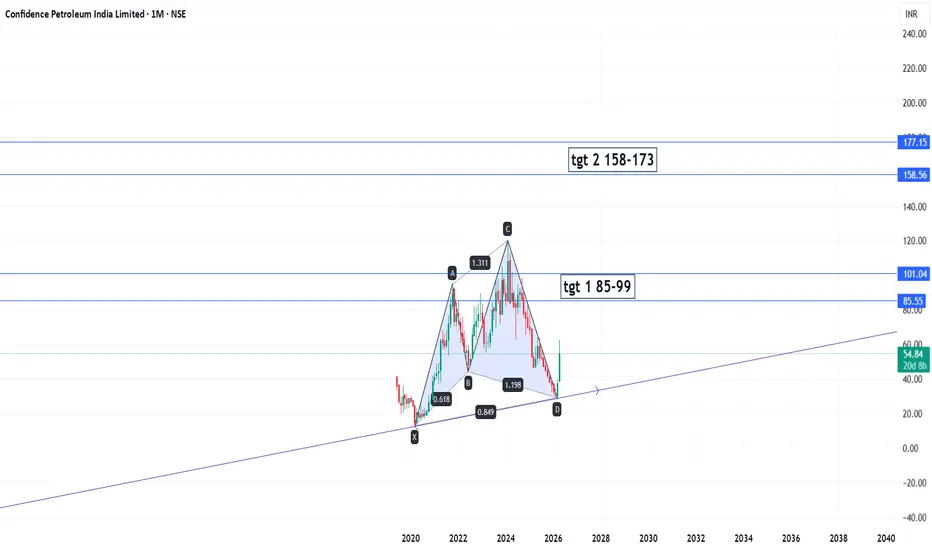
Cypher pattern in makingSetup
The Cypher pattern is a 4-leg reversal pattern that relies on specific Fibonacci ratios.
Here is how this specific setup validates:
B Point: Must be a retracement of the XA leg, typically between 0.382 and 0.618.
Here, it sits perfectly at the 0.618 level.C Point:
This is a "beyond" extension of the XA leg, reaching at least 1.272. On this chart, it pushed to 1.311, creating a higher high and trapping early shorters.
D Point (The Entry): The completion point occurs at the 0.786 retracement of the XC move. As we can see, price has touched the 0.849 (relative to the whole move) and is finding support on the multi-year trendline.
🎯 Key Levels to Watch
The chart identifies two clear supply zones where liquidity is expected to sit:
Target 1 (85–99): This aligns with the previous structural resistance and the 0.618$
Fibonacci retracement of the CD leg.
Target 2 (158–173): A long-term target that aims for a retest and breakout of the previous "C" point highs.
💡 Trading WisdomHarmonic patterns are high-probability setups, but they aren't magic.
Confirmation is King: Look for a bullish candle close on the weekly or monthly timeframe to confirm the "D" point reversal.
Risk Management: A stop-loss should typically be placed just below the X point. If price breaks the origin of the pattern, the harmonic structure is invalidated.
Confluence: The fact that the "D" point coincides with the purple ascending trendline adds a significant layer of technical weight to this trade.
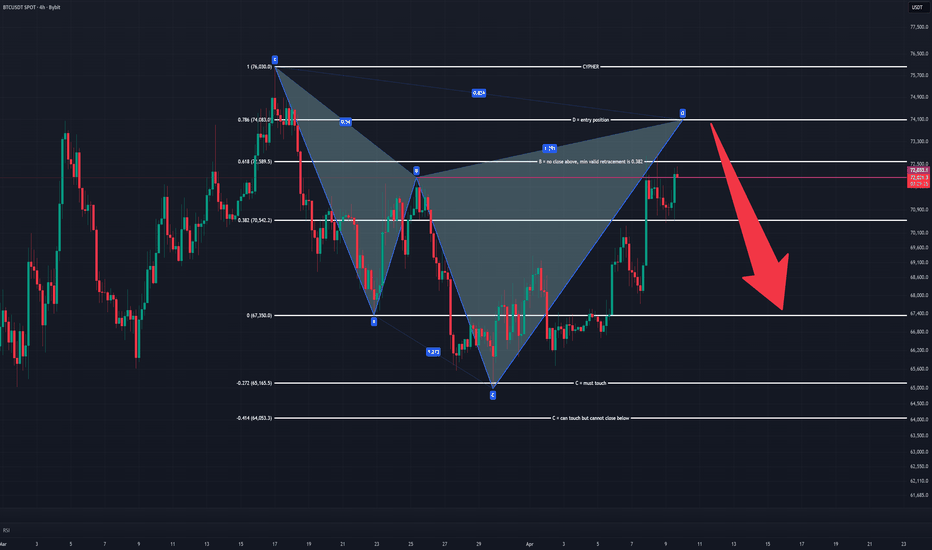
BTCUSDT 4H Bearish Cypher: PRZ Hit, Reversal Toward 67k?BTCUSDT 4H — Bearish Cypher nearing completion, watch for rejection from PRZ
BTC is trading into a very clean bearish Cypher structure on the 4H chart, with price now pressing into the potential reversal zone (PRZ) around 72.8k–73.8k .
The structure is technically interesting because:
X-A defines the initial impulsive leg
B respects the retracement conditions and has not closed above the invalidation area
C swept deep enough into the lower support zone and stayed within acceptable limits
Price is now approaching D , the key completion area of the pattern
At the moment, BTC is trading just under resistance while the market is testing the upper boundary of the purple supply zone. As long as price remains below the 73.8k region , this area can act as a short-term exhaustion zone.
Bearish thesis
If BTC rejects from the current PRZ, the first meaningful downside target sits around 67.3k (point A / major horizontal support). A deeper move could extend toward the 65.1k zone , which aligns with the lower liquidity/support region marked on the chart.
Key levels
PRZ / reaction zone: 72.8k–73.8k
Invalidation: sustained breakout and acceptance above 73.8k
Major invalidation / structural risk: 76k
Target 1 : 67.3k
Target 2: 65.1k
What I want to see
I would prefer confirmation in the form of:
rejection wicks into resistance,
weakening momentum on lower timeframes,
or a bearish close back below the purple zone.
Until that happens, this remains a setup zone, not a confirmed reversal.
This chart suggests BTC is at a decision point: either reject from the Cypher completion area and rotate lower, or invalidate the pattern with strength above resistance.
Not financial advice. Manage risk and wait for confirmation.
CIPHER Macro analysis | The bigger picture | Long-term holdersNASDAQ:CIFR remains in a wave 4, below the all-time high. Wave 4s are characterised by their drawn-out, shallow, volatile ranges, well known as the place where traders give their gains back to the market through impatience and false signals. Wave 4s usually end at the 0.382 Fib, $8.52, but can extend as far as the 0.5, aligning with the weekly 200EMA and HVN, so this is a high confluence area. Price is currently testing the weekly pivot as support and the upper trend-line of the previous trend. Wave 5 has a minimum target of $37, at the R2 weekly pivot.
📈 Weekly RSI is trending down from overbought, bears are taking over, plenty of room to fall
👉 Analysis is invalidated if price falls below the 0.5 Fibonacci retracement at $6.35 or gets above $15.80
USDCAD SELL 1.4000On the daily chart, USD/CAD has stabilized and is trending upwards, with a short-term bullish bias. The current resistance level to watch is around 1.4000. This level represents a potential shorting opportunity based on a bearish cypher pattern; consider shorting once this level is reached.
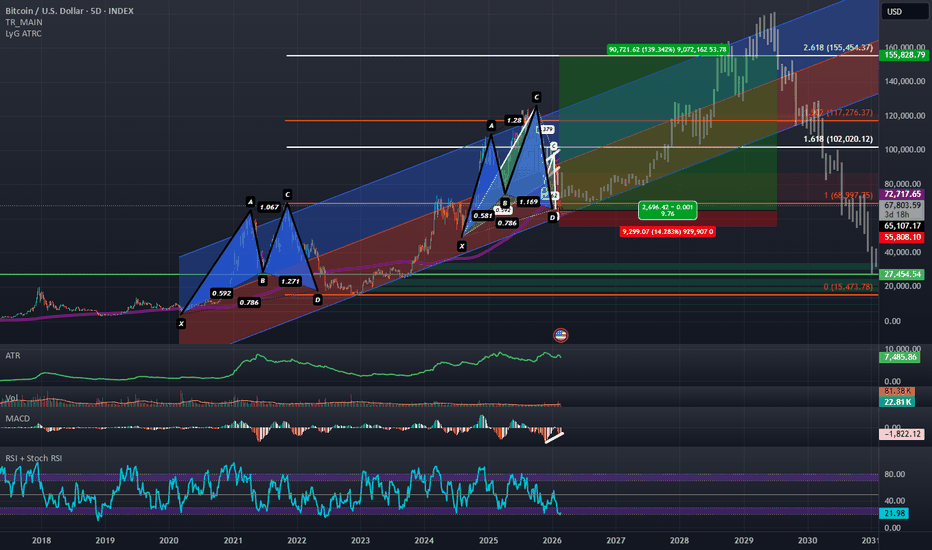
Bullish 2021 Bitcoin Fractal Suggests Bitcoin has BottomedBitcoin is sitting at the PCZ of a what can be plotted as both a Bullish Cypher and a Bullish gartley and on the 5D timeframe it is below the 200 Period SMA which it usually doesn't stay below for long; and is also sitting a the 1.618 Standard Deviation demand line of a Linear regression Channel while exhibiting Bullish Divergence on the MACD and starting to show a second recovery from oversold zones in the RSI after what was a sharp secondary decline into oversold zones and lastly on the price decline, the ATR spiked up but has since started to return back to where it came from which signals the downside volatility might be waning here.
All of this suggests to me that on a technical level Bitcoin has indeed bottomed and if we are to complete the same harmonic fractal as we did leading to and during the completion of out last Bullish Cypher in 2020-2022, our next target would align with the 2.618 Fibonacci Extension which happens to be around the top of the channel BTC has developed over the years and would also bring BTC back on track to keeping up with the SPX which has already reached its 2.618 extension and may be headed for the 3.168 extension next as seen in this fractal of the SPX here:
The other week I closed my shorts on BTC and started to position for a deadcat-bounce with a target around 106k but upon looking back at some older charts and targets and seeing the Japanese Inflation numbers read below 2%, I came to the conclusion that BTC might be enabled to rise and complete its fractal fully which would take it to the 2.618 extension and given all the confluence at both the current entry and potential future exit I think it will probably be a good idea to raise the full profit taking target to $155.4k
Once BTC catches up with the SPX in terms of extensions and fractal completions; this may then lead to the ultimate decline in both Bitcoin and the S&P-500, but that bearish angle is just me thinking further ahead. For now and for the time being I will be focused on the Bullish higher Bullish targets.
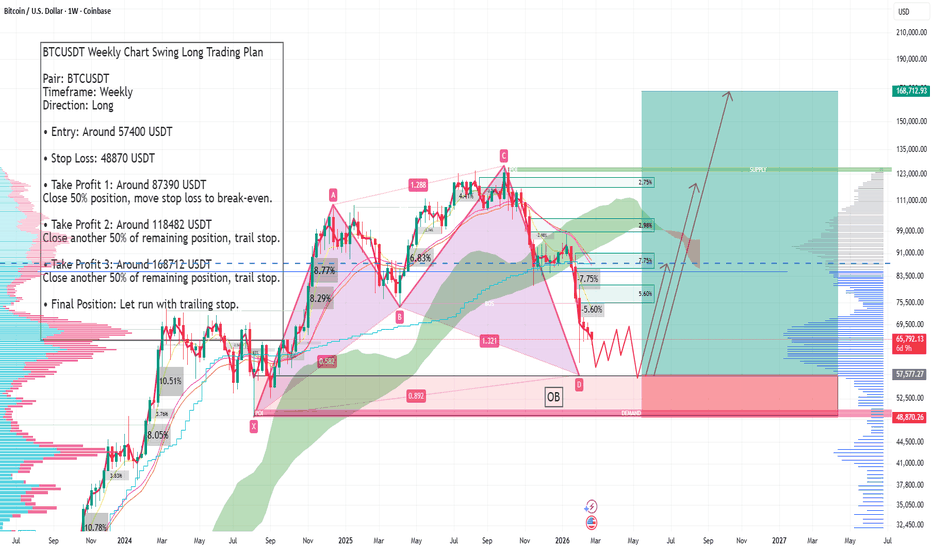
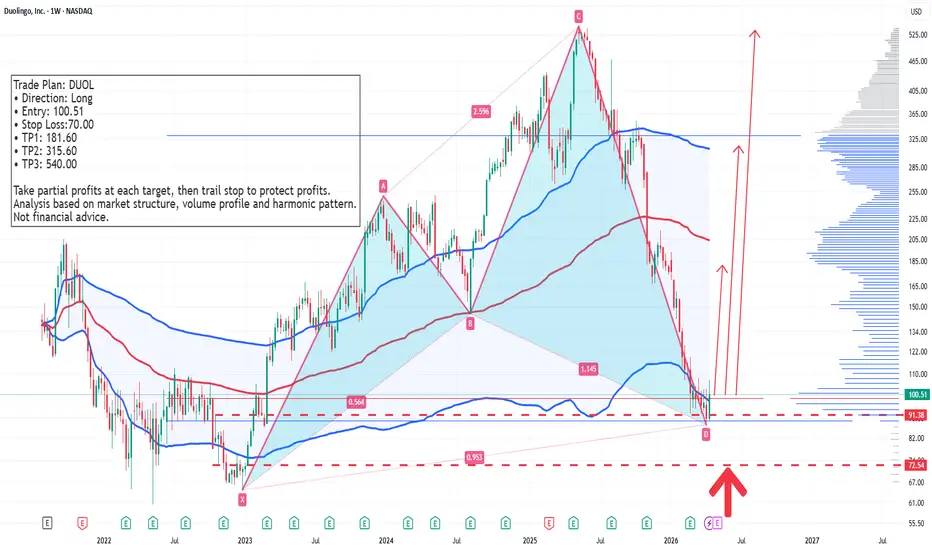
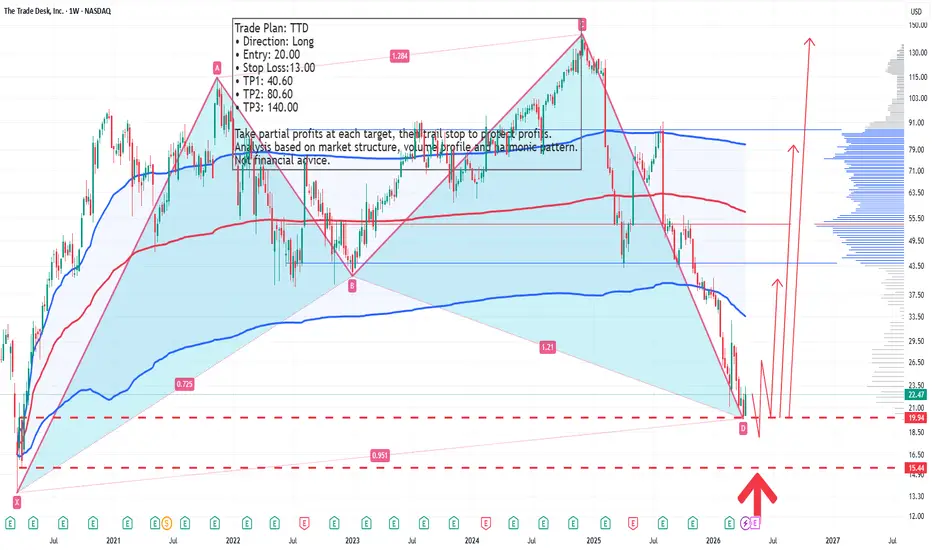
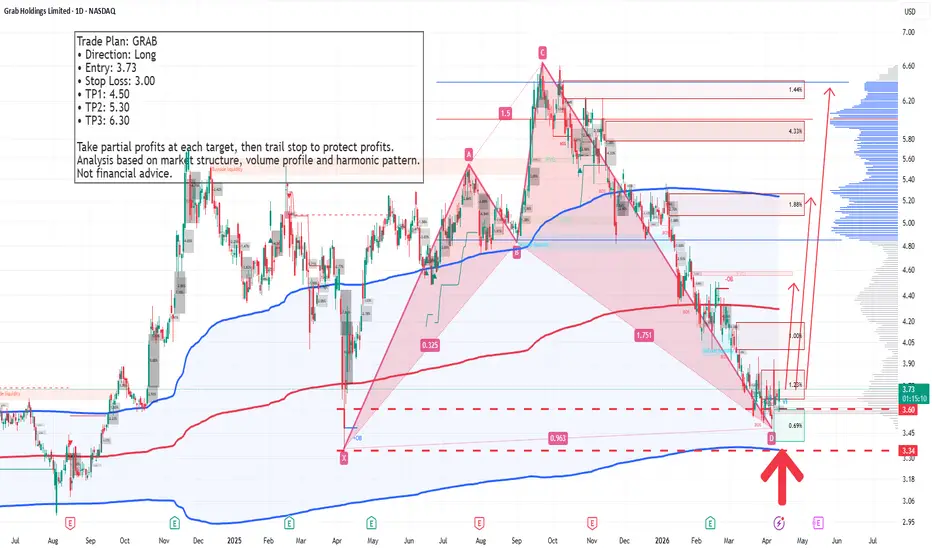
BTCUSDT Weekly Chart Swing Long Trading Plan BTCUSDT Weekly Chart Swing Long Trading Plan
Pair: BTCUSDT
Timeframe: Weekly
Direction: Long
• Entry: Around 57400 USDT
• Stop Loss: 48870 USDT
• Take Profit 1: Around 87390 USDT
Close 50% position, move stop loss to break-even.
• Take Profit 2: Around 118482 USDT
Close another 50% of remaining position, trail stop.
• Take Profit 3: Around 168712 USDT
Close another 50% of remaining position, trail stop.
• Final Position: Let run with trailing stop.
CIFR, triangle finished, , whats next?NASDAQ:CIFR
🎯 The bearish triangle from the last report played out. “ This is a penultimate pattern, we can expect price to thrust lower, test the daily 200EMA, end the correction, then makes its way to new highs.” So far so good.
📈 Daily RSI is back to neutral at the EQ
👉 Analysis is invalidated if price falls below wave 4, suggesting we have a complex correction lower
Safe trading
CIFR Triangle path played out nicely..NASDAQ:CIFR triangle in wave B played out, following my path closely, touching the daily 200EMA and major High Volume Node support line, at the 0.236 Fibonacci retracement. This is a highly probable place for wave 4 to end.
Triangle are a penultimate pattern, so that thrust lower last week should mark the end of the downtrend.
There is no divergence in the daily RSi and has a little room left to hit oversold but can do so on a bullish divergence without a new low.
Price closed Fridays candle at the highs +16% showing consumer confidence to hold over the weekend news cycle.
Safe trading