GBPUSD 4 hr. Forecast for review and comment!#GBPUSD has formed a Deep Crab harmonic pattern in the 4-hour time frame with a good positive regular divergence at the bottom, probability of an increase is high on the condition of breakout the pivot point standard line and the mentioned dynamic trigger. The rate can In an upward rally could complete a shark harmonic pattern in order to answer to the Deep Crab!
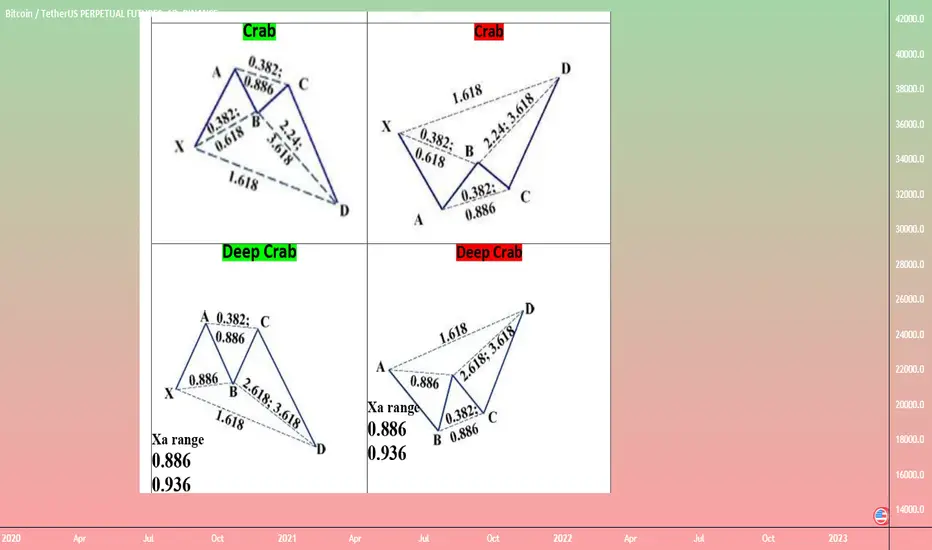
Deep Crab
Macro Bullish BAT, SHARK, and Deep CrabAn extreme speculation outlook on where support may come in for BTC. BAT, SHARK, and Deep Crab all lining up at the 88.6 of the macro fib. The C point is purely up in the air where that could end up, but this must pump up to make a lower high at C to come all the way back to 21k for the full completion to D. Multiple patterns are lining up with this price target. Not to mention a higher low to be put in. From there, this could even go lower, creating another Deep Crab at 12k for the Full .886 of
IPCA LABSHello & Welcome to this analysis
The outlook has been down from quarterly, monthly, weekly & daily chart study.
Its been in a 2 years downtrend, now near a support but yet to give any reversal confirmation. If this level of 700 fails to hold the next major support comes in at 600.
Overall its a wait and watch stock even from a bounce back point of view
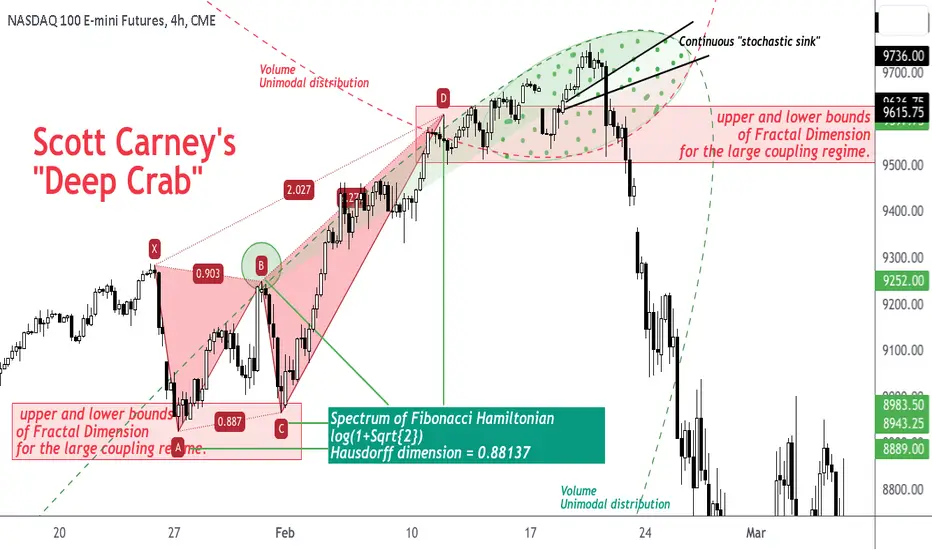
Scott Carney's "Deep Crab" & the Fields Medal in MathematicsQ: What does the former have to do with the later?
A: The intuition in the former (S. Carney) is born out by the later (A. Avila; Fields Medal - 2014)
From Scott Carney's website;
---------------------------------------------------------------------------------------------------------
"Harmonic Trading: Volume One Page 136
The Deep Crab Pattern™, is a Harmonic pattern™ discovered by Scott Carney in 2001.
The critical aspect of this pattern is the tight Potential Reversal Zone created by the 1
Perfect automated detection of Butterfly & DeepCrab PRZ - ShortA bearish-type Butterfly pattern occurred near the resistance zone of 95.60-96.60.
If the price rises to 96.78, a bearish-type DeepCrab pattern could occur.
Short after seeing the rebound.
*Harmonic patterns and support/resistance zones are automatically detected using the indicators below.
- Harmonic auto-detect PRO
- Support/Resistance Zone Auto PRO
Very Long Term Bullish Crab on the 12hr 1DBINANCE:BTCUSDT
Update from my last post: We did not bounce at the .886 for the BAT at exactly where it needed to. It is actually setting up for the BAT that was from the prior swing low, which still makes it valid. This sets it up for a Deep Crab instead of the Butterfly as once thought.
If we get a bullish move up here, this would set up for a Bullish Deep Crab (Blue) where the D point is at the .618 of the very Macro chart. If we get a bounce at the .618, then that could potentially set up
Bullish Crab on 4hr, 12hr, 1DBINANCE:BTCUSDT A fun way to potentially draw what could happen in the long term. Just for fun. Since the Gartely Failed, I am leaning toward a Bullish Crab very soon $1000 away. I believe there will be some sort of reaction on the 1.618. From there, not sure, maybe make a Bat to a Deep Crab all the way up to 30k. From there, not sure. Thanks
Perfect automated detection of Butterfly & DeepCrab PRZ - LongA bullish-type Butterfly pattern occurred.
If the price drops to 0.97606, a bullish-type DeepCrab pattern could occur.
Also on the daily chart, bullish-type Butterfly pattern is occurring.
Long after seeing the rebound.
*Harmonic patterns are automatically detected using the indicators below.
- Harmonic auto-detect PRO
Harmonic Patterns Crab And Deep Crab my point of viewA proper Crab pattern needs to fulfill the following three Fibonacci rules: AB= retrace between 0.382 – 0.618 Fibonacci Retracement of XA leg; BC= minimum 38.2% and maximum 88.6% Fibonacci retracement of AB leg; CD= Poses a target between 2.24 – 3.618 Fibonacci extension of AB leg or an ideal target of 1.618 of XA leg.
Crab Pattern
The XA retracement levels are checked to validate the retracement (here, pivot B forms just near 61.8%, barely making it to qualify for the Crab pattern
At point C,
Snap Inc. (SNAP) ... More than Finger Excercise ??I am always intrigued with patterns (harmonic) within patterns.
Snap Inc. (Snap) fits that bill.
(1) The Original pattern is a Cypher, which began life around Dec, 20th 2022.
Target 1 has been met and I have marked Targets 2,3 and 4.
(2 ) Coincidentally this is may be the beginning of a larger bearish harmonic pattern, whose beginning I marked as last September.
The extent of Leg D is undetermined , but it has the potential of forming a harmonic Butterfly, Bat or Deep Crab
Thes
Perfect automated detection of DeepCrab pattern - ShortA bearish-type DeepCrab pattern occurred within the resistance zone of 18.777-18.842.
Short after seeing the rebound.
*Harmonic patterns and support/resistance zones are automatically detected using the indicators below.
- Harmonic auto-detect PRO
- Support/Resistance Zone Auto PRO
Perfect automated detection of Butterfly & DeepCrab PRZ - LongA bullish-type Butterfly pattern occurred.
If the price drops to 20.226, a bullish-type DeepCrab pattern could occur.
Also on the daily chart, bullish-type BlackSwan pattern is occurring.
Long after seeing the rebound.
*Harmonic patterns are automatically detected using the indicators below.
- Harmonic auto-detect PRO
Perfect automated detection of Butterfly & DeepCrab PRZ - ShortA bearish-type Butterfly pattern occurred.
If the price rises to 0.87450, a bearish-type DeepCrab pattern could occur.
Also on the daily chart, bearish-type Butterfly pattern is occurring.
Short after seeing the rebound.
*Harmonic patterns are automatically detected using the indicators below.
- Harmonic auto-detect PRO
DeepBrain Chain : THE AI COIN THAT CAN FLY WITH 300 % UPIt seems that there is a lot of excitement and interest in the potential of AI and its applications in the coming years. Companies and persons like Elon Musk with OpenAI are making strides in developing advanced AI technology, and this has sparked interest in AI-related products.
the DeepBrain Chain coin can play an important role coming time, which some believe has the potential to show strong growth in the future. This study, based on technical analysis, predicts that the coin could reach a
ADAUSD | Wave Analysis | Giant Bull Flag Ending Diagonal +60%Price action and chart pattern trading
> A possible ending diagonal minor 5-wave with a bull flag pattern as well as RSI bullish divergence
> An upcoming reversal supported by a strong harmonic pattern - bullish deep crab squeezed below EMA20D - Entry point zone
> Target TP1 @ Upper bull flag resistance zone +30% and TP2 @ X2 of Bull Flag EMA200D zone +60%
> Stop Zone @ lower support of bull flag -10-15%
> Risk reward ratio: 2:1 and 3:1 for short-medium term trade
Always trade with affordable
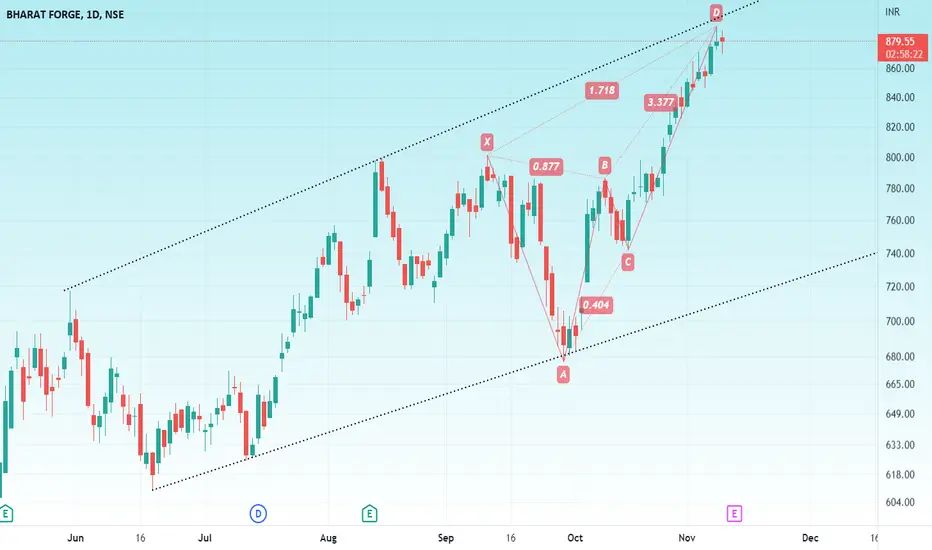
BHARAT FORGEHello and warm welcome to this analysis
On daily time frame it has activated a Bearish Harmonic Deep Crab indicating a retracement till 850-825 as long as it does not break above 895.
Good risk reward set up here.
A word of caution, results are due tomorrow. So manage your risk accordingly.