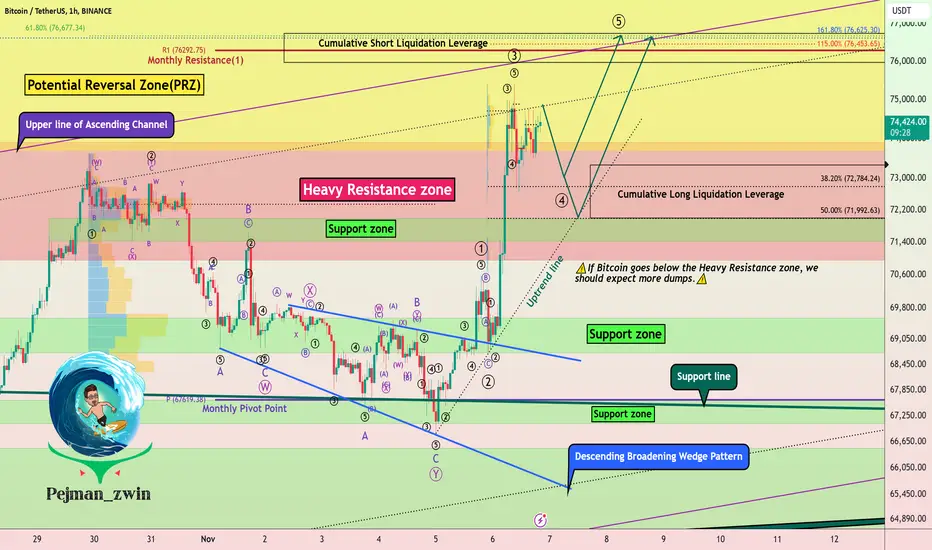
Bitcoin Roadmap!!!(New ATH)Bitcoin( BINANCE:BTCUSDT ) started pumping after it was almost certain that Donald Trump was the future president of the United States because Donald Trump announced his support for cryptocurrency during the last year .
In terms of Classic Technical Analysis , Bitcoin started pumping with the help of the Descending Broadening Wedge Pattern . ( Educational ).
Bitcoin has already managed to break the Heavy Resistance zone($73,900-$70,900) , but it has entered an important Potenti
Descending Broadening Wedge
DYM Descending Broadening Wedge Breakout Confirmed!We've just seen a strong breakout of DYM from its descending broadening wedge structure. This is a key bullish reversal signal! 📈
The price action indicates momentum building up, with the next target zone being around $7-$8, representing the top of the broadening wedge structure.
🔸 Key Levels: As the price surges, we’re watching the $7-$8 range for potential resistance.
🔸 Support Re-test?: A possible re-test of the breakout level could present a strong entry point if the momentum holds.
🔸 Vo
DLong
BTC: Descending broadening wedge=Bear TrapEveryone is running around with their heads on fire over a textbook bullish descending broadening wedge pattern.
Which I’d say is pretty damn bullish.
If we’re lucky, the negative sentiment will trigger a short squeeze, to shake out the leveraged degenerates out of the market, before the bull run.
Don’t be a bitch, buy the dip.
BTC Broadening Descending Wedge 4HBTC moving inside a broadening descending wedge on the 4H chart.
This shape has a bullish outcome more often than not.
Price action has touched major support twice.
BTC Price is back above the 50 SMA which is a good sign.
Keep an eye on this structure.
NFA
Do your own DD
PEOPLE/USDT: POTENTIAL DESCENDING BROADENING WEDGE!!Hey everyone!
If you enjoy this analysis, a thumbs up and follow would be greatly appreciated!
PEOPLE look good here. Breaks out from the descending broadening wedge-like structure and currently retesting it. Long some here and add more in the dip.
Entry range:- $0.075-$0.08
Targets:- $0.0865/$0.098/$0.11/$0.126
SL:- $0.07
Lev:- Use low leverage (2x-4x)
$AMC Descending Broadening Wedge FormationOverview:
NYSE:AMC is currently exhibiting a classic descending broadening wedge formation, a bullish reversal pattern that suggests potential upward movement. This setup is characterized by two diverging trendlines, with the price making lower lows and lower highs within the pattern.
Long-Term Target:
Based on the wedge formation, our long-term target is a move back to the top of the descending broadening wedge, around the ~$300 level. This target aligns with historical price action and sign
Two Paths. Point Of Decision Will Be Made Soon.Traders,
It is ad nauseam that I have been referring to my multi-year support/resistance trend line. But here we are again. Interestingly enough, it is also currently intersecting the top of my bullish descending wedge, making a critical area of confluence to become resistance.
As I see it, there are now two paths for Bitcoin. A break to the top side would indicate that accumulation is over and it is now time to look long.
A drop to the downside would indicate a retest of the bottom of our tr
DISNEY $DIS | DISNEY DESCENDING TRIANGLE PATTERN - Apr. 11, 2024DISNEY NYSE:DIS | DISNEY DESCENDING TRIANGLE PATTERN - Apr. 11, 2024
BUY/LONG ZONE (GREEN): $118.50 - $123.00
DO NOT TRADE/DNT ZONE (WHITE): $116.50 - $118.50
SELL/SHORT ZONE (RED): $112.00 - $116.50
Weekly: Bullish
Daily: DNT
4H: Bearish
A week ago NYSE:DIS broke its bullish trend on the 4H and lower timeframes. The Weekly timeframe still holds the bullish trend, and the Daily timeframe is currently untradeable for myself, but is working its way closer to a bearish trend as it is breakin
HEX/USDC Descending Broadening FormationOverview:
Pair: HEX/ETH
Exchange: Ethereum DEX (Decentralized Exchange)
Timeframe: 4-Hour Chart
Technical Analysis:
The HEX/ETH pair on the 4-hour chart is displaying a descending broadening formation, which is a reversal pattern signaling potential changes in market sentiment. Let's delve into the key observations:
Key Observations:
Descending Broadening Formation: The price of HEX/ETH has been forming lower highs and higher lows, creating a descending broadening pattern. This often indicate
HLong
$JD Potential Reversal: 2-Day DB, Descending Broadening WedgeOverview:
NASDAQ:JD (JD.com Inc.) appears to be forming a compelling technical pattern that suggests a potential reversal. The stock has developed a 2-day double bottom pattern, coinciding with a falling wedge setup, all occurring within the confines of a major descending broadening formation. Traders and investors should closely monitor these key technical levels for potential bullish momentum.
Key Technical Observations:
Double Bottom Pattern:
NASDAQ:JD has established a clear double bo
DBW in TTF FM hourly. New up or Gap CloseThe TTF FM is trapped in a sideway movement. After a cone and SKS formation which was resolved bearish with the slump to 43,2 we now see a completed but still not active DBW. The ideal upper target (box) is 51, the statistical target is the equal to the important top at 49.5
The bearish breakout would be at 43,2 and would imply the gap close at 37.
Typically DBW are most of the time bullish reversal/continuation figures, thus a bullish break out is the more likely case.
The SPY is Bouncing off of Support for the Second Time (Updated)Previously a trade was taken on the spy from this support level that targetted tthe $420-$425 level of Previous Support and Resistance after hitting this level of interest price came back down to support in early October. By this time we developed Bullish Divergence and eventually Gapped Down Below Support only to close Bullishly back above Support therefore Giving us a Bearish 3 Line Strike at Support along with a Bullish Divergence. Thisd is an update on that trade setup to point out the fact
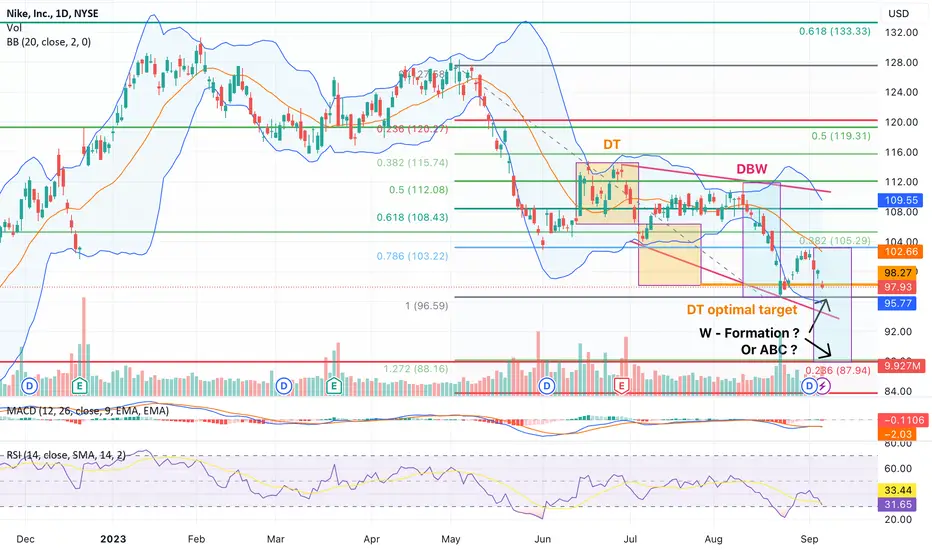
Nike - Bottom or ABC?Nike is close to an important level which will determine if a bottom formation is completed or a further slump will occur. Currently a DBW formation is build after almost perfect a Dopple Top Formation has been finished. Currently we are close to the 4 level, the current local low. The RSI is close to oversell, which support the turn around idea, which may result into a W formation whose execution would probably trigger the 5 and the DBW activation. On the bearish side a potential running ABC p
3x Inverse TLT ETF: Breaking Out of Descending Broadening WedgeThe Inverse ETF for the 20-Year US Government Bond is currently breaking out of a Descending Broadening Wedge and is looking to go much higher perhaps between the 61.8% and 78.6% retraces which would be about a 500-1,400% percentage gain which also means that longer end bond yields are going much higher.
BITCOIN DESCENDING WEDGEAfter 67 days of price action we have a 4H descending wedge pattern, and currently the upper boundary is being tested.
The SPX had a similar long term pattern formation as shown on the chart. The breakthrough of the upper boundary resulted in a 13.88% rally up past the previous local high and looks extremely bullish right now. Perhaps there will be a cool off soon but Bitcoin for sure has not had this rally yet, and the descending wedge breakthrough could trigger a similar rally.
With talk o
📉 Descending Broadening Wedge Identified on $RAYHey traders! Today, I want to discuss an intriguing chart pattern I've identified on $RAY. Let's explore the descending broadening wedge and its implications for potential price action. 📊💡
Pattern: Descending Broadening Wedge 📉🔽
Symbol: FWB:RAY 💰
Overview:
A descending broadening wedge is a significant chart pattern characterized by expanding price swings within converging trendlines. This pattern suggests increased volatility and the potential for a reversal. Let's dive into the descending
📉 Descending Broadening Wedge Spotted on $DOTHey traders! Today, I want to share an exciting chart pattern I've identified on MIL:DOT (Polkadot). Let's explore the descending broadening wedge and its implications for potential price action. 📊💡
Pattern: Descending Broadening Wedge 📉🔽
Symbol: MIL:DOT 💰
Overview:
A descending broadening wedge is a distinct chart pattern characterized by expanding price swings within converging trendlines. This pattern suggests increased volatility and the potential for a reversal. Let's dive into the de
INTC - Bullish Reversals - Long On the chart of Intel Corporation (INTC), we can see two bullish reversal patterns on a daily timeframe.
We can see a Descending Broadening Wedge. This is a typical bullish reversal pattern. Once the price breaks out of the upside of the pattern the highest point of the pattern becomes the target.
The second pattern is a forming Double Bottom. This pattern indicates a bullish reversal. Once the price breaks out of the neckline the target will rise the same length as the range from the neckline
S&P 500: Bullish Gartley Above Demand LineThe Hourly setups have been stopped out and the SPX has gone significantly deeper but now looking at the Daily Setup and it gives reason to think it can continue up from here. We are at the Demand line of the Descending Broadening Wedge and are trading at what could be a Bullish Gartley. From this point I'd put stops below the 800 Day EMA and enter bullish positions at the current level and see how it goes over the coming weeks to see if we can get a Break Hook and Go.
SNXUSD Descending Broadening Wedge Double Bottom Breakout TargetSNX has Double Bottomed within this Broadening Wedge Pattern and is now attempting to Breakout of the Wedge and close above a major weekly candle close. if it can successfully do so i think it could easily target up to the 0.618 Fibonacci Retrace.
FTMUSDT is testing the new breakout Currently, the price of FTMUSDT is attempting to break out of a descending channel after a clear retest of the 0.5 Fibonacci level.
A descending channel is a technical pattern in which the price of an asset moves downwards between two parallel trend lines. The upper trend line acts as a resistance level, while the lower trend line acts as a support level. The descending channel is a bearish pattern that indicates that the price of the asset is in a downtrend.
In the case of FTMUSDT, the descen
F
EOSIO: Double Bottom Breaking Out of Descending Broadening WedgeWe have a Confirmed Partial-Decline of the Descending Broadening Wedge; The Bullish Target would take us to $6.30 but we have room to push to around $10.50
ELong