Ethereum: The Macro Fractal Blueprint🧠 Preface: Why Ethereum Is the Most Underestimated Macro Trade of This Cycle
While Bitcoin dominates the headlines and absorbs the majority of institutional capital, Ethereum quietly remains the most structurally interesting asset in the entire digital asset universe. It is simultaneously a monetary asset, a yield-bearing instrument, a settlement layer for trillions in tokenized value, and the backbone of decentralized finance.
Yet despite this fundamental depth, ETH's price action on the macro
ETF
Gold ETFs Change in BLOOD?HDFC AMC has introduced changes in its Gold ETFs. Earlier the ETFs were backed by almost 100% physical gold, but now they are backed by minimum 50% physical gold giving flexibility to the fund managers. Under the revised framework, the fund managers may invest up to 50 percent of its net asset value in gold-related instruments such as derivatives, gold deposit schemes (GDS), and the gold monetization scheme (GMS).
I believe this move will be followed by other players as well. HDFC AMC has given
BTC Dominance: Watching alt trends? Key levels for the days aheaBTC Dominance. Watching alts bleed and wondering who’s stealing the show? BTC.D is hovering around 58.8% while headlines keep circling possible ETF inflows and “flight to safety” flows back into the king. According to market chatter, every dip in bitcoin is still getting bought, which usually means altcoins stay in the shadow a bit longer.
On the 4H chart I see dominance stuck between a thick green demand zone below and a red supply block above, with RSI curling up from mid levels. That tells m
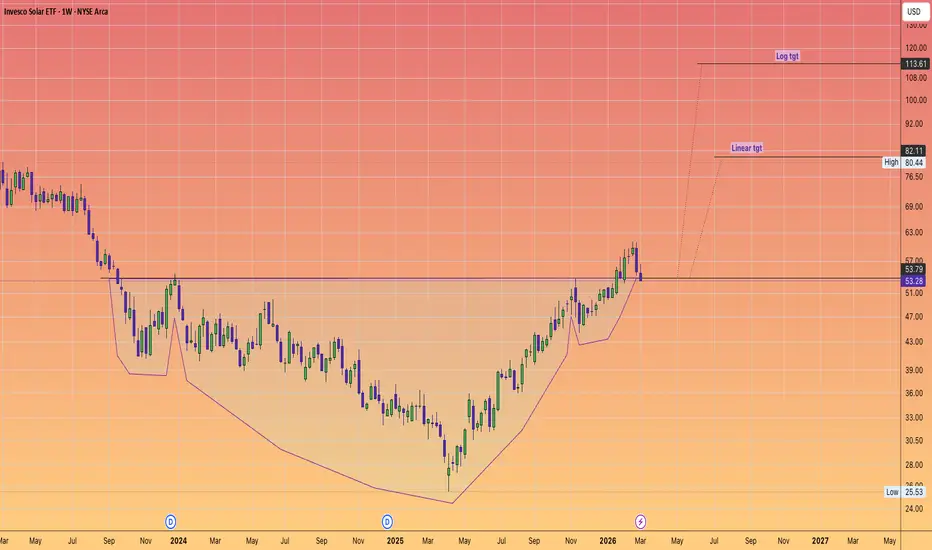
Solar Entering A period of Steady Growth (TAN)Beautiful chart - the TAN ETF has been on a steady climb and remarkably steady throughout all this turbulence. Mostly unaffected by the oil crisis. I wonder why? (sarcasm)
No matter what shenanigans are occurring around the world, and how backwards some countries are looking (ahem, USA), innovation in sustainable energy is a requirement for humanity's future. Many have already made the pivot, and it is likely to continue, I believe.
There could be an entry point at the long term trendline or
Nasdaq ETF QQQ: Liquidity Sweep Then Expansion Play📊 ASSET DETAILS
Instrument: QQQ — Invesco QQQ Trust Series
Market: NASDAQ
Type: ETF
Trading Style: Swing Trade
Bias: 🟢 Bullish
🧠 MARKET STRUCTURE & TECHNICAL CONTEXT
QQQ is currently respecting a bullish market structure, supported by a triangular moving average pullback and clean retest.
This behavior typically signals trend continuation, not reversal, provided key liquidity zones remain defended.
📌 Key confirmations:
Higher-timeframe trend intact
Price reacting positively to dynamic support
SMH Bullish Structure Confirmed — Pullback Strategy Active!🎯 SMH Semiconductor Heist: The $400 Target Caper 💰🚀
📊 Asset Overview
VanEck Semiconductor ETF (SMH) - NASDAQ Listed
Trade Type: Swing Trade (Bullish Setup)
Strategy Style: "The Thief Method" - Layered Entry Approach 🏴☠️
🔍 Technical Analysis Breakdown
📈 Bullish Confirmation Signals
✅ Supertrend ATR Indicator: Bullish pullback confirmed
✅ HULL Moving Average: Clean retest and bounce pattern detected
✅ Market Structure: Higher lows forming with momentum building
The setup is cooking like a perfe
QQQ long-term TAThe market is in dangerous formation since the last couple of months, there has been no change in trend strength. You should be careful and watch for the first support level which is around WMA50 and in other case it's possible for QQQ to go all the way down to 500ish area where you can also notice a small gap in the past.
BNB - Bullish at $673! RWA $3B, Grayscale ETC, FOMC Tomorrow What's up traders! 👋
BNB at $673 in ascending structure (purple trendlines). BNB Chain RWA $3B (2nd largest, +34.5% in 30 days), $747M net flows (leading all chains), 40K+ asset holders (+360% YTD), Grayscale BNB ETF filing, Fermi hard fork (40% faster blocks). BUT XRP flipped BNB for 4th place (capital rotation), failed $670 breakout. FOMC tomorrow (Fed rates decision). Testing bearish FVG $678-$680. Two scenarios: break resistance/FVG, push to $686-$688 and past OR break down below $661-$664
Semiconductor Supercycle - Future Millionaires 2050Looking at the long-term chart of the Semiconductor sector, the trend is pretty clear.
We have a persistent multi-year uptrend with periodic pullbacks (that don’t end the cycle).
The price has long respected the long-term channel and historically any major correction has created buying opportunities rather than signaling a top. However, we are now part of an e ven larger cycle .
Even though many semiconductor companies are trading near all-time highs, the bigger picture suggests we’re still i
$WPEA WORLD ETF: Left an uptrend range but still on a good shapeEURONEXT:WPEA — MSCI World ETF EURONEXT:WPEA EURONEXT:WPEA
Price action has exited the prior strong uptrend channel but continues to trade within a well-defined consolidation range of $5.98-$6.30. This suggests a healthy pause rather than a structural breakdown at this stage.
An entry near the $6.00 level offers a favorable risk/reward setup, provided the geopolitical environment does not deteriorate further. As a broad global equity exposure vehicle, WPEA remains sensitive to macro sent
Polkadot Finds The "Sweet Spot"On Feb. 25th, COINBASE:DOTUSD printed an impressive Bullish Candle creating a new High @ $1.752. This rally accompanied by strong Volume suggests that price may be looking to continue higher!
Since the High on Feb. 25th, price has been falling but after closer examination, the descent in price may have a particular area its looking for Support from.
Using the Fibonacci Retracement tool from the Low @ $1.103 to the new High @ $1.752, we can see that price has found its way to the Previous Hig
$TAN: Inverse Head and ShouldersThe Pattern Setup:
Left Shoulder: Formed during the late January dip (approx. $51.00 - $52.00).
The Head: The deeper washout seen in late February/early March, potentially hitting a low near the $50.48 mark.
Right Shoulder: Currently forming or anticipated as price stabilizes above the $51.51 support zone.
The Neckline: Likely a horizontal or slightly descending line connecting the peaks near $58.00 - $59.00.
The Why:
The geopolitical drivers behind the current oil spike (March 2026) can
BOTZ - The Age of AiHello Team,
Here we have a high-quality diverse ETF focused on Robotics and Ai.
In current market trends, Ai & Robotics are at the forefront of discussion and growth prospects.
Technicals: We can see that the monthly MACD gas recently flipped bullishly and we are getting strong buying pressure off of the accumulation zone.
Enjoy!
Is Bitcoin Being Suppressed by the Very Institutions It Invited 🔥 Bitcoin: The Asset That Invited Wall Street — And Got Wall Street’s Playbook
For years the promise was simple:
“When institutions enter Bitcoin, price will go vertical.”
Institutions entered.
ETFs launched.
Derivatives exploded.
Wall Street desks integrated crypto exposure.
And yet…
Bitcoin now behaves less like a scarce digital commodity — and more like a heavily managed liquidity instrument.
Let’s talk about why.
The Paperization of Bitcoin
Bitcoin was designed to eliminate monetary manip
BTC Dominance: bounce or breakdown? key levels to monitorMarket Cap BTC Dominance, % - wondering if altcoins finally get a breather or if king BTC grabs even more of the pie? According to market chatter, renewed spot ETF inflows and fresh regulatory noise around some alts have pushed traders back into the safer big cap, and dominance reacted right away. That makes this support test super important for the next rotation.
On the 4H chart we’re sitting right on a fat demand box around 58.3-58.5, with HV volume showing the next big node up near 58.8-59
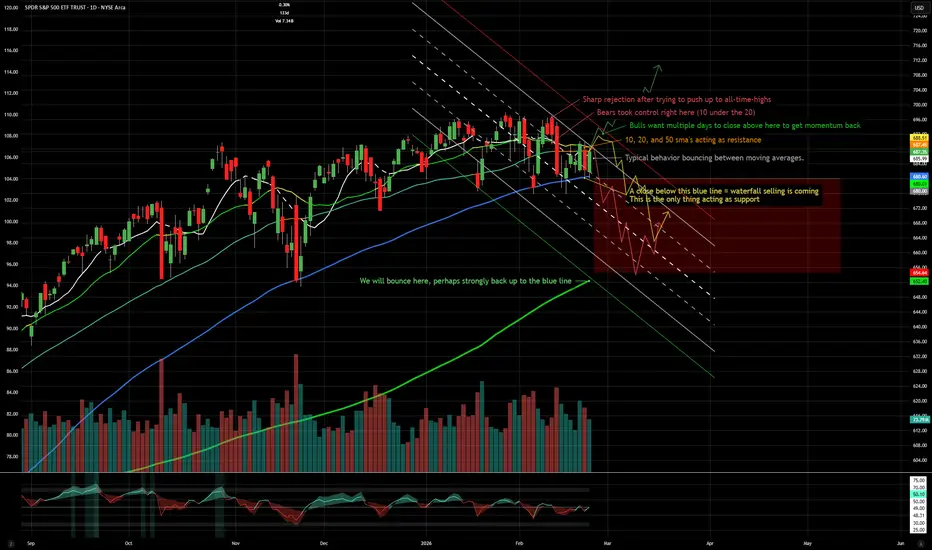
SPY Paths(Not financial advice)
(Comment if you dare)
NVDA IS HERE
NVDA earnings after the close will really swing this market.
They are expected to beat and raise, and they very well may beat and raise, but I don't expect it to hold.
Trump is ALSO HERE
Trump in his State of the Union tonight just said that the S&P hit 7,000 because of Tariffs.
Crap, Yeah, We have to pay that money back...
Well, FedEx is already suing them because of the SCOTUS ruling to get that S&P money back. Many other comp
Global X Lithium: Upward Pressure!Global X Lithium has recently continued its upward move, coming close to the $75.83 resistance. Still, we primarily expect selling pressure to return and to push price below support at $58.59 and, ultimately, into our green Long Target Zone ($48.40–40.94). In this range, we anticipate the low of green wave . If, however, the upward move prevails and price breaks above the $75.83 resistance, our alternative scenario could come into play. In that 33% likely case, we would expect a higher high in
SDS (ProShares UltraShort S&P 500) buySDS is developing a potential reversal structure after an extended decline and consolidation within the $65-66 zone, where liquidity was accumulated and a weak low was formed. Price has broken above the $68.4 resistance level, confirming a short-term structural shift and strengthening bullish momentum in the instrument.
Since SDS is an inverse ETF tracking the S&P 500, upside movement here may imply increasing downside pressure in the broader equity market. A pullback toward the $68.5-69.0 area