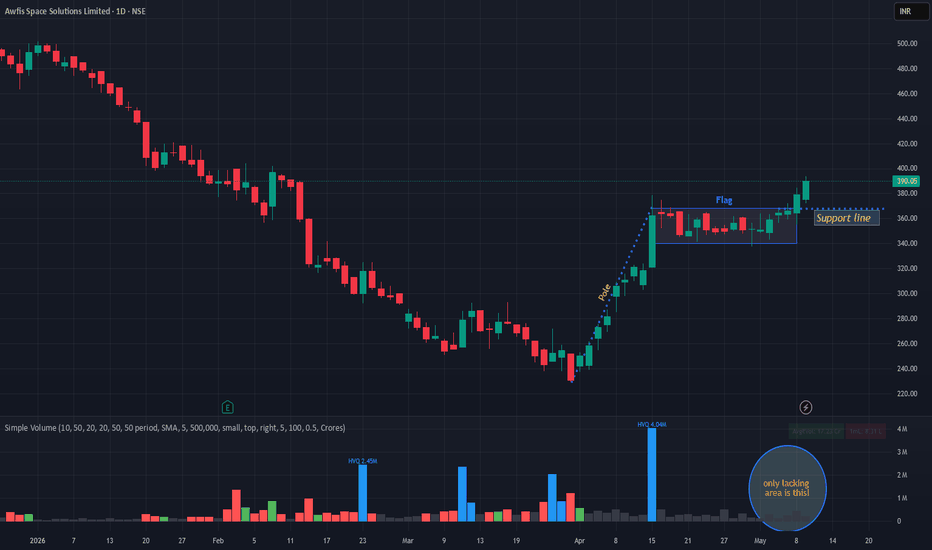
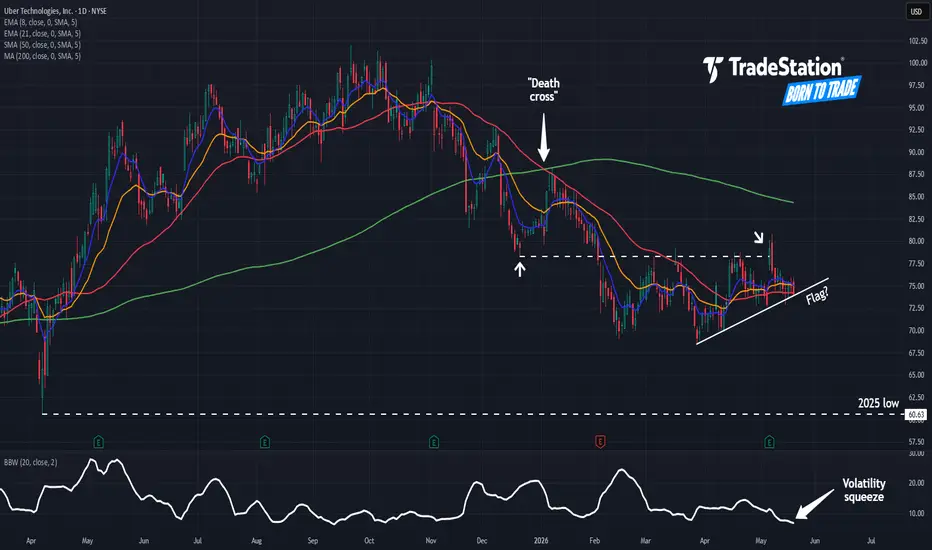
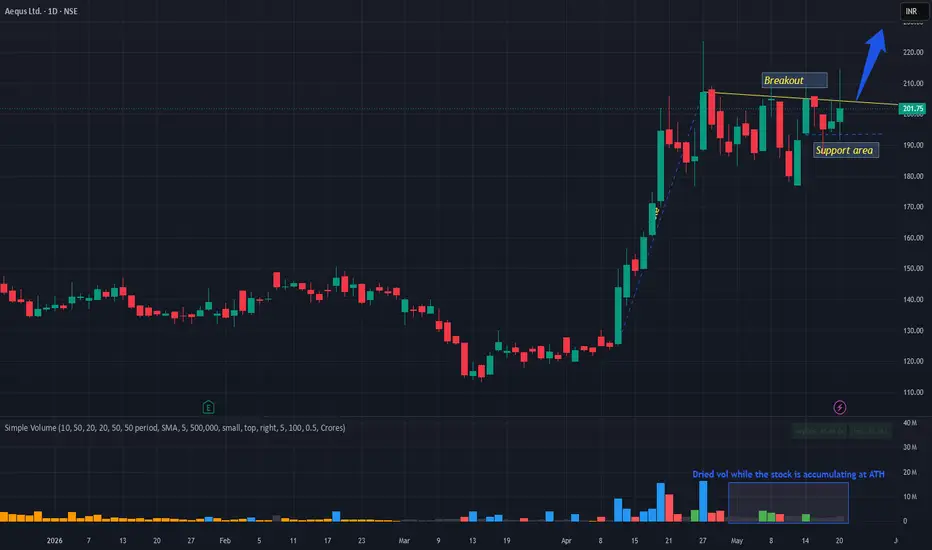
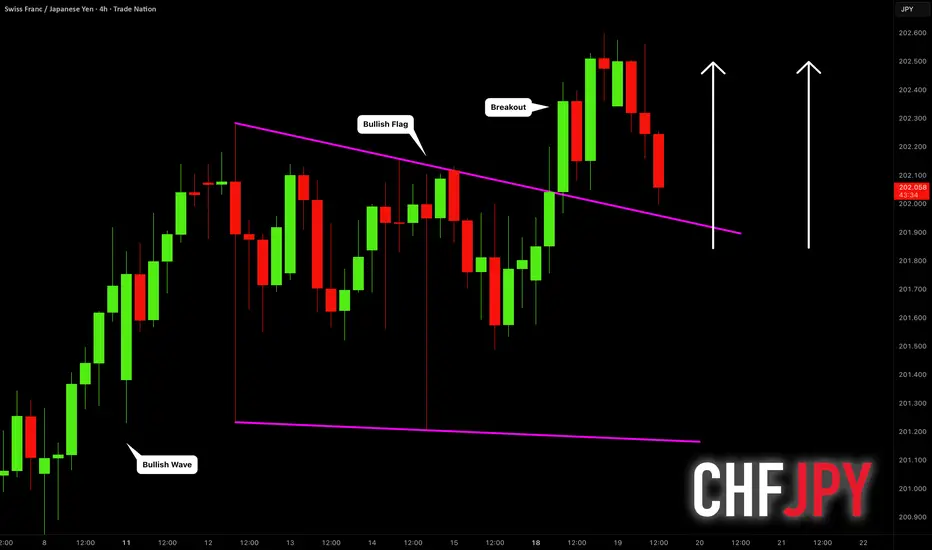
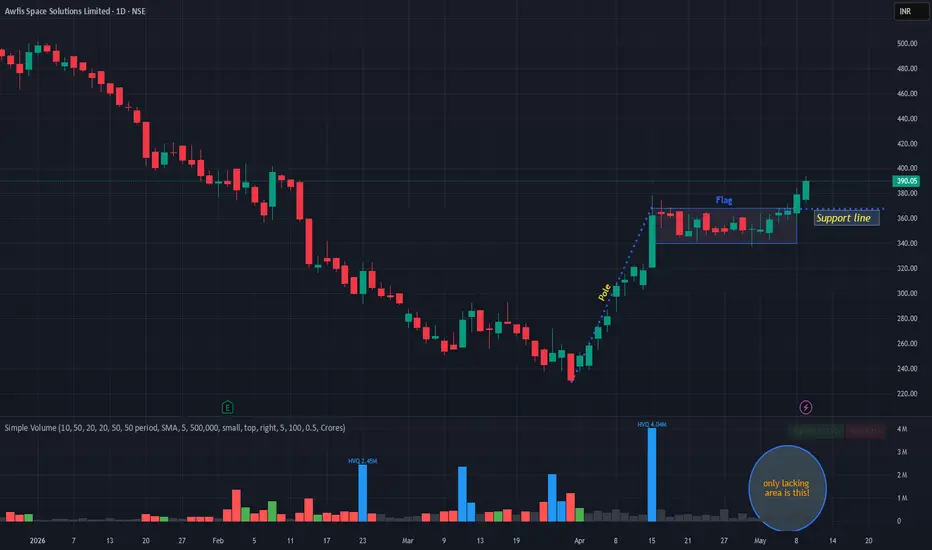
Flag
Selena | EURUSD · 1D – Bullish Channel Demand ReactionFX:EURUSD
After the strong bullish expansion that pushed EURUSD toward the 1.20 region, the market experienced a natural correction phase. The pullback is now approaching the lower boundary of the bullish channel along with a significant demand zone around 1.1500. This level has acted as a structural reaction point previously and aligns with the channel support, creating a strong confluence area. If buyers defend this demand zone, the market may continue the broader bullish structure and attempt another move toward the upper channel resistance where buy-side liquidity rests above the previous highs.
Key Scenarios
✅ Bullish Case 🚀
Demand zone holds.
🎯 Target 1: 1.1800
🎯 Target 2: 1.1950
🎯 Target 3: 1.2050 – 1.2100
❌ Bearish Case 📉
Break below channel support.
🎯 Target 1: 1.1450
🎯 Target 2: 1.1300
Current Levels to Watch
Resistance 🔴: 1.1930
Major Resistance 🔴: 1.2050 – 1.2100
Support 🟢: 1.1500 – 1.1550
Major Support 🟢: 1.1400
⚠️ Disclaimer: This analysis is for educational purposes only. It is not financial advice.
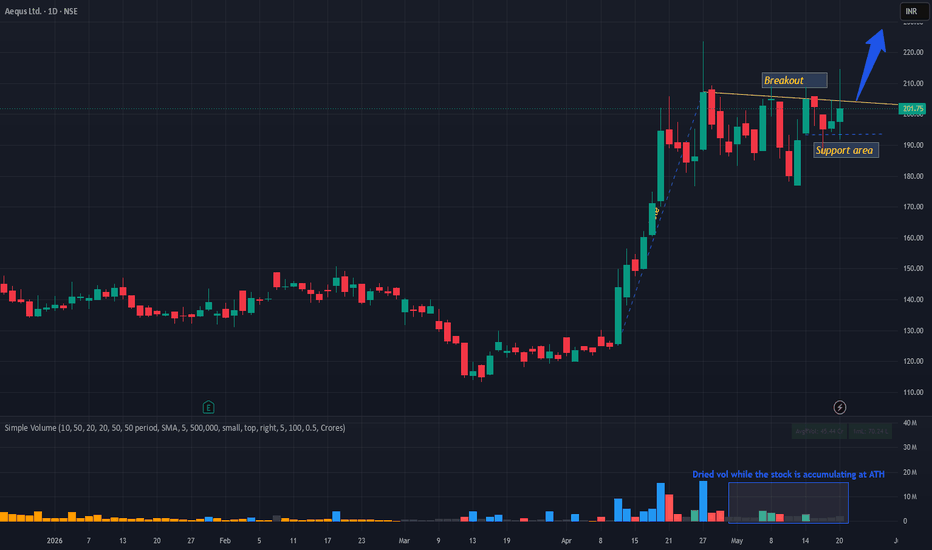
Amer Sports ($AS) Breakout: Bull Flag Measured Move to $48NYSE:AS is printing a textbook continuation pattern.
After a 30% rally, the stock is catching its breath in a tight flag.
Volume is drying up on the consolidation—exactly what you want to see before the next leg up.
Every young fashionable Girl is wearing Salomons, and the chart is reflecting it.
#BullFlag, #Breakout, #Gorpcore, #GrowthStocks
Synopsys May Be FlaggingSynopsys has sputtered for more than two years, and some traders may see risk of a push to the downside.
The first pattern on today’s chart is the series of higher lows since mid-November. SNPS has held that line without significant bounces, which could suggest support is at risk of breaking.
Second, the 50-day simple moving average (SMA) had a “death cross” below the 200-day SMA in October. The 8-day exponential moving average (EMA) crossed below the 21-day EMA in late January and has remained there since. Those signals may reflect bearishness in the long and short terms.
Third, stochastics are turning lower.
Finally, there’s the drop between January 29 and February 4. The chip-software company retraced no more than half that move before stalling at the 21-day EMA, which may confirm a downward direction.
TradeStation has, for decades, advanced the trading industry, providing access to stocks, options and futures. If you're born to trade, we could be for you. Learn more here about TradingView’s Broker of the Year!
Past performance, whether actual or indicated by historical tests of strategies, is no guarantee of future performance or success. There is a possibility that you may sustain a loss equal to or greater than your entire investment regardless of which asset class you trade (equities, options or futures); therefore, you should not invest or risk money that you cannot afford to lose. Online trading is not suitable for all investors. View the document titled Characteristics and Risks of Standardized Options at www.TradeStation.com . Before trading any asset class, customers must read the relevant risk disclosure statements on www.TradeStation.com . System access and trade placement and execution may be delayed or fail due to market volatility and volume, quote delays, system and software errors, Internet traffic, outages and other factors.
Securities and futures trading is offered to self-directed customers by TradeStation Securities, Inc., a broker-dealer registered with the Securities and Exchange Commission and a futures commission merchant licensed with the Commodity Futures Trading Commission). TradeStation Securities is a member of the Financial Industry Regulatory Authority, the National Futures Association, and a number of exchanges.
TradeStation Securities, Inc. and TradeStation Technologies, Inc. are each wholly owned subsidiaries of TradeStation Group, Inc., both operating, and providing products and services, under the TradeStation brand and trademark. When applying for, or purchasing, accounts, subscriptions, products and services, it is important that you know which company you will be dealing with. Visit www.TradeStation.com for further important information explaining what this means.
BNT to $27 in 4000% moveOn the above 12 day chart price action has corrected 96% from $9 in early 2021. A number of reasons now exist for a bullish outlook. They include:
1) Price action and RSI resistance breakouts.
2) Support on past resistance, look left.
3) That bull flag forecasts a 4000% move and more to $25 area.
Is it possible price action continues downtrend? Sure.
Is it probable? No.
Ww
Type: trade
Risk: you decide
Timeframe for long: remainder of this month
Return: Lambo
Amazon.com Has Fallen. Can it Get Up?Amazon.com fell sharply last month, and some traders may see further downside risk.
The first pattern on today’s chart is the drop on February 6 after earnings missed estimates.
The e-commerce giant has yet to recover from that decline, which may reflect negative sentiment.
Second is the low of $220.38 immediately before the drop. AMZN rebounded to stall at that level on March 5. Has old support become new resistance?
Third, a series of higher lows in the last few weeks may be viewed as a potentially bearish flag.
Fourth, stochastics are turning down from an overbought condition.
Next, the 8-day exponential moving average (EMA) has remained stubbornly below the 21-day EMA. The 50-day simple moving average (SMA) also had a “death cross” below the 200-day SMA. Those patterns may reflect bearishness in the short and long terms.
Finally, AMZN is a highly active underlier in the options market. (Its average daily volume of 886,500 contracts ranks fourth in the S&P 500, according to TradeStation data.) That could help traders take positions with calls and puts.
TradeStation has, for decades, advanced the trading industry, providing access to stocks, options and futures. If you're born to trade, we could be for you. See our Overview for more.
Past performance, whether actual or indicated by historical tests of strategies, is no guarantee of future performance or success. There is a possibility that you may sustain a loss equal to or greater than your entire investment regardless of which asset class you trade (equities, options or futures); therefore, you should not invest or risk money that you cannot afford to lose. Online trading is not suitable for all investors. View the document titled Characteristics and Risks of Standardized Options at www.TradeStation.com . Before trading any asset class, customers must read the relevant risk disclosure statements on www.TradeStation.com . System access and trade placement and execution may be delayed or fail due to market volatility and volume, quote delays, system and software errors, Internet traffic, outages and other factors.
Securities and futures trading is offered to self-directed customers by TradeStation Securities, Inc., a broker-dealer registered with the Securities and Exchange Commission and a futures commission merchant licensed with the Commodity Futures Trading Commission). TradeStation Securities is a member of the Financial Industry Regulatory Authority, the National Futures Association, and a number of exchanges.
Options trading is not suitable for all investors. Your TradeStation Securities’ account application to trade options will be considered and approved or disapproved based on all relevant factors, including your trading experience. See www.TradeStation.com . Visit www.TradeStation.com for full details on the costs and fees associated with options.
Margin trading involves risks, and it is important that you fully understand those risks before trading on margin. The Margin Disclosure Statement outlines many of those risks, including that you can lose more funds than you deposit in your margin account; your brokerage firm can force the sale of securities in your account; your brokerage firm can sell your securities without contacting you; and you are not entitled to an extension of time on a margin call. Review the Margin Disclosure Statement at www.TradeStation.com .
TradeStation Securities, Inc. and TradeStation Technologies, Inc. are each wholly owned subsidiaries of TradeStation Group, Inc., both operating, and providing products and services, under the TradeStation brand and trademark. When applying for, or purchasing, accounts, subscriptions, products and services, it is important that you know which company you will be dealing with. Visit www.TradeStation.com for further important information explaining what this means.
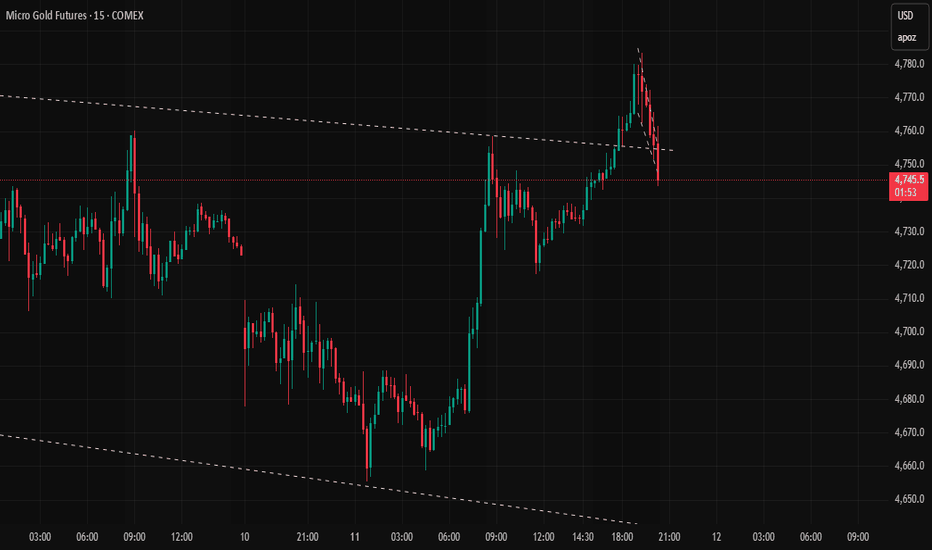
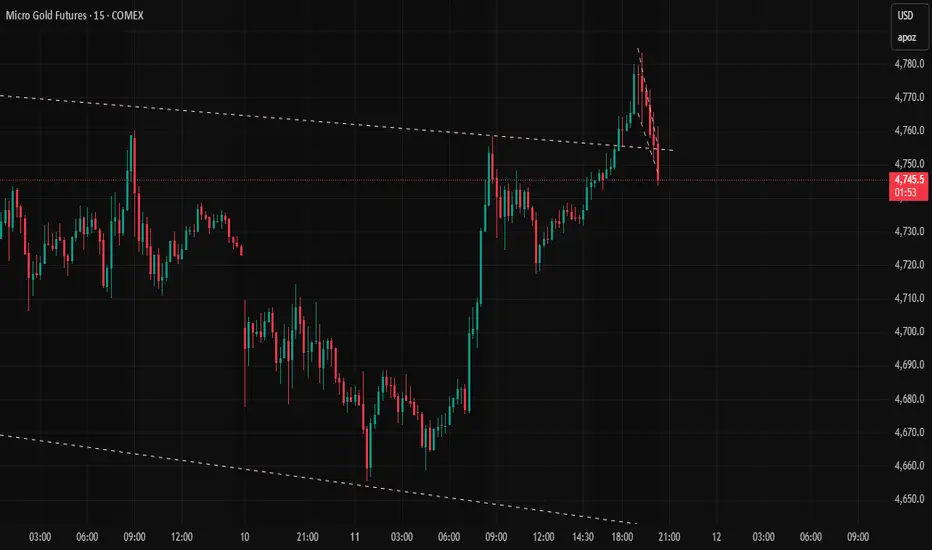
Gold Bear Flag Inside Major Channel – 4400 Next?Gold is currently approaching an important technical area on the chart. In this breakdown I walk through the key structure developing, the levels traders should be watching closely, and how this setup fits into the broader market context.
We’ll also briefly look at the macro backdrop that could influence how price reacts around these levels.
Watch the chart closely as this structure develops — the next move could be decisive.
Aussie Holds Firm as RBA Path Anchors SentimentAUD/USD held a strong tone on March 10 as investors continued to weigh the Reserve Bank of Australia’s policy outlook against a rocky U.S. macro backdrop – and hope that the U.S.-Israel war against Iran will conclude soon. The RBA’s February rate increase to 3.85% and persistent inflation pressures have kept markets alert to the possibility of additional tightening if price growth proves sticky. Recent sentiment indicators in Australia showed a modest rebound in consumer confidence, though readings remain below neutral as higher fuel costs and geopolitical tensions weigh on household outlooks.
In the above chart, AUD/USD rates may have started the next leg higher in a bullish breakout. Recent choppiness found support in the form of the 2024 high near 0.6943. Price action took the form of a bull flag – breaking out, retesting the breakout, and consolidating in a range before continuing to fresh yearly highs today – adds evidence to support that view. Momentum is building to the topside anew, with each of the 5-day, 20-day, 50-day, and 100-day exponential moving averages (EMA) securing positive rates of change. The 2023 high at 0.7158, as a last hurdle to clear before the bull flag breakout is validated, potentially seeking a measured move north of 0.7230.
KSE100 KSE-100 Index MARI OGDC PPL – Technical Update
The KSE-100 Index on both 1H and Daily timeframes formed a Bearish Flag, and the downside target from this structure has almost been achieved.
However, a Bullish Divergence is now appearing on the charts, suggesting that selling momentum may be weakening, which could lead to a short-term recovery move.
Key Levels to Watch
Support Zone: 145,000 ±
Critical Low: 144,000
If this support zone holds, we may see a fast recovery rally in the index.
Accumulation Strategy – Energy Sector
Due to uncertain global markets and war-like geopolitical conditions, energy exploration companies may recover faster as commodities remain sensitive to global developments.
Accumulation Zones:
Pakistan Petroleum Limited (PPL) – 194 to 200
Mari Petroleum Company Limited (MARI) – around 574
Oil and Gas Development Company (OGDC) – 256 ±
These stocks could lead the recovery once the **KSE-100 Index stabilizes at support.
Risk Management
Buy in portions as discussed earlier instead of entering full positions at once.
If the support breaks, we will update again with fresh levels and guidance on what and when to buy next.
Disclaimer:
Smart Money AR provides this analysis strictly for educational and informational purposes. It does not constitute financial advice. Traders are responsible for their own decisions.
AUDNZD: Valid Bull Flag?! 🇦🇺🇳🇿
AUDNZD violated a resistance line of a bullish flag pattern
on a 4H time frame.
I expect a bullish trend continuation now.
Goal will be 1.195
❤️Please, support my work with like, thank you!❤️
I am part of Trade Nation's Influencer program and receive a monthly fee for using their TradingView charts in my analysis.
Kraft Heinz: Potential Bear FlagKraft Heinz has been falling for years, and some traders may see further downside in the consumer staples giant.
The first pattern on today’s chart is the series of higher lows since late January. KHC closed below that rising line yesterday, which could be viewed as a bear-flag breakdown.
Second, the 50-day simple moving average (SMA) has remained below the 100-day SMA. You also have a series of lower highs since October. Those signals may reflect a longer-term downtrend.
Prices are under the 21-day exponential moving average (EMA) and MACD just turned lower. That may be consistent with short-term bearishness.
Finally, KHC made a six-year low of $21.99 on January 21. Could investors expect a retest of that level?
TradeStation has, for decades, advanced the trading industry, providing access to stocks, options and futures. If you're born to trade, we could be for you. Learn more here about TradingView’s Broker of the Year!
Past performance, whether actual or indicated by historical tests of strategies, is no guarantee of future performance or success. There is a possibility that you may sustain a loss equal to or greater than your entire investment regardless of which asset class you trade (equities, options or futures); therefore, you should not invest or risk money that you cannot afford to lose. Online trading is not suitable for all investors. View the document titled Characteristics and Risks of Standardized Options at www.TradeStation.com . Before trading any asset class, customers must read the relevant risk disclosure statements on www.TradeStation.com . System access and trade placement and execution may be delayed or fail due to market volatility and volume, quote delays, system and software errors, Internet traffic, outages and other factors.
Securities and futures trading is offered to self-directed customers by TradeStation Securities, Inc., a broker-dealer registered with the Securities and Exchange Commission and a futures commission merchant licensed with the Commodity Futures Trading Commission). TradeStation Securities is a member of the Financial Industry Regulatory Authority, the National Futures Association, and a number of exchanges.
TradeStation Securities, Inc. and TradeStation Technologies, Inc. are each wholly owned subsidiaries of TradeStation Group, Inc., both operating, and providing products and services, under the TradeStation brand and trademark. When applying for, or purchasing, accounts, subscriptions, products and services, it is important that you know which company you will be dealing with. Visit www.TradeStation.com for further important information explaining what this means.
USDJPY: Strong Bullish Pattern 🇺🇸🇯🇵
There is a high probability that USDJPY will continue rising,
following a confirmed bullish breakout of a resistance line of a flag pattern.
Expect a rise at least to 157.8 level.
❤️Please, support my work with like, thank you!❤️
I am part of Trade Nation's Influencer program and receive a monthly fee for using their TradingView charts in my analysis.
GBPCHF: Bearish Move From Trend Line 🇬🇧🇨🇭
GBPCHF will likely drop lower after a test of a solid
falling trend line on a daily.
I expect a bearish continuation at least to 1.038 level.
❤️Please, support my work with like, thank you!❤️
I am part of Trade Nation's Influencer program and receive a monthly fee for using their TradingView charts in my analysis.
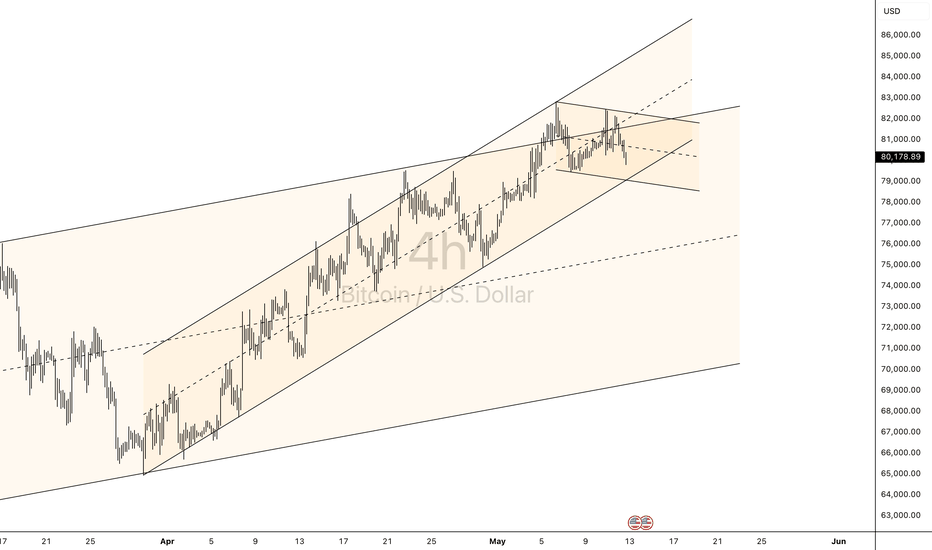
BTC ???BTC is not sure what he wants.
So far i see 2 possible scenarios
1)consolidation, we move to upper band and then reverse down
2)Bear FLAG projection line of possible price target of reversal and rally before major correction to lower lever for BTC 35-40k$.
In here it is difficult to predict any kind of direction. So we will se how the price will develop in next weeks.
Be safe!
Silver to $50On the above monthly chart Silver has corrected over 35% since the year began. A number of reasons now exist to begin accumulation. Why?
1) A ‘incredible buy’ signal prints. See weekly chart below. Not since September 2018 has such a strong signal like this printed.
2) A strong Dragonfly DOJI candle printed with the close of July. This told us $18 was very strong support.
3) Price action is printing within a bull flag. It could be another year before a breakout is seen, however, long positions opened between $18 and $20 should see great returns with the Bull flag Flagpole measuring out at $50.
4) Lastly the monthly Gaussian Channel (below), which has recently changed to green. Prior to publishing this idea confirmation of support on the medium line as in 2009 was required.
Is it possible price action falls further? For sure.
Is it probable? No.
Ww
Type: trade, <$20 is fantastic
Risk: <=6% of portfolio
Timeframe: 1 - 2 years
Return: $50 then $150 if $50 becomes support
Weekly chart
Monthly Gaussian channel
Nike May Be StaggeringNike has been staggering for months, and some traders may see downside risk.
The first pattern on today’s chart is the series of higher lows since late December. The footwear company closed below that line yesterday, which could be interpreted as a bear-flag breakdown.
Second, the series of lower highs since late 2025 (marked with yellow arrows) may reflect a longer-term downtrend.
Third, the 50-day simple moving average (SMA) had a “death cross” below the 200-day SMA in November. That could also reflect long-term weakness.
Fourth, the 8-day exponential moving average (EMA) is below the 21-day EMA. Does that signal short-term bearishness?
Next, some traders may expect prices to revisit their seven-year low at $52.28.
Finally, NKE is an active underlier in the options market. (It averages about 90,000 contracts per session, according to TradeStation data.) That could help traders take positions with calls and puts.
TradeStation has, for decades, advanced the trading industry, providing access to stocks, options and futures. If you're born to trade, we could be for you. See our Overview for more.
Past performance, whether actual or indicated by historical tests of strategies, is no guarantee of future performance or success. There is a possibility that you may sustain a loss equal to or greater than your entire investment regardless of which asset class you trade (equities, options or futures); therefore, you should not invest or risk money that you cannot afford to lose. Online trading is not suitable for all investors. View the document titled Characteristics and Risks of Standardized Options at www.TradeStation.com . Before trading any asset class, customers must read the relevant risk disclosure statements on www.TradeStation.com . System access and trade placement and execution may be delayed or fail due to market volatility and volume, quote delays, system and software errors, Internet traffic, outages and other factors.
Securities and futures trading is offered to self-directed customers by TradeStation Securities, Inc., a broker-dealer registered with the Securities and Exchange Commission and a futures commission merchant licensed with the Commodity Futures Trading Commission). TradeStation Securities is a member of the Financial Industry Regulatory Authority, the National Futures Association, and a number of exchanges.
Options trading is not suitable for all investors. Your TradeStation Securities’ account application to trade options will be considered and approved or disapproved based on all relevant factors, including your trading experience. See www.TradeStation.com . Visit www.TradeStation.com for full details on the costs and fees associated with options.
Margin trading involves risks, and it is important that you fully understand those risks before trading on margin. The Margin Disclosure Statement outlines many of those risks, including that you can lose more funds than you deposit in your margin account; your brokerage firm can force the sale of securities in your account; your brokerage firm can sell your securities without contacting you; and you are not entitled to an extension of time on a margin call. Review the Margin Disclosure Statement at www.TradeStation.com .
TradeStation Securities, Inc. and TradeStation Technologies, Inc. are each wholly owned subsidiaries of TradeStation Group, Inc., both operating, and providing products and services, under the TradeStation brand and trademark. When applying for, or purchasing, accounts, subscriptions, products and services, it is important that you know which company you will be dealing with. Visit www.TradeStation.com for further important information explaining what this means.