USDJPY - 4H - ShortWhen changing the structure to the Daily frame, the price left a large GAP, which is a magnet for the price. On the weekly time frame, we have several reasons for the price to fall in a downward direction, namely the presence of a Gartley pattern, as well as the creation of many equilibrium levels in a downward direction and in the range of 148-151 price levels. On the H4, we have a nice impulse candle whose Take Profit coincides perfectly with the POC zone, as well as demand at a price of 152,8
Gartley
3 USDCHF Trades You Can Link TogetherIn this video, we break down three trading opportunities on USDCHF—two of which can be strategically combined. We start with a structure-based continuation trade, followed by a potential bearish Gartley pattern. What makes this setup unique is the overlap: the Gartley entry aligns with the structure trade’s target, creating an opportunity for a stop-and-reverse transition from one trade to the next. To round things out, we zoom out to the bigger picture and highlight a potential violation-and-ru
USDJPY at Key Resistance: A Simple Price Action SetupOn USDJPY, we’re seeing a straightforward price action and structure-based trading opportunity develop. Price is currently approaching a previous level of structure resistance, an area where the market has stalled in the past.
If price is able to violate this resistance level, it would provide additional confirmation that buyers are in control and that a continuation move higher is likely. In that scenario, the next objective becomes the next relevant level of structure, where price has previou
Elloit wave DXY 1/31/2026In my view, the DXY is likely to experience one final impulsive move toward the 127 level before entering a broader bearish phase. This outlook is supported by three main reasons.
1. Macro Elliott Wave Structure
From a long-term perspective, DXY completed wave Ⓐ at the end of 1992 and is currently in wave Ⓑ.
Zooming into wave Ⓑ, we can see that wave (b) retraced approximately 101%–123.6% of wave (a). As a result, this suggests that wave (c) should extend to around 101%–161.8% of wave (a) in or
Harmonics in Godrej PropertiesThe monthly chart of Godrej Properties Ltd is currently forming a well‑defined bullish Bat harmonic pattern, indicating a potential long‑term reversal zone near ₹1,476.80. The structure follows the classic Bat geometry, with each leg aligning closely to ideal Fibonacci ratios: the AB leg retraces approximately 62.6% of the XA move, the BC leg retraces 40.3% of AB, and the CD leg extends 170.2% of BC while retracing 80.3% of XA. These ratios confirm the integrity of the Bat pattern.
Point D, whe
DXY (Dollar index) - 1D - LongThe dollar index is in a strong Demand zone and forms a reversing Gartley formation, which left behind quite a few gaps and equilibrium zones that the price did not recover and is expected to make a corrective upward movement to the daily OTE zone and then continue its downward movement.
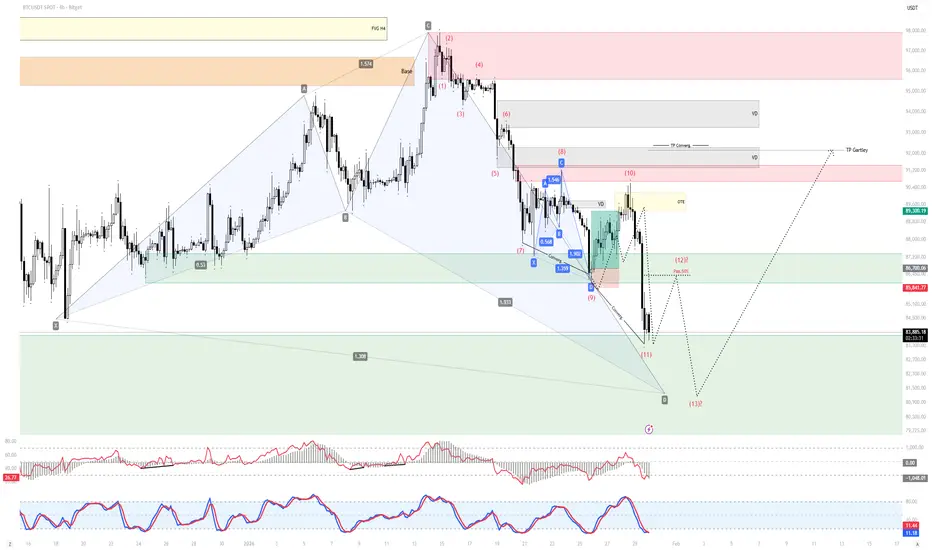
BTCUSDT - 4H - LongBitcoin perfectly fulfilled the initial forecast until pullback 10 and now we expect it to complete pullback 11 and start pullback 12, which coincides with a test of broken demand and equilibrium zone. From there, it will make another /final/ impulse to pullback 13, which coincides with strong Demand, which in turn validates the Gartley formation and execute in an upward direction to $92,000, which coincides with unbalanced zones.
NZDCHF - 1D - LongThe price executed a perfect Head and Shoulders pattern, then reacted from the 50% equilibrium zone, which pushed the price into a correction that coincided with a perfect test of the Head and Shoulders pattern. I expect the price to test in the downward direction to test the 50% equilibrium zone and from there to continue its upward movement to execute the BB, as well as reach the first target zone of Supply and close imbalances in the upward direction, as well as pursue a high target on the Go
USDCHF - 4H - LongThe price perfectly fulfilled the initial forecast until reaching the target of BB, which coincides perfectly with the Demand zone and OV. From here we expected a reaction in the upward direction for a correction and the first target is the Supply zone, after which we expect it to be broken and continue in the upward direction until reaching the OTE zone + closing the Gap above the Supply zone.
Dow Jones Trend Continuation: Advanced Pattern, Simple TradeWe’re on the Dow, and the trend is bullish. You don’t need indicators to see it—just look at price. We recently had a breaking close above the previous high, followed by consolidation. That matters, because advanced patterns tend to form during pauses in the market, not during explosive moves.
Inside this consolidation, we can map out a potential bullish Gartley pattern. Because this pattern is forming within an uptrend, it can also be used as a trend continuation setup as well.
3 Ways to Tra
What is Harmonic XABCD Pattern and How to Identify It Easily
In the today's article, we will discuss the absolute basics of harmonic trading: I will explain to you what is harmonic ABCD pattern and how to recognize it, using fibonacci ratios.
The foundation of harmonic trading is impulse leg.
Impulse leg is a strong, directional bullish or bearish movement.
Harmonic traders perceive a price chart like a combination of impulse legs.
Here are the impulse legs on AUDUSD on a daily time frame. All these impulses are significant bullish or b
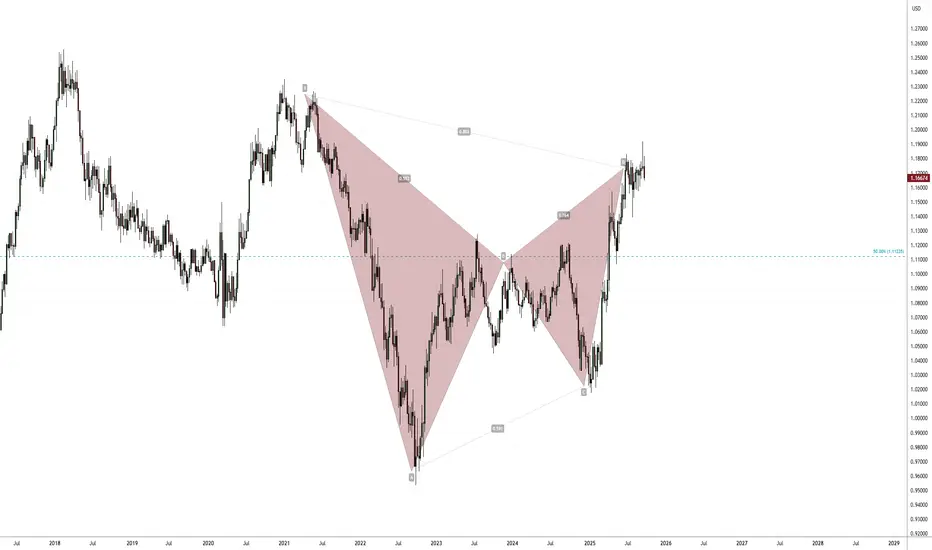
The Gartley at play? EUR/USD making a move...I have been building short positions since end of June/early July based on my original trade idea (which is still open)
....However, I noticed a potential harmonic pattern on the weekly about 3 weeks ago and this strengthened my conviction to keep and add additional shorts when we consolidated around the 1.1800+ price zone.
Although I am a chart pattern trader, I'm not a traditional harmonic trader but certain price action stands out to me and this looks like one playing out.
If this does qu
USOIL - Type II Bulish GartleyUSOIL is completing a Bullish Gartley at the 0.786 retracement (56.70–57.30), positioned inside a strong demand zone and supported by RSI divergence + VPVR low-volume rejection.
Expectation:
A bullish reversal targeting mean reversion toward 60.00–61.00.
Entry:
Buy inside 56.70–57.30 (aggressive) or wait for bullish confirmation (conservative).
Stop Loss:
56.20–56.60 below PRZ and demand invalidation.
Targets:
TP1: 59.20–59.60
TP2: 60.80–61.20 (POC magnet)
TP3: 63.00–63.50 (runner)
Ratio
CCAP - good opportunity, normal risk CCAP - EGX30 - Timeframe 1 day
Format a Gartley bullish pattern as follows:
- Entry: 2.45 (current price: 2.39)
- Stop loss: 2.35 (potential loss: 5%)
- First target: 2.73 (potential profit: 10%)
- Second target: 2.98 (potential profit: 20%)
Important notes:
1. Activate the stop loss if it is triggered, as there are lower entry levels for this pattern (down to 1.75).
2. Prices may rebound from this point.
This is not investment advice, only my analysis based on chart data.
USDCAD - A Somewhat Confusing Homerun Trading SetupsTop Trading Idea of the Week #2 is on USDCAD, and it’s a two-part bullish opportunity. It begins with a potential bullish Gartley pattern currently setting up—already a strong technical signal. But what makes this idea particularly compelling is the broader market context. On the higher timeframe, USDCAD has been stuck in a massive consolidation since 2015, and while it isn’t technically forming an ascending triangle, the path of least resistance still appears to be to the upside.
Because of th
EURUSD - why am I bearish on the priceWell, thank you for commenting on my ideas on EURUSD. This is what makes the TradingView community unique.
In one of the comments I learned that I am agains the mainstream believing that EURUSD is not going to continue growing (will not hit the next max after 1.19191 on Sep 15th). In this post I would like to provide arguments for which I am bearish in EURUSD, yet keeping in mind that those are just my humble opinions and as such they can be completely wrong.
So, let's do that:
Argument #0 -