EUR/USD – Bulls Break Out StronglyHi traders, are you waiting for a EUR/USD retest before the next move?
OANDA:EURUSD has broken above the bearish trendline and is currently holding firm above the breakout zone. Price is also trading above the Ichimoku Cloud, indicating that buyers are regaining the upper hand on the H1 timeframe.
The zone I’m watching for a potential pullback is 1.1560–1.1570. If this area holds, I favor further upside:
🎯 Target: 1.1602
Macro factors also support this direction; the USD is weakening
M-pattern
BTC Short SFP 8 hr- All time Fav SetupThe Swing Failure Pattern (SFP) has endless characterizations, and this one here is one of our favorite, which is why it's a short trigger in the strategy shown here. Not only do we have a solid 9 bar OBV down with slope, it's a bearish engulfing 10 previous bars, with a follow through immediately after the signal. ROC 200 is below the zero line and in white territory which means the consolidation has been lengthy and fully exhausted; it’s in the zone for the real move to present.
This is a si
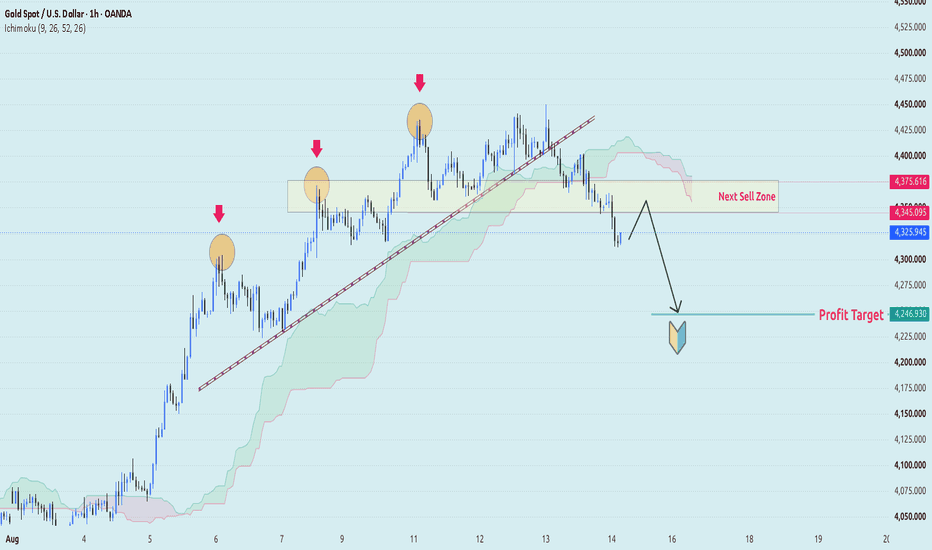
XAU/USD - Trendline Broken, Sellers Pull Back 4,240Good day Traders, is this trendline break a pullback or the start of a deeper correction?
After a series of clear higher highs, OANDA:XAUUSD has broken down the ascending trendline and is currently trading below the Ichimoku cloud. To me, this signals that short-term momentum has shifted to the sellers.
The 4,345–4,375 region is currently a key area to watch if the price rebounds. If buyers fail to reclaim this area and a rejection occurs, I still favor a further decline to:
🎯 Target: 4,
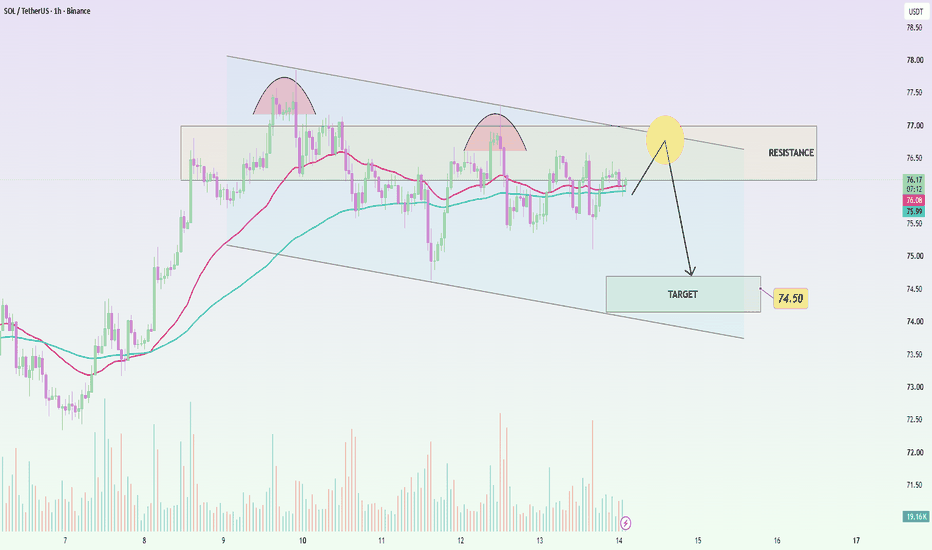
SOLUSDT: Recovery stalls, Bears remain in controlSOLUSDT is trading around 76.08 USDT, moving largely sideways after multiple failed attempts to break above the 76.2–77.0 USDT zone. The price remains within a downtrend channel, indicating that buying pressure is insufficient to alter the short-term structure.
The macroeconomic backdrop has actually become less negative; the US Producer Price Index (PPI) for July remained flat—coming in below the forecasted +0.2%—which pushed the probability of a Fed rate hike in September down to approximatel
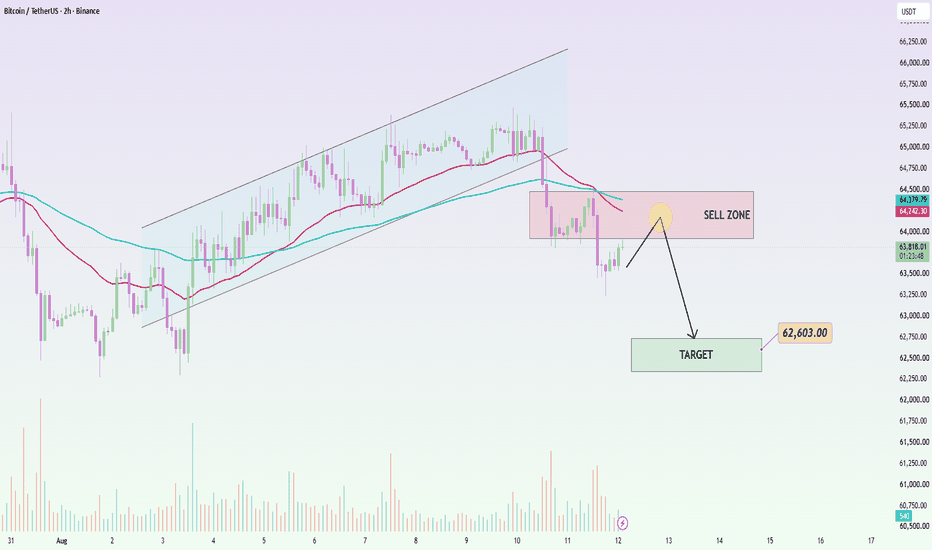
BTCUSDT: Bearish Breakdown, Sellers Continue!Bitcoin is currently trading around 63,850 USDT; the spot price has dropped approximately 174 USD (-0.27%) from the previous session, having touched a low of 63,204 USD earlier today.
Macroeconomic factors favor a bearish scenario as the market cautiously awaits tonight's US CPI data, while the DXY has edged up to around 99.86. Reuters has also noted that Bitcoin and Ethereum are trading sideways ahead of this critical inflation data.
On the 2-hour (H2) chart, BTCUSDT has broken below the risi
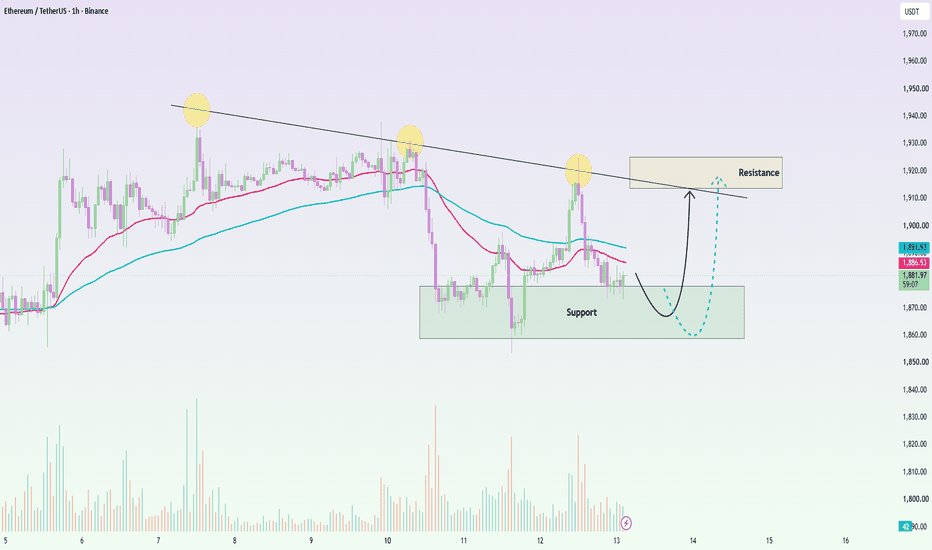
ETHUSDT: Support Holds, Potential Rebound 1,920ETHUSDT is trading around 1,882 USDT after repeatedly showing a positive reaction at the 1,860–1,880 support zone.
Macroeconomic factors are slightly supportive of a recovery scenario, as the recently released US CPI data met expectations, easing concerns about further Federal Reserve interest rate hikes.
On the 1-hour (H1) chart, ETH remains below the EMA34/EMA89 and the downtrend line; therefore, the current upward movement is viewed primarily as a rebound. If buying pressure holds at the 1,
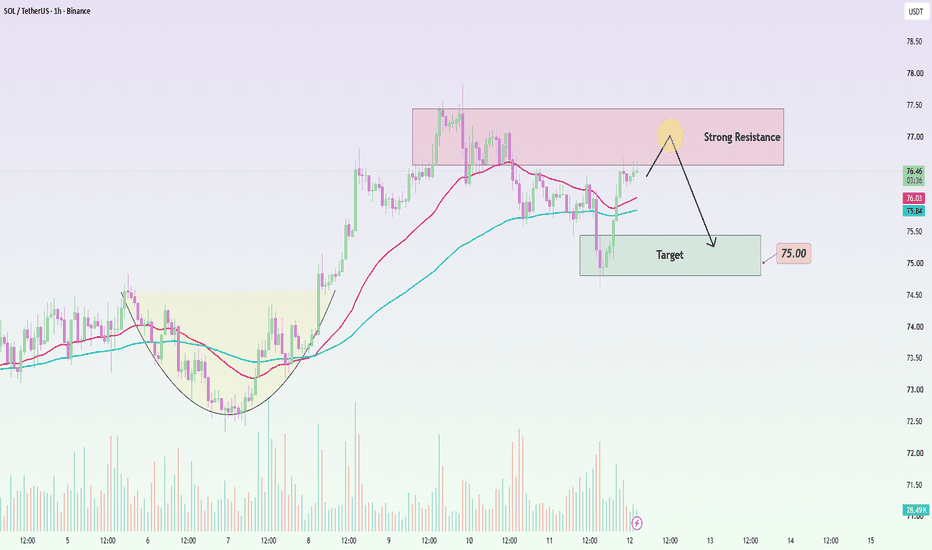
SOLUSDT: Facing strong resistance, potential pullbackSOLUSDT is currently trading around 76.58 USDT; the H1 candle shows a slight gain of approximately 0.18% as the price retests the 76.60–77.40 resistance zone.
Macro factors favor a corrective scenario, as the crypto market remains cautious ahead of tonight's US CPI release. The USD edged up during the Asian session, while Bitcoin and Ethereum have yet to show a clear "risk-on" sentiment.
From a technical perspective, SOL has faced repeated rejection around the 77 level. If the price fails to b
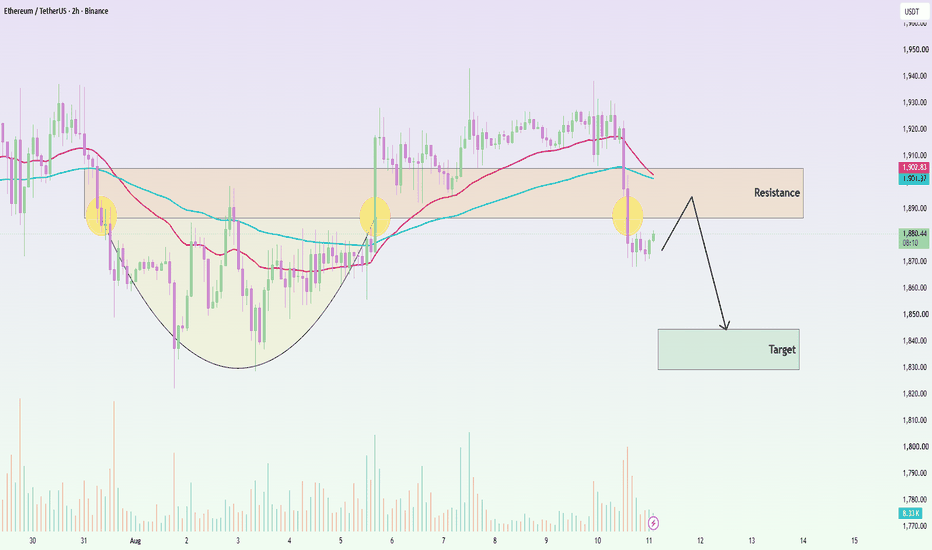
ETHUSDT: Bears remain active, breakdown underwayETH is trading around 1,880 USDT—up slightly by about $7 (+0.38%) for the day—but remains significantly below the previous 1,920–1,930 range.
Macro factors currently favor a bearish scenario. Bitcoin is down over 1%, while the US dollar is supported by rising oil prices and market caution ahead of tomorrow's US CPI data. A hotter-than-expected CPI print could revive expectations of Fed rate hikes, placing further pressure on the crypto market.
On the 2-hour (H2) chart, ETH has broken below the
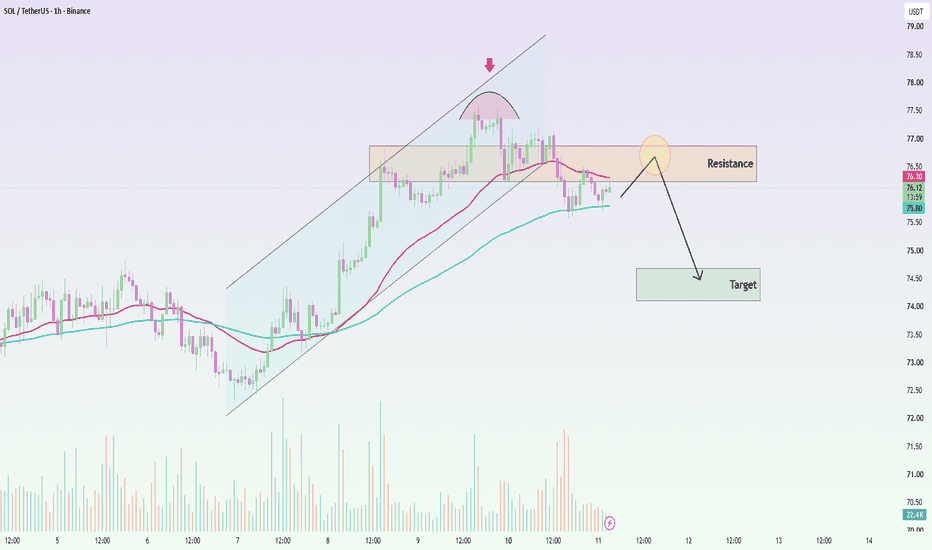
SOLUSDT: Bears in control for the upcoming session!SOLUSDT is trading around 76.14 USDT, having dropped more than 1 USDT from the 77+ level and broken below the H1 bullish channel. The current rebound remains quite weak.
The macroeconomic backdrop also supports a bearish scenario; Bitcoin is down approximately 1.4%, and the crypto market remains cautious ahead of US CPI data. Rising USD and oil prices are further dampening risk-on sentiment in the short term.
Technically, the 76.30–76.90 USDT zone now acts as a key resistance level, with the p
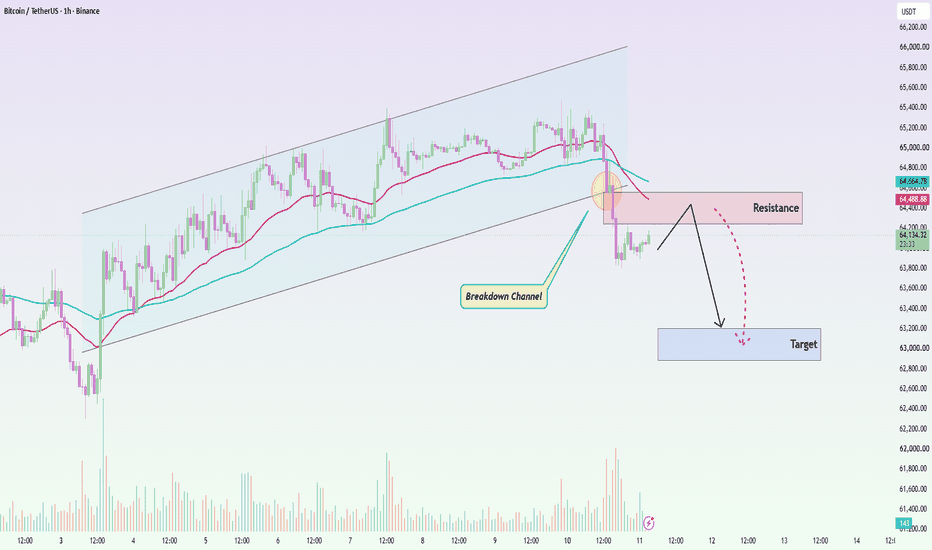
BTCUSDT: Breakdown Channel, Bearish Pressure PersistsBitcoin is trading around $64,080–$64,130, down approximately $932 (1.43%) for the day. The price dipped as low as $63,771 at one point, indicating significant short-term selling pressure.
On the macro front, the market is exercising caution ahead of the US CPI release on August 12. The US dollar has staged a modest recovery as investors trim risk exposure prior to the inflation data, while the probability of a Federal Reserve rate hike in September remains around 50%. These factors are somewha
Solana Breaks Falling Wedge — Is the Next Move $85–86 or $94–96?The market does not reward traders for being early. It rewards those who know when the market has finally confirmed its direction.
BINANCE:SOLUSDT Solana has gone through a relatively long correction after its previous bullish impulse. During this correction, price formed a falling wedge, gradually compressing the market and creating a clear battle between buyers and sellers.
Now, the structure is starting to change.
Price has broken above the falling wedge, and on the lower timeframe we
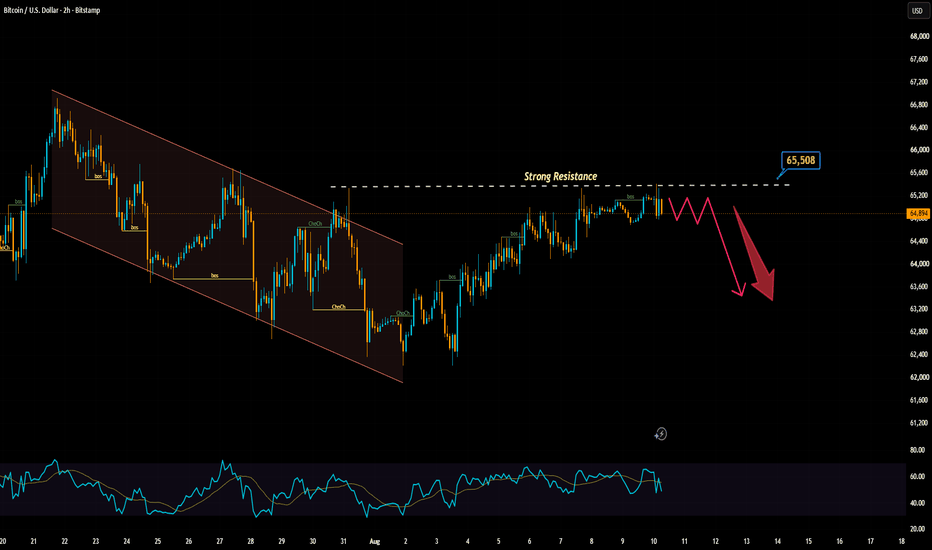
Bitcoin H2 - Bears are determined to start the weekBitcoin is trading around 64,900 USD, up slightly by about 106 USD on the day, but has not yet made a clear breakthrough.
Today's fluctuation range is only in the range of 64,696–65,348 USD, showing that BTC is inclined to accumulate rather than extend the trend.
On H2, Bitcoin recovered well from the $62,400–62,800 zone, but is now repeatedly blocked below the $65,300–65,500 resistance zone. The price continuously tried to break out but could not maintain above, while RSI also turned to cool
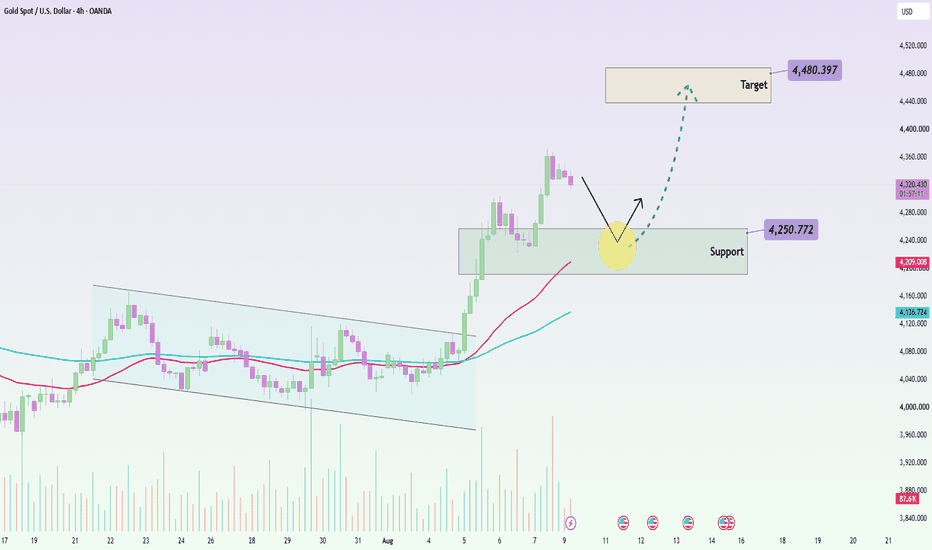
XAUUSD: Pullback Sets The Bulls!Gold is undergoing a correction during the week's opening session following a strong rally late last week. Spot gold has dipped approximately 0.5%—a drop of over $20/oz—to hover around $4,322, quite close to the $4,320 level visible on the chart.
On the other hand, the macroeconomic backdrop has not truly deteriorated for gold. Weak US labor data has lowered expectations for a September Fed rate hike from roughly 67% to 44%, while the USD remains near two-month lows. These factors continue to h
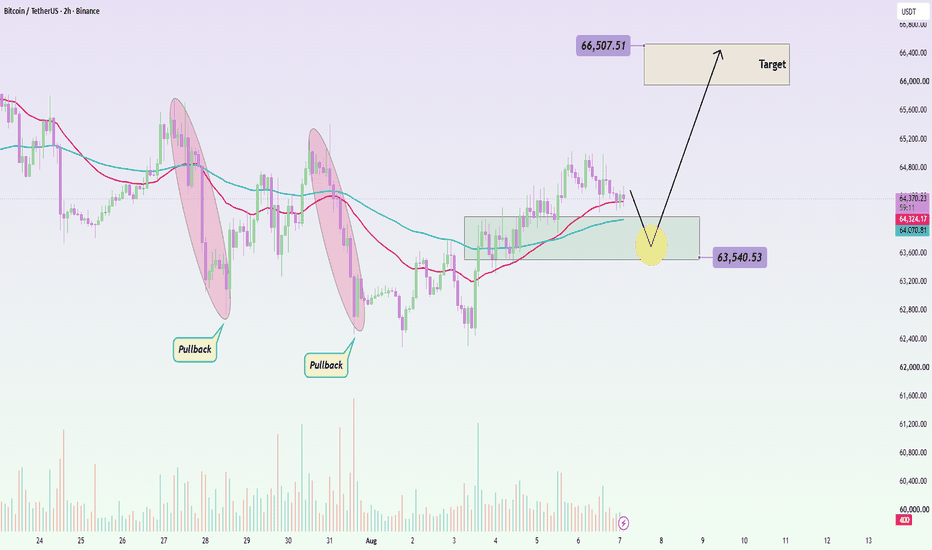
BTCUSDT: Bulls' next move—Strong buying pressure!Bitcoin maintains a positive recovery structure, trading above both the EMA34 and EMA89, with recent lows steadily rising. After touching the 64,800 level, BTCUSDT has begun a minor correction—looking more like a pause than a reversal signal.
I prefer waiting for the price to pull back to the 63,540–64,000 support zone. If this area holds and a bullish rejection candle (long lower wick) or a bullish engulfing pattern appears on the H2 timeframe, buying pressure could return, pushing the price p
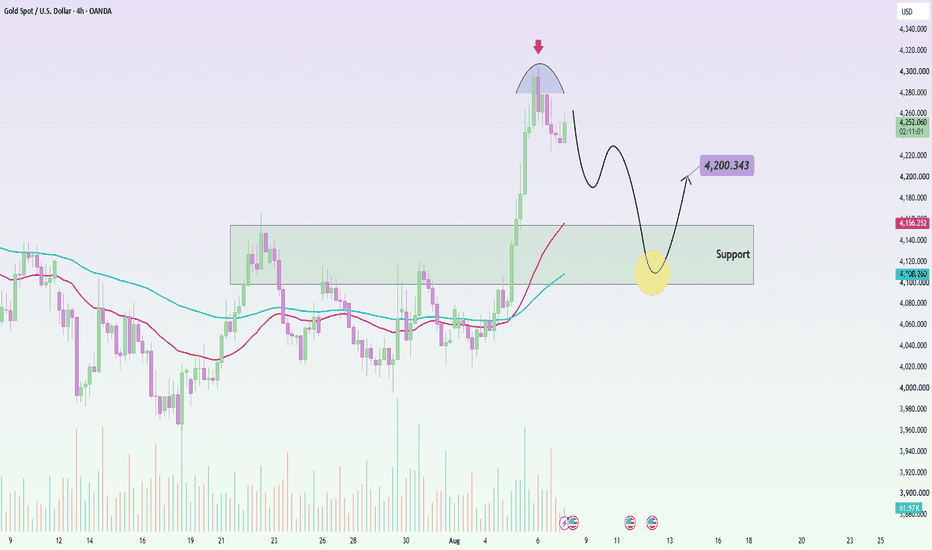
XAUUSD: Bulls Hold the Upper Hand!OANDA:XAUUSD recently surged sharply, nearing the 4,300 level; however, after entering overbought territory, the price has begun to stall as profit-taking pressure emerges.
At current levels, I do not favor chasing the price; instead, I am waiting for a pullback before the next leg up.
From my current perspective, the 4,100–4,160 zone is the most critical area to watch. It serves as both a former support base and sits near a cluster of upward-sloping EMAs.
If XAUUSD retraces to this zone an
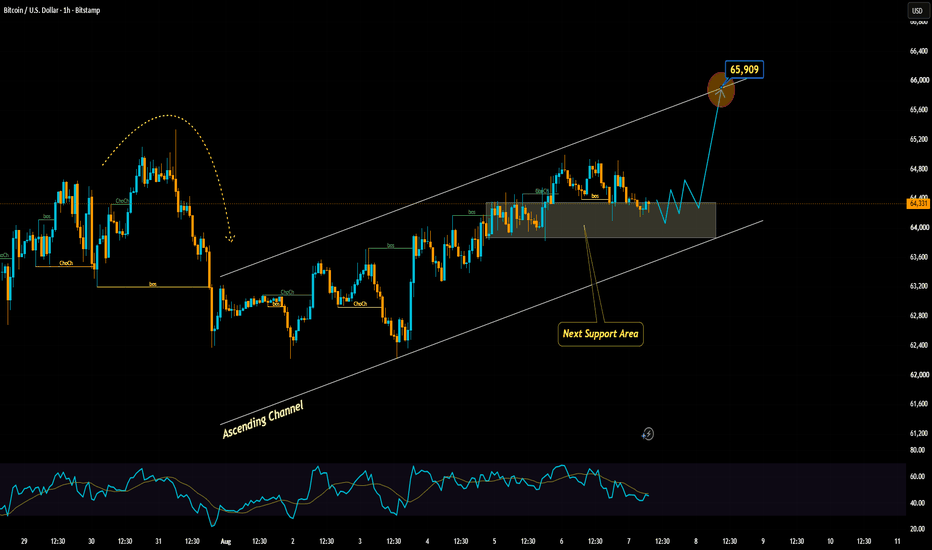
Bitcoin H1: Channel maintains, Buyers gain momentum!Bitcoin is moving sideways around 64,200 after the previous uptrend, but the H1 structure is still quite positive as the price continues to move inside the rising channel.
What I pay most attention to right now is that the 63,900–64,300 zone is still holding well, while the recent corrections have not broken the short-term upward structure.
A better scenario is that BTCUSD retreats further to the support zone, slightly sweeps liquidity and then shows a buying reaction again.
If the price hold
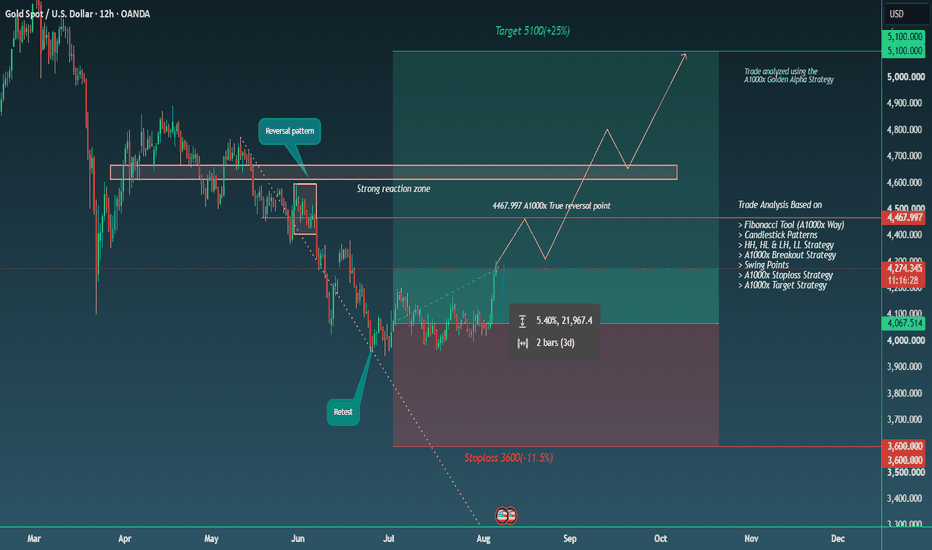
GOLD up 2000+pips, Target 10,000+ pipsHello Traders!
This is once in year trade, Because this is a Mega 10,000 pips trade. We started from 4060 and now it have boosted to 4280. Also those who trade with me should not close the trade too early as we have analyzed the trade with A1000x Golden Alpha strategy and its a target based strategy which means we will hit the Target. Whether its a big or super big target.
On the chart I have mentioned 4467.997 A1000x true reversal point. Its a point where market will react with pinpoint accur
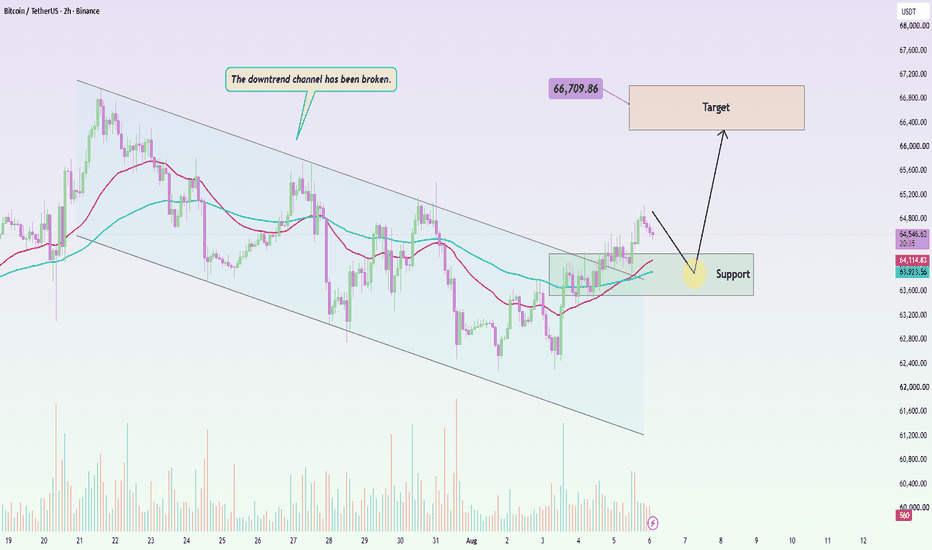
BTCUSDT: Bullish momentum holds, bulls remain in control!BINANCE:BTCUSDT has broken out of the downtrend channel and is holding above both EMA lines, indicating that the short-term structure is shifting in favor of the buyers. The pullback from the 64,800 level currently appears to be a standard post-breakout retest rather than a signal of a bearish reversal.
I prefer waiting for BTCUSDT to retrace to the 63,600–64,150 zone. If the price holds this area and forms a 2H candle with a long lower wick or a bullish engulfing pattern, the former resistan
Bitcoin H2: Breakout opens the way towards 66KBitcoin has escaped the falling channel and is holding the price above the recently broken trend line. This is a positive signal showing that selling pressure is weakening, while the short-term structure is starting to gradually shift towards buyers.
My priority is to wait for a correction to the 63,600–64,100 area. If BTCUSD holds this area and an H2 candle refuses to decline, the breakout zone will be confirmed as new support.
As the price reclaims 64,800, the upside momentum could continue
BTCUSDT: Neckline Breakdown Opens the Way Toward 61,5!BINANCE:BTCUSDT has completed a clear head-and-shoulders structure, with the right shoulder rejected near 65,500 before price broke decisively below the rising neckline. The market is also trading beneath both moving averages around 64,600, confirming that short-term momentum has shifted back to sellers.
A temporary recovery toward 63,900–64,300 would likely represent a retest of the broken neckline rather than a genuine reversal.
Bearish rejection from this area would provide the cleaner con
Gold H1: Resistance keeps the advantage for sellers!The strong recovery from the 4,000 region has brought gold back to an important supply area, but the price still cannot overcome the downward trendline. The rejection reaction around 4,110–4,120 shows that buying power is weakening as it approaches the high price range.
The 4.085–4.115 area continues to be the dominant semi-region. As long as XAUUSD remains below the trendline and has not broken the recent peak, the gradually lower peak structure will still be maintained. RSI is also turning ba
ETHUSDT: Holding the Channel – A Buying Opportunity!BINANCE:ETHUSDT maintains its bullish structure as the price holds above the channel's lower boundary and the EMA cluster around 1,900–1,910.
In my view, the current sideways movement indicates that selling pressure is being absorbed at the support zone rather than resulting in a clear breakdown.
I consider the 1,875–1,905 range a critical buying zone. If ETHUSDT successfully defends this area and closes a 2-hour (H2) candle above 1,920, buyers could extend the recovery toward the 1,975–2,00
AUD H3: Buyers Are Strong at ChannelAUDUSD has returned to the lower boundary of its ascending channel, where the next directional move is likely to begin.
The broader structure remains constructive: price has continued to form higher lows since late June, and the current decline is reaching the same demand zone that previously triggered strong bullish reactions.
The key area is 0.6950–0.6975. This zone overlaps with the rising channel support and the latest structural base, while momentum is already approaching an exhausted con