#TOSHIUSDT #2D (Binance) Big falling wedge break & retest [LONG]TOSHI (Toshi The Cat) first printed a morning star then broke-out of the descending channel, looks bullish mid-term.
Now 50MA support is about to be regained, road towards 100EMA resistance seems next.
⚡️⚡️ #TOSHI/USDT ⚡️⚡️
Exchanges: Binance Futures, Bitget Futures
Signal Type: Regular (LONG)
Leverage: Isolated (3.0X)
Amount: 5.4%
Entry Targets:
1) 0.0001134 - 100.0%
Take-Profit Targets:
1) 0.0001557 - 50.0%
2) 0.0001980 - 50.0%
Stop Targets:
1) 0.0000993 - 100.0%
Trailing Configuration:
S
Morning Star
Morning Star Pattern: Why the Middle Candle Carries the SignalMost traders learn the morning star pattern as a shape: long red candle, small candle, long green candle, buy. That is why so many of these setups fail. The three candles are not equally informative. The first and third only confirm what the chart already showed. Only the star in the middle carries new information.
The evidence on three-candle reversals is real but conditional. A study of every S&P 500 stock from 1992 to 1996 tested eight three-day reversal patterns, the morning star among them,
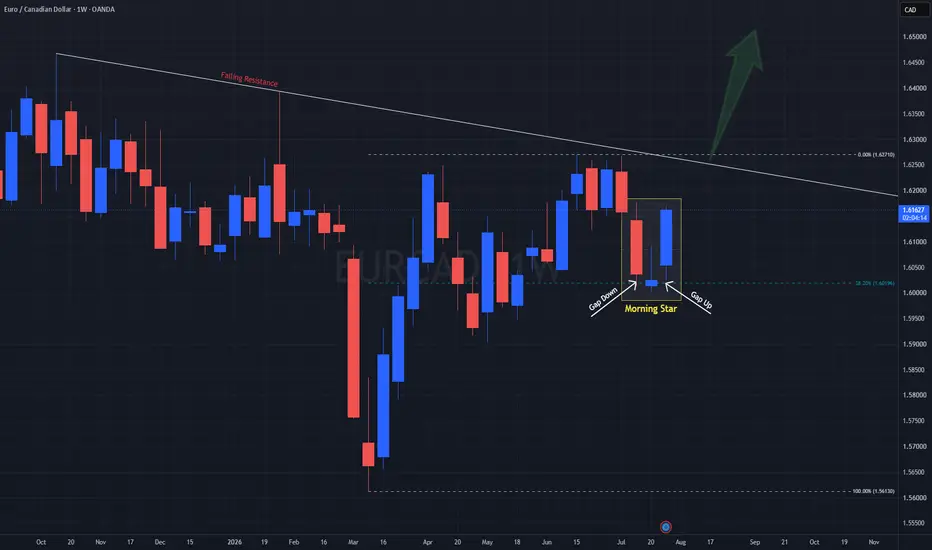
Morning Star Rises On EURCADHere on the Weekly for OANDA:EURCAD , price has formed a strong Bullish reversal pattern called a Morning Star at the 38.2% Retracement Level! This pattern consist of:
1) Large Bearish Candle
2) Small Bullish -or- Doji Candle
3) Large Bullish Candle
There are a couple rules this pattern must follow as well, which are:
- There MUST be a Gap Down from the Close of the First Candle to the Close of the Second Candle.
&
- There MUST be a Gap Up from the Close of the Second Candle to the Open of
Morningstar | MORN | Long at $154.15Technical Analysis
Price for Morningstar NASDAQ:MORN has fallen just below my "crash" simple moving average zone (green lines). The "major crash" zone (gray lines) extends down between $136 - $119 and there is a high possibility the price may dip that low in the near-term (especially to close the last price gap since the pandemic at $115). Long-term, given the potential earnings and revenue growth, it looks undervalued at its current price.
Earnings-Per-Share and Revenue Growth Between
Positive vs Negative Indicators!KSE100 Closed at 154292.26 (18-03-2026)
Higher Highs Lower Lows (Megaphone pattern)
Sustaining 153000 would be a Good Weekly Closing.
However, 157000 - 158000 is a Strong Resistance for now.
Next Important Supports are
S1 around 146300 - 146700
S2 around 135269 - 135500
S3 around 129000 - 132000
Important Resistance Zones:
R1 around 157000 - 158200
R2 around 159900 - 160100
R3 around 165000 - 166000
Positive Points:
> Bullish Divergence on Daily tf.
> Near Golden Pocket Range
> Morning St
S&P500 Is at a Critical Support|The Week’s Direction Starts HereToday, I want to analyze the S&P 500 index( FX:SPX500 ) at the beginning of the new week, because it’s one of the key indices in financial markets. Several assets, especially in the crypto market like Bitcoin ( BINANCE:BTCUSDT ), show strong correlation with it—particularly when the S&P makes sharp moves. So, for analyzing crypto markets, it’s better to have an S&P 500 analysis too. Stay with me.
The S&P 500 is currently moving near a support zone($6,877-$6,837) and support lines. Last week, t
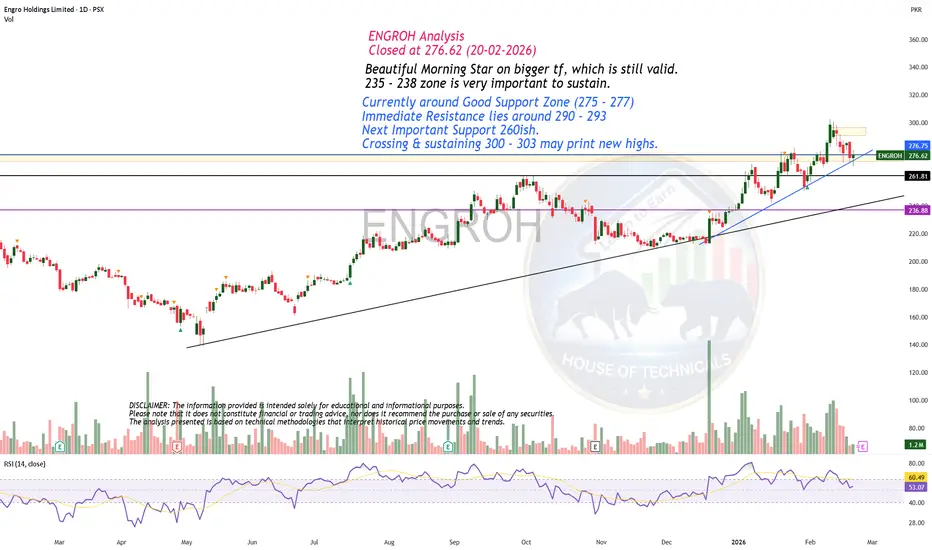
Still Bullish!ENGROH Analysis Closed at 276.62 (20-02-2026)
Beautiful Morning Star on bigger tf, which is still valid.
235 - 238 zone is very important to sustain.
Currently around Good Support Zone (275 - 277)
Immediate Resistance lies around 290 - 293
Next Important Support 260ish.
Crossing & sustaining 300 - 303 may print new highs.
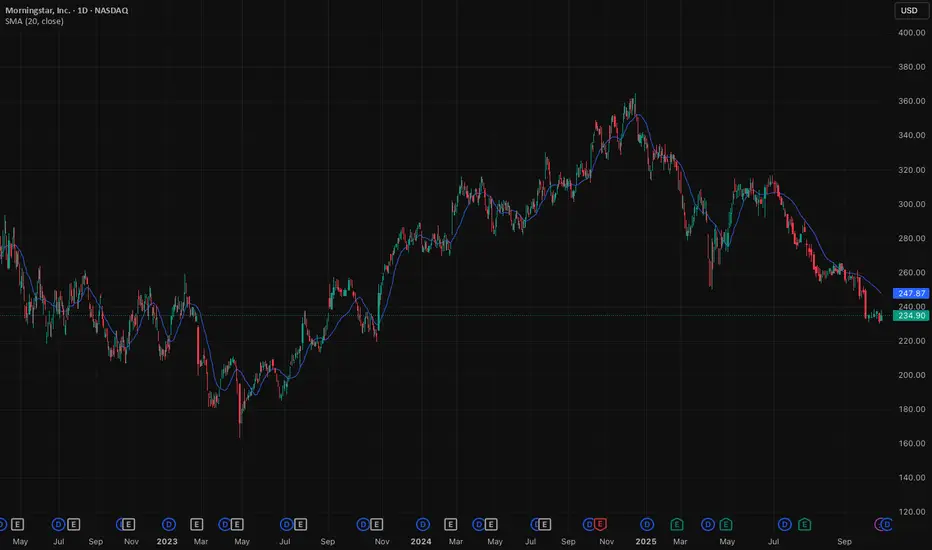
Update to our Morningstar recommendationWe published a short recommendation on NASDAQ:MORN in late September on the basis of the AI distruption being a disruptive catalyst to the business model. The stock is down around 30% since we published our note .
We maintain our bearish thesis over the medium term. Tech and information technology stocks could bounce back after a savage sell-off in recent weeks, but we think the bounce will be temporary. AI is disrupting every knowledge-economy stock, from financial services to legal and so
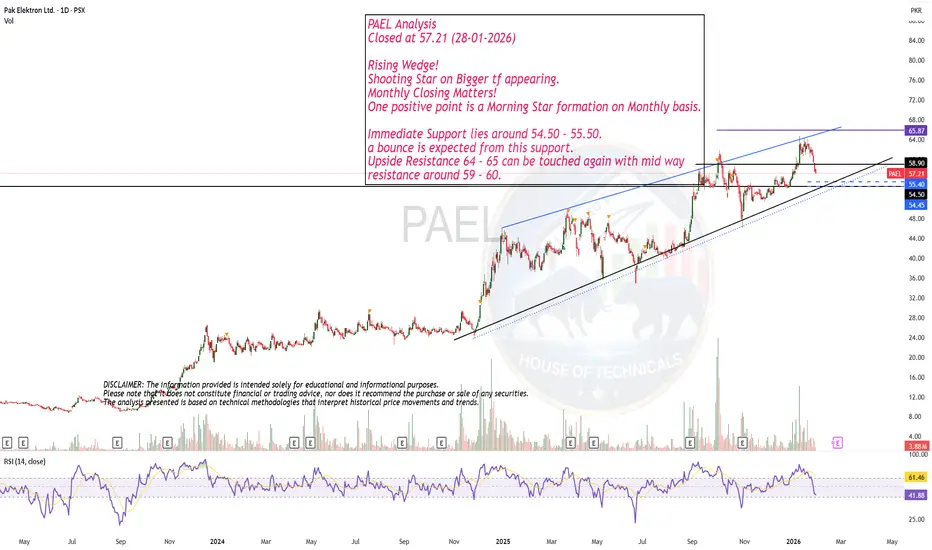
Play on Levels!PAEL Analysis
Closed at 57.21 (28-01-2026)
Rising Wedge!
Shooting Star on Bigger tf appearing.
Monthly Closing Matters!
One positive point is a Morning Star formation on Monthly basis.
Immediate Support lies around 54.50 - 55.50.
a bounce is expected from this support.
Upside Resistance 64 - 65 can be touched again with mid way
resistance around 59 - 60.
#ERAUSDT #1D (Bitget Futures) Descending channel on support LONGCaldera just printed a morning star on daily with good bounce back volume, bottom seems likely.
⚡️⚡️ #ERA/USDT ⚡️⚡️
Exchanges: Bitget Futures
Signal Type: Regular (Long)
Leverage: Isolated (1.3X)
Amount: 4.8%
Current Price:
0.2508
Entry Zone:
0.2503 - 0.2187
Take-Profit Targets:
1) 0.3245
2) 0.3921
3) 0.4598
Stop Targets:
1) 0.1593
Published By: @Zblaba
EURONEXT:ERA BITGET:ERAUSDT.P #1D #Caldera #RaaS #Rollups #DeFi caldera.xyz
Risk/Reward= 1:1.2 | 1:2.1 | 1:3.0
Expected Profit= +49.
Mastering Trend Reversals: Morning & Evening Star PatternsSo, you're trying to nail those trend reversals? The Morning and Evening Star patterns are perfect for that. They show up right when the market’s about to shift, giving you a chance to get in before the move really takes off. Let’s break down how these setups work and why they’re such solid tools for traders like you.
🌅 Morning Star Pattern: The Bullish Reversal
The Morning Star pattern is one of the best ways to catch a trend reversal from bearish to bullish. It usually pops up after a d
The 3-Step Rocket Booster Strategy + Morning Star Chart PatternWhen you look at this chart pattern
for this forex pair OANDA:AUDCAD
What do you see??
Well you will see the Rocket booster strategy.
What is the rocket booster strategy?
Its a trading strategy that has 3 steps:
1-The price has to be above the 50 EMA
2-The price has to be above the 200 EMA
3-The price action should gap up
Now on the last step think of this step
as the price action step
If you look at this chart you
will see something
called the Morning Star candlestick chart
#GASUSDT #1D (ByBit) Falling broadening wedge breakout & retestNeoGas printed a golden cross on daily and a morning star at the same time, just like last year.
Also formed a triangle, seems likely to bounce on 200MA support then break bullish in the coming weeks.
⚡️⚡️ #GAS/USDT ⚡️⚡️
Exchanges: ByBit USDT
Signal Type: Regular (Long)
Leverage: Isolated (2.0X)
Amount: 5.4%
Current Price:
3.281
Entry Targets:
1) 3.201
Take-Profit Targets:
1) 4.387
Stop Targets:
1) 2.607
Published By: @Zblaba
HOSE:GAS BYBIT:GASUSDT.P #1D #NeoGas #dBFT neo.org
Risk/Re
Morningstar's moat threatened by LLMsMorningstar has been a quiet compounder for decades. Built on data, research and ratings, it carved a niche as the go-to source for fund analysis and financial information. The problem now is that most of its earnings still come from information services, licensing contracts and analytics.
AI can scrape, organise and summarise financial information at near zero cost, which puts real pressure on Morningstar’s ability to charge premium prices for data and insight.
The business is also overwhelm
How to Trade Morning Star and Evening Star Candlestick Patterns Learn to identify and trade Morning Star and Evening Star candlestick formations using TradingView’s charting tools in this detailed tutorial from Optimus Futures.
Morning and Evening Stars are powerful reversal patterns that often mark turning points in the market. Recognizing them can help you anticipate when momentum is about to shift—and take advantage of new trading opportunities.
What You’ll Learn:
• How Morning Stars signal bullish reversals at the end of a downtrend
• How Evening Stars
Mastering bullish candlestick patterns - How to use it!In this guide, we will explore some of the most important bullish candlestick patterns used in technical analysis. These patterns are essential tools for traders and investors who want to better understand market sentiment and identify potential reversal points where prices may start moving upward.
What will be explained:
- What are bullish candlestick patterns?
- What is the hammer?
- What is the inverted hammer?
- What is the dragonfly doji?
- What is the bullish engulfing?
- What is the mo
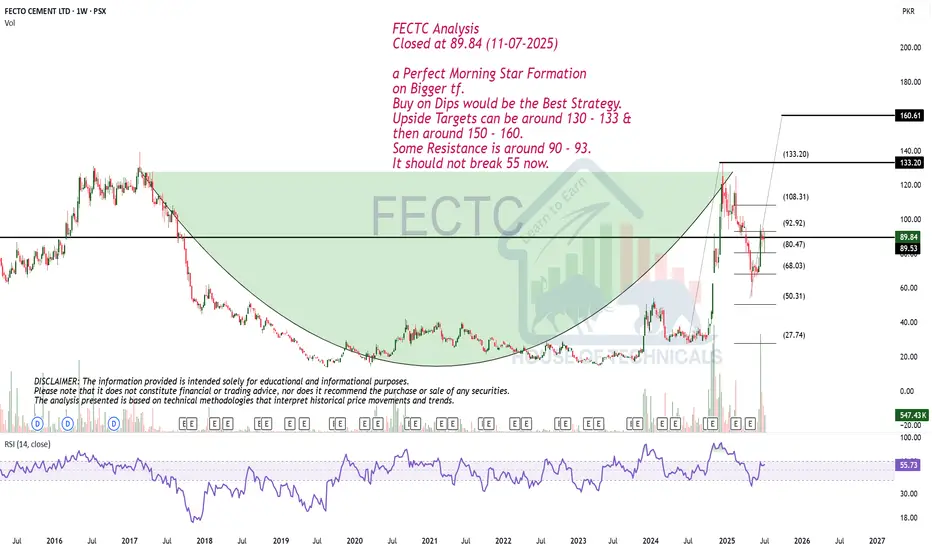
a Perfect Morning Star Formation on Bigger tf.FECTC Analysis
Closed at 89.84 (11-07-2025)
a Perfect Morning Star Formation
on Bigger tf.
Buy on Dips would be the Best Strategy.
Upside Targets can be around 130 - 133 &
then around 150 - 160.
Some Resistance is around 90 - 93.
It should not break 55 now.
SPX week & month review 5/30/25Intrigued by today as we closed the month and week. The charts appear bullish until something changes that. Key points I noticed...
*Monthly morning star pattern
*RSI above 50 on month and week chart
*MACD over zero line and signal up on month and week chart
*Key levels holding up (21 ema, FVGs)
We are still in volatile times and narratives are being thrown all over the place. Do you see what I see? Enjoy your weekend.
Beautiful candle but Bearish Divergence is also there..
Beautiful candle formed on Weekly basis.
But Bearish Divergence is also appearing
& a very strong resistance is around 111.
Crossing & Sustaining this level will expose
125+
Remember, if 104 - 105 is not sustained, the channel
bottom is around 80 - 82
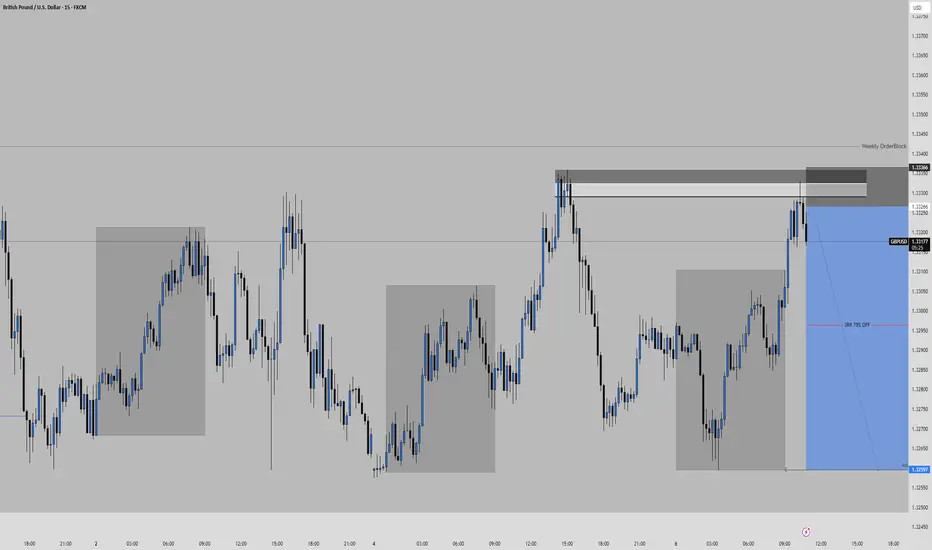
May 6, 2025 GBPUSD Sell📉 Bias: Bearish | Risk: 0.5% | 🎯 Targets: 1:3 (take 75%), final target ~1:7
🧠 Reasoning:
Price reacted from a Daily / Weekly Orderblock with confluence from a 15m OB
Asia Low as target provides clean downside structure
Morning Star formed inside the OB → entry taken at the imbalance left behind
10 pip SL covers highs efficiently ✅