HYPEUSDT – Retesting FVGs Above 200 EMA Within Bullish StructureLooking at the 4-hour chart of HYPEUSDT, the market is showing a solid macro bullish structure, heavily supported by the 200 EMA dynamic filter.
Key Technical Observations:
Trend Baseline: Price action remains consistently above the 200 EMA line, indicating that the institutional medium-to-long term momentum is clearly on the bulls' side.
FVG Retest & Consolidation:
The current pullback back into the local demand area (marked by the green dashed box around $66.93) is a natural reaction. Du
Moving Averages
False Breakdown Still in PlayHi traders!
Today's update will be a short one, as the false breakout scenario I mentioned yesterday is continuing to play out. As a result, all key levels remain unchanged.
As a reminder, yesterday I wrote:
"The break below 62,500 could very well turn out to be another false breakdown, just as it did on Monday. I'm confident many traders rushed to open short positions on those headlines, and these are often the exact situations where the market moves against the crowd. The longer we go with
$MMM - Previous Resistance Break and 50 SMA Support Retest💡 Swing setup idea
Previous resistance break
🔎 Analysis summary:
The stock broke above previous resistance and came back to test support at the 50 SMA. Now let’s see if buyers volume can hold that support.
👀 Levels to watch:
Entry trigger: Break above $154.55
Target: $167.97
Stop: Under the 50 SMA / support level
💬 What do you think of this setup? Let me know in the comments! 👇
Good luck!
⚠️ Note: This is for educational purposes only and is not financial advice.
$CAT - Support Retest at 50 SMA💡 Swing setup idea
Previous resistance break
🔎 Analysis summary:
The stock broke above previous resistance and came back to test support at the 50 SMA. Now let’s see if buyers volume can hold that level.
👀 Levels to watch:
Entry trigger: Break above $930.54
Target: $1,073.46 (ATH)
Stop: Under the 50 SMA / support level
💬 What do you think of this setup? Let me know in the comments! 👇
Good luck!
⚠️ Note: This is for educational purposes only and is not financial advice.
The Market Is Ignoring Bad News... For NowHi traders!🦬🐻👾
Starting today, in addition to my daily Bitcoin analysis, I'll also be publishing daily SPX500USD market updates.
My last major SPX analysis, published on April 17, played out exactly as expected and reached every target. You can find the full breakdown on my page. It wasn't just about support and resistance levels—it explained the market mechanics and psychology behind crisis-driven price action🎓🎓💰
After more than 10 years of trading, I've witnessed how markets react to numero
Euro Stoxx 50 (STOXX50) LONG — 6H ALMA Setup (WR 76%)█ SETUP
ICMARKETS:STOXX50 · 6H · long only.
(Context: Euro Stoxx 50 — pan-European large-cap index, EUR beta.)
ALMA Averaging Strategy: ALMA 3 / σ2, SD band 2, min diff 4/3, 25% per bar, up to 4 adds, hard stop −10% from average entry.
Strategy Tester (STOXX50 6H):
Win rate 76% · profit factor 2.5 · max drawdown 18%
Avg win +3.8% · avg loss −2.8% · typical hold ~54×6H bars on winners — patient index mean-reversion grid
═
█ WHY NOW
Wednesday evening 6H bar — ALMA long fired 08 Jul
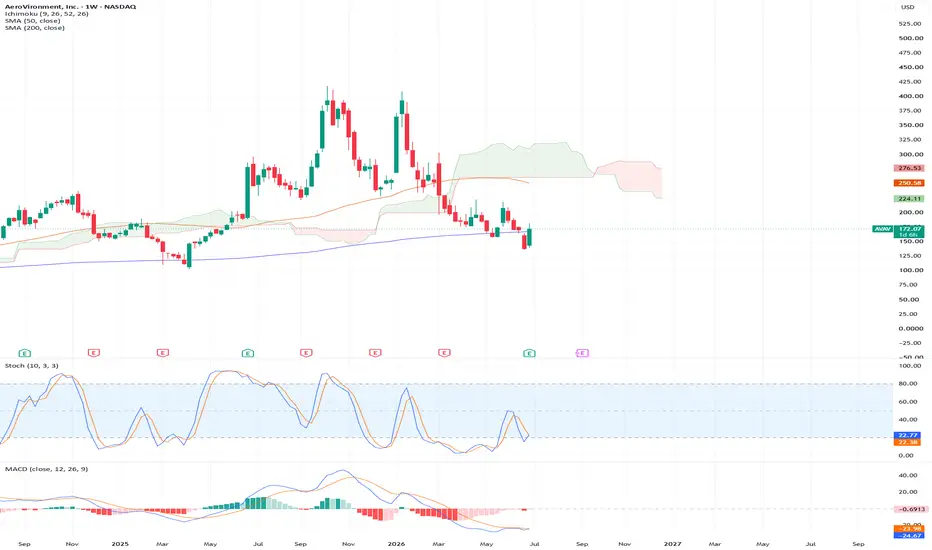
AVAV - Defense Turnaround (Long)Why we like AVAV
Right group, turnaround name: it's a drone/defense play inside aerospace and defense, which is a broad market leader right now, so there's a strong-group tailwind under an early-recovery name.
High-quality reversal spot: the bounce is happening right on the 200-week SMA (~167), exactly where a washed-out momentum name should try to bottom, not in no-man's-land.
Weekly turn signals confirm: lower low in price against a higher low in stochastic (bullish divergence) plus a M
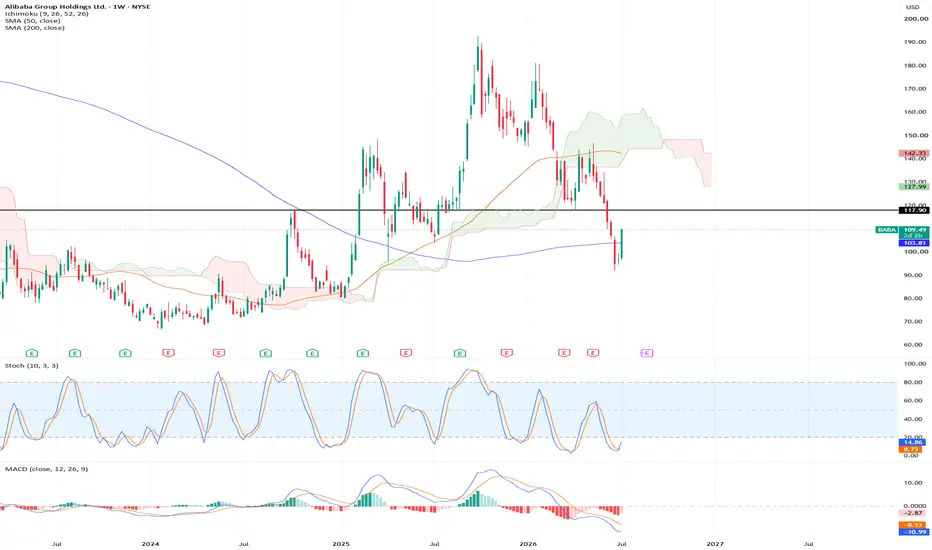
BABA showing signs of life.BABA, Alibaba, 1W / 1D
(AI summary of my analysis)
China internet has quietly started to turn up this week (KWEB, MCHI, FXI all curling higher on relative strength for the first time in a while). BABA is the name I want inside that. This is an early one, so I'm treating it like a probe, not a conviction long.
The setup:
- Fresh 52-week low, one week of consolidation, and now a big thrust week. Daily is up double digits on the heaviest volume in months and reclaimed the 21 EMA and 10 SMA. Weekl
Gold (XAUUSD) LONG — 12H ALMA Setup (WR 88%)█ SETUP
Spot gold · OANDA:XAUUSD · 12H · long only.
ALMA Averaging Strategy: ALMA 3 / σ2, SD band 2, min diff 1/1, 25% per bar, up to 4 adds, hard stop −10% from average entry.
Strategy Tester (XAUUSD 12H):
Win rate 88% · profit factor 20.5 · max drawdown 4%
Avg winning trade +3.6% · avg losing trade −1.0%
Typical hold ~26×12H bars on winners · deep-sample spot-gold mean-reversion template
═
█ WHY NOW
Wednesday 08 Jul 10:00 UTC — fresh 12H ALMA long on spot gold ~ $4,043 after the
Geopolitics or a Bear Trap?Hi traders!🧨
Just as Bitcoin found solid support around the 62,500 level, negative headlines emerged about the renewed U.S.–Iran conflict☠️
Both the stock and crypto markets reacted immediately with a sell-off. However, considering the level of escalation, I was expecting a much stronger decline. It looks as if the markets have either grown tired of this conflict and simply don't want to react anymore, or they had already priced in the possibility of renewed tensions.
From a purely technical
Merck: Has Resistance Become Support?Merck has been sneaking higher, and some traders may think the drugmaker has broken out.
The first pattern on today’s chart is the February 25 peak of $125.14. MRK pushed above that level two weeks ago, before pulling back to bounce at the previous high. Has old resistance become new support?
Second, prices held the 8-day exponential moving average (EMA). The 8-day EMA is also above the 21-day EMA and MACD is rising. Those signals may reflect short-term bullishness.
Third, MRK spent most of M
Compound (COMP) LONG — 1D ALMA Setup (WR 79%)█ SETUP
Compound · COINBASE:COMPUSD · 1d · long only.
ALMA Averaging Strategy: ALMA 3 / σ2, SD band 2, min diff 6 bar to add / 1 bar to exit, 25% per bar, up to 4 adds, hard stop −10% from average entry.
Strategy Tester (COMP 1D):
Win rate 79% · profit factor 6.6 · max drawdown 18%
Avg winning trade +27.8% · avg losing trade −8.8%
Typical hold ~16×1d bars · DeFi lending / governance blue-chip sleeve
═
█ WHY NOW
Wednesday midnight UTC bar — fresh 1D ALMA long on 2 Jul 00:00 UTC ~
Gold coils in a falling wedge. Magnet above or vacuum below?Every leg of gold's slide since the Q1 peak has happened inside the same shape. Draw a line across the lower highs and another across the higher lows and you get a falling wedge , a contracting range that has quietly caged the entire decline.
Gold now sits down near the wedge's lower boundary, the line that has caught every dip on this timeframe so far. Daily RSI is hovering around 40, with small bullish divergence, weak but not yet the deep-oversold reading that usually marks a capitulation l
Euro / US Dollar ($EURUSD) Daily: Near-Term Relief Pullback Euro / US Dollar ( OANDA:EURUSD ) Daily: Near-Term Relief Pullback Toward 200-EMA Prior to Macro Fibonacci Expansion Leg
### 🇪🇺🇺🇸 Euro / U.S. Dollar ( OANDA:EURUSD ) Daily Technical Matrix (Ref: EURUSD_2026-07-08_09-41-20.jpg)
We are releasing a dual-horizon tactical brief on the EURUSD currency cross on the Daily (1D) interval. While the high-timeframe structural regime remains heavily anchored in a bearish markdown model, the pair is currently signaling near-term internal deceleration, creati
Bearish Order Flow + Textbook Short Squeeze on Zero Real DemandSince the recent low we’ve seen:
Price ↑
Open Interest ↓
Funding Rate positive
Futures CVD ↑
Spot CVD ↓
This is classic short covering, not fresh buying. Shorts are getting squeezed and forced to close (every short close = buy in futures), mechanically pushing price higher.
But weak spot CVD shows no real buyers absorbing supply at these levels.
These setups often look strong on the way up… until the short fuel runs out. Then the lack of genuine demand gets exposed fast.
Key Resist
62.5K Support Holds, Pressure BuildsHi traders!✊🏼
After yesterday's false breakout immediately following the U.S. session open, Bitcoin reached the first projected target at 64,000✅ and then continued to 64,660✅, stopping just $230 short of the second target at 64,890.
For now, price continues to hold above the 62,500 level, which remains a positive sign for the bulls🦬🦬🦬 This support is holding up quite well. At the same time, Bitcoin is getting squeezed between the 4H EMA100 and EMA200, increasing the probability of a strong im
Gold’s 30% PullbackGold has pulled back roughly 30% from its powerful rally that delivered one all-time high after another.
Many traders were watching the key $3,886 level, expecting a sweep before any reversal. Price has edged higher again but is now facing resistance at the 21-day EMA.
It’ll be interesting to see if Gold can form a higher low and kick off a solid recovery.
If not, the $3,770 area looks very compelling — that’s where the 100-week EMA sits, along with liquidity from the prior low. A strong boun
British Pound / US Dollar ($GBPUSD) Daily: Cable Sits at Major 2British Pound / US Dollar ( OANDA:GBPUSD ) Daily: Cable Sits at Major 200-EMA & Trendline Junction – Mapping the Two-Way Breakout Matrix
### 🇬🇧🇺🇸 British Pound / U.S. Dollar ( OANDA:GBPUSD ) Daily Technical Update (Ref: GBPUSD_2026-07-07_08-35-38.png)
We are deploying a high-stakes structural study on the GBPUSD currency pair on the Daily (1D) time matrix. The "Cable" has arrived at an absolute technical decision point, consolidating directly inside an institutional moving average cluster and
Aurinia (AUPH) LONG — 1W VWAP Setup (WR 70%)█ SETUP
Aurinia Pharmaceuticals · NASDAQ:AUPH · 1W · long only.
VWAP Swing Strategy: swing pivot per chart · 2 consecutive bars per deploy · 0/6 min VWAP age on entry/exit. One full position per signal — no scale-in ladder. No hard % stop — long entry on Touch VWAP Low, exit on Touch VWAP High (active Resistance) when min-age met.
Strategy Tester (AUPH 1W):
Win rate 70% · profit factor 4.0 · max drawdown 27%
Avg winning trade +13.8% · avg losing trade −7.8%
Typical hold ~6×1W bars · biote
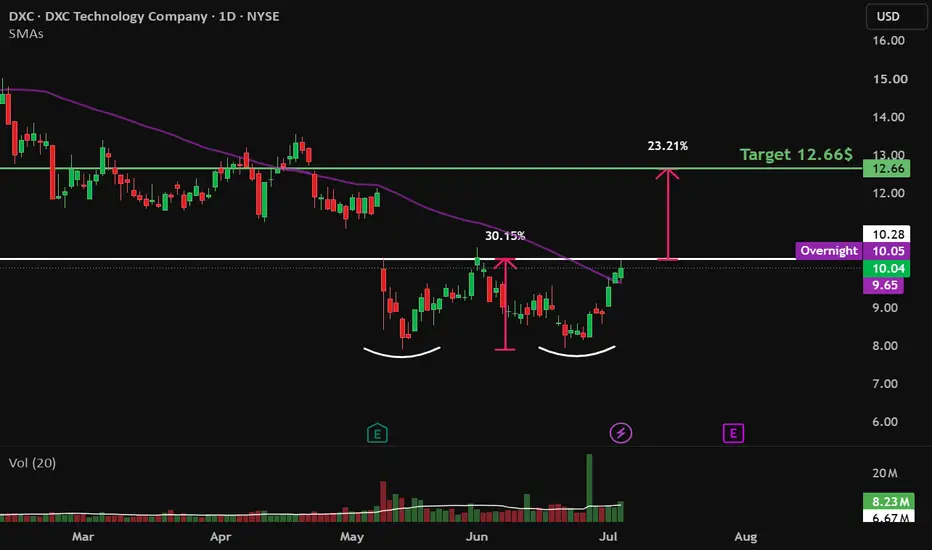
$DXC - Double Bottom Pattern💡 Swing setup idea
50 SMA breakout
🔎 Analysis summary:
The stock broke above the 50 SMA and closed a double bottom. Buyers volume is stepping in.
👀 Levels to watch:
Entry trigger: Break above $10.28
Target: $12.66
Stop: Under the breakout level
💬 What do you think of this setup? Let me know in the comments! 👇
Good luck!
⚠️ Note: This is for educational purposes only and is not financial advice.
S&P 500 hits 7,500: The number that silenced the hawks!S&P 500 has rebounded from its Independence Day holiday having produced the best quarter performance since 2020. The S&P 500 is up by 9.6% for the first half of 2026, the macro environment remains quite confusing coming into the second half of the year. The dovish Fed in June has created the right rate environment for the equity market bulls, and good NFP data on July 3rd confirmed that the US economy is not collapsing. However, the NFP report of June was much more concerning for the equity bull