Pump is ready to dump hardHello Traders!
We can see structure is complete and PUMP is ready to reverse because of a reversal pattern after breakout. Current impulsive move in PUMP is also a form of reversal pattern soon it will dump hard.
We are selling/short in Pump from 0.002522
Stoploss 0.002692 (-6.9%)
Target 0.001983 (+21.2%)
My goal is to be recognized as one of the highest win-rate traders in the TradingView community. :)
Trade Analysis Based on
> Fibonacci Tool (A1000x Way) – Custom Fibonacci approach for precise market analysis
> Candlestick Patterns – Strong price action confirmation through key candle formations
> A1000x Breakout Strategy – Identifying and trading high-probability breakout setups
> HH, HL & LH, LL Strategy – Market structure analysis for clear trend direction
> Swing Points – Tracking key highs and lows for accurate price movement insight
> A1000x Stoploss Strategy – Strategic stoploss placement for effective risk control
> A1000x Target Strategy – Structured target setting based on price action
We trade using carefully developed strategies and disciplined market analysis, always seeking the best possible accuracy while remembering that ultimate success comes only by the will of Allah.
In some trades, you may notice a relatively larger stop loss or a risk-to-reward ratio that may appear unusual at first glance. However, every trade is taken with proper planning and calculated analysis, not random entries.
Before entering any position, we perform detailed calculations and market evaluation. Based on this analysis, we carefully determine our stop loss and target levels.
I personally apply one of my specialized stop-loss and target strategies, designed to place the stop loss at a logical market level where price is less likely to reach before moving toward the intended target — InshaAllah.
Trading always involves risk, but with discipline, patience, and proper strategy, we aim for consistent and responsible decision-making.
Feel free to share your thoughts or leave a comment.  Short
Short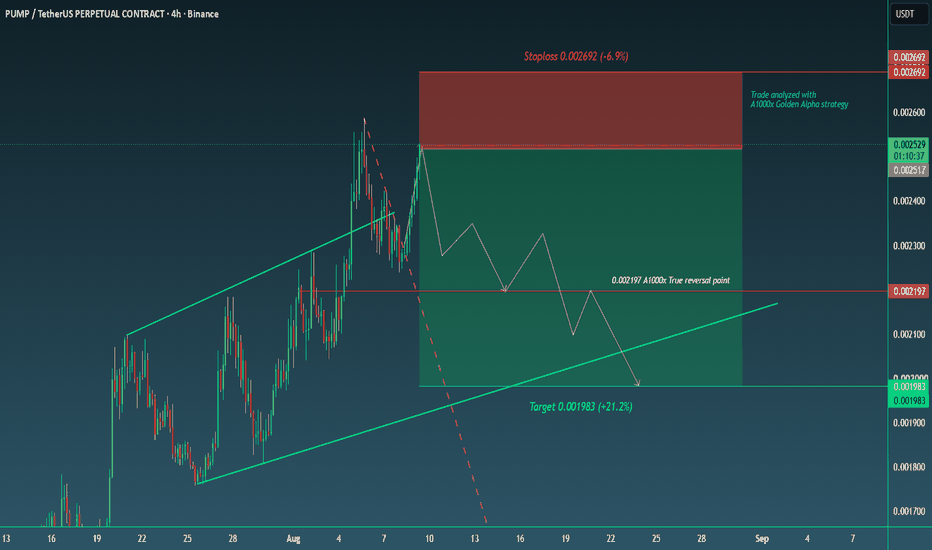
XAUUSD: Price Breaks Above A Major Resistance, Bullish Persist!XAUUSD is trapped inside a horizontal consolidation, ranging on a sideways framework of support and resistance, for a couple of weeks now. Price just broke above the resistance consolidation level, at $4,220, in respect to the structure. We anticipate a buy continuation, after retest.
More buy confirmation, at this point, triggers a another long position, eyeing $4,320, as next potential bullish.
Thanks for reading.  Long
Long
 Long
Long
GOLD: How Trends Are Born: The Birth of a New Bullish TrendEvery major trend begins long before most people recognize it.
By the time the headlines turn bullish, the market has often already completed the most important part of the journey.
Let's break down what that process looks like.
🔴 Stage 1 — Markup Reaches Exhaustion
Every strong uptrend eventually slows down.
After an extended rally, buying momentum begins to fade as early buyers take profits. The market enters a distribution phase, where volatility increases and price struggles to make meaningful new highs.
This isn't necessarily bearish yet—it simply signals that the prior trend is losing strength.
🔻 Stage 2 — Markdown
Once sellers gain control, price transitions into a series of lower highs and lower lows.
In Gold's case, this developed into a well-defined descending channel, where every rally was met with selling pressure.
At this stage, sentiment becomes increasingly bearish.
⚖️ Stage 3 — The Character Change
Here's where experienced traders begin paying attention.
Instead of continuing to make fresh lows, price finds support and repeatedly defends the same area.
The lower boundary of the channel is respected, selling pressure weakens, and buyers gradually begin absorbing supply.
This is often the first clue that the prevailing trend may be changing.
🟢 Stage 4 — Breaking the Bearish Structure
The most important event isn't a new high.
It's the moment price starts challenging the descending trendline that has capped every rally throughout the correction.
Breaking that structure doesn't guarantee an immediate bull market.
It simply tells us that buyers are beginning to regain control.
🔵 Stage 5 — The New Trend Begins
If the breakout is confirmed, yesterday's resistance often becomes tomorrow's support.
A successful retest followed by higher highs marks the beginning of a new markup phase.
Sometimes, what initially appears to be a bearish correction is revealed to be nothing more than a large bull flag—a pause within a much larger uptrend.
If that scenario unfolds here, Gold could transition from a corrective decline into the next impulsive leg higher.
What I'm Watching
✅ Price has established a solid base near support.
✅ The descending channel remains intact, but bullish momentum is building.
👀 The key event is a decisive breakout above the channel resistance, ideally followed by a successful retest.
If buyers reclaim that level, the current bearish channel could evolve into a textbook Bull Flag, with the previous rally acting as the flagpole and the correction serving as the consolidation before the next potential advance.
As always, confirmation comes first—projection comes second.
The strongest trends rarely begin with excitement. They begin with a subtle shift in market structure that most participants don't notice until much later. Education 
BTCUSDT Short: Faces Descending Channel – Pullback to $63,400?Hello traders! Here’s my technical outlook based on the current BTCUSDT (3H) chart structure. BTCUSDT previously declined inside a descending channel before rebounding from the long-term ascending demand line. Price later formed another descending channel, where buyers successfully defended the 63,400 Demand Zone and pushed the market higher.
Currently, BTCUSDT is trading below the 65,800 Supply Zone while holding above the 63,400 Demand Zone and the rising demand trendline. Price is now testing the upper boundary of the descending channel.
As long as BTCUSDT remains below the 65,800 Supply Zone and channel resistance, the bearish scenario remains valid. A rejection could send price back toward the 63,400 Demand Zone (TP1). However, a breakout above resistance would weaken the bearish outlook. Manage your risk!  Short
Short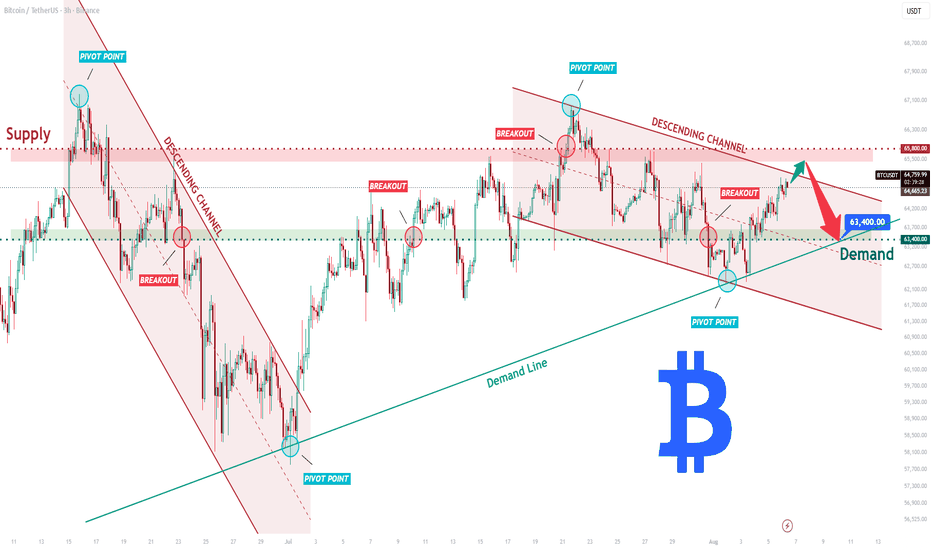
GOLD - Local bullish sentiment. NFP coming upFollowing a strong rally, ICMARKETS:XAUUSD has entered a consolidation phase, signaling the potential for further upside if buyers can successfully defend the 4300 level.
The U.S. Dollar Index has broken its bullish structure, although the broader fundamental backdrop remains mixed. Geopolitical uncertainty persists, while the Federal Reserve continues to maintain a hawkish stance.
After the recent advance, gold is consolidating and building a liquidity pool around the 4242–4229 zone, which market makers may test before another move higher. There is also a possibility that this could become gold's strongest weekly performance since January.
The next major catalyst will be the U.S. Non-Farm Payrolls (NFP) report. A weaker-than-expected labor market reading could fuel another rally, while stronger data may restore downside pressure. Market participants will also continue to monitor developments in the Middle East and U.S.–Iran negotiations.
Bullish drivers: Weaker-than-expected NFP, A weaker U.S. dollar, Lower interest rate expectations, Progress in geopolitical negotiations
Bearish drivers: Strong NFP data, Hawkish Federal Reserve rhetoric, A stronger U.S. dollar, Escalation of geopolitical tensions
Resistance levels: 4300, 4330, 4370
Support levels: 4242, 4229, 4200
From a technical perspective (setting aside the unpredictability of news events), gold still has room to extend its rally.
Two primary scenarios:
A long squeeze into the 4242–4229 support zone could restore bullish momentum.
A breakout and sustained close above 4300 could also become the technical catalyst for another leg higher.
Best regards,
R. Linda Long 

 Long
Long
ETHUSDT - Ready for Continued GrowthBINANCE:ETHUSDT is consolidating above 1898 following a distribution phase. From a technical perspective, the daily structure remains constructive, with ETH showing relative strength compared to Bitcoin, which increases the probability of further upside
Bitcoin is gradually recovering and approaching the key 65,150 trigger level. A breakout above this zone could provide additional support for the broader crypto market.
Against this backdrop, Ethereum has broken out of its local bearish corrective structure and entered a new bullish phase. Buyers are actively defending the 1898.5 support zone, keeping the door open for a continuation toward the 1936–1967 resistance area. At the moment, ETH continues to outperform Bitcoin
Resistance levels: 1936, 1967
Support levels: 1898, 1885
A retest of the nearest support zone remains possible. A long squeeze (liquidity sweep) around this area could become the technical catalyst for another bullish impulse toward the stated upside targets
Best regards,
R. Linda  Long
Long
Bitcoin H2: Breakout opens the way towards 66KBitcoin has escaped the falling channel and is holding the price above the recently broken trend line. This is a positive signal showing that selling pressure is weakening, while the short-term structure is starting to gradually shift towards buyers.
My priority is to wait for a correction to the 63,600–64,100 area. If BTCUSD holds this area and an H2 candle refuses to decline, the breakout zone will be confirmed as new support.
As the price reclaims 64,800, the upside momentum could continue to extend through 65,200–65,600, before heading towards the main target around 66,009.
The breakout gave the advantage to the buyers, but the beautiful entry point was still at the protected retest instead of following the price.
In your opinion, will Bitcoin retest the support zone first or go straight to 65,000? Long 
BTCUSDT Short: Rejection From 63,800$ — Downside in FocusHello traders! Here’s my technical outlook based on the current BTCUSDT (2H) chart structure. BTCUSDT previously recovered from a consolidation range and moved inside an ascending channel. After reaching the upper boundary, price was rejected and broke below the channel support, confirming a bearish shift. The latest retest of the 63,800 Supply Zone was rejected, keeping sellers in control.
Currently, BTCUSDT is trading below the 63,800 Supply Zone while holding above the 61,600 Demand Zone and the descending supply line.
As long as BTCUSDT remains below the 63,800 Supply Zone, the bearish scenario remains valid. A continuation lower could push price toward the 61,600 Demand Zone (TP1). However, a breakout above 63,800 would weaken the bearish outlook. Manage your risk! Short 
XAUUSD Recovery Above 4,100 Opens Path Toward 4,220Hello traders! Here is my technical forecast based on the current XAUUSD (3H) chart structure. Previously, XAUUSD traded inside a descending channel before breaking the resistance line, signaling a change in momentum. After the breakout, the price entered a consolidation range and repeatedly faced rejection near the 4220 seller zone. Currently, XAUUSD is trading above the 4100 buyer zone, remaining below the 4220 seller zone and the long-term descending resistance line. The recent breakout above the buyer zone suggests that buyers are trying to regain control. As long as XAUUSD holds above the 4100 buyer zone and the ascending support line, the bullish scenario remains in place. After a correction to support, buyers could push the price to the 4220 seller zone (TP1). However, a rejection of the resistance or a breakdown below 4100 will weaken the bullish forecast. Please share this idea with your friends and click "Boost" 🚀 Long 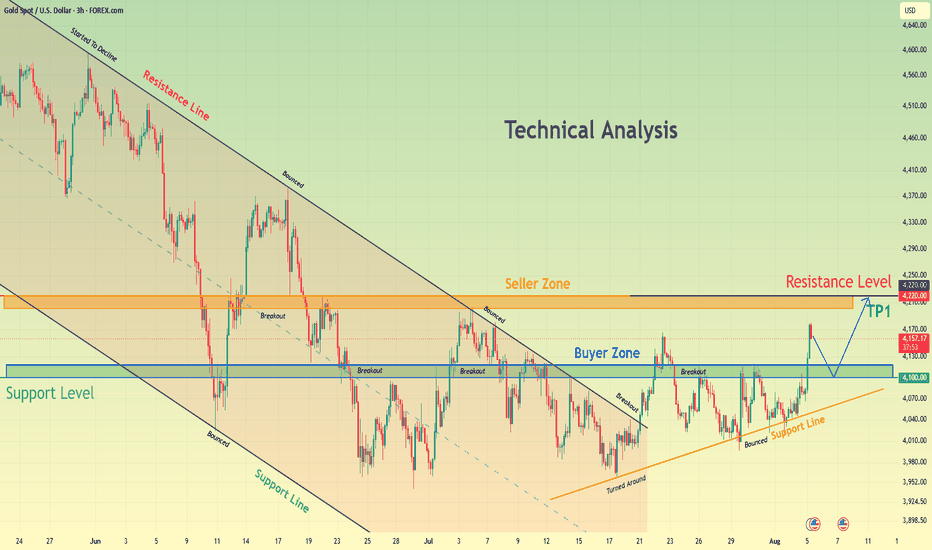
XAUUSD Long: Rebounds From Demand, Eyes 4,090$ Supply ZoneHello traders! Here’s my technical outlook based on the current XAUUSD (1H) chart structure. XAUUSD recently rebounded from the 4,030 Demand Zone and continues to respect the rising demand line, showing that buyers remain active. However, price is still trading below the 4,090 Supply Zone and the descending supply line.
Currently, XAUUSD is holding above the 4,030 Demand Zone while approaching the 4,090 Supply Zone. The latest bounce suggests buyers may attempt another move higher.
As long as XAUUSD remains above the 4,030 Demand Zone and the ascending demand line, the bullish scenario stays valid. A continuation higher could push price toward the 4,090 Supply Zone (TP1). A break below 4,030 would weaken the bullish outlook. Manage your risk! Long 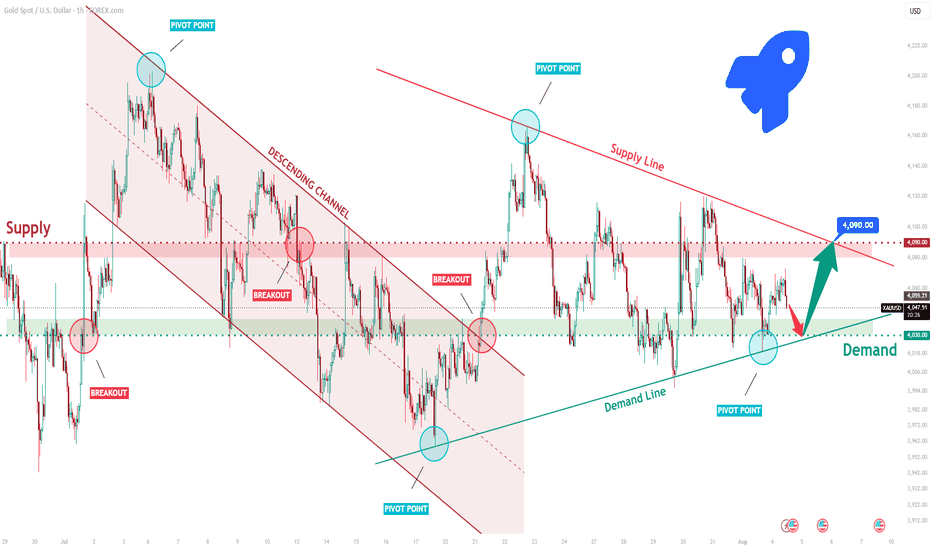
 Long
Long
Bitcoin Tests $64,500 Resistance — Pullback Toward $62K PossibleHello traders! Here’s my technical outlook based on the current BTCUSDT (4H) chart structure. BTCUSDT previously recovered from the 62,000 Buyer Zone and advanced inside an ascending channel before reaching the 64,500 Seller Zone, where sellers regained control. Price then rejected from the long-term descending trendline and broke below the channel support, signaling weakening bullish momentum. Currently, BTCUSDT is trading above the 62,000 Buyer Zone while remaining below the 64,500 Seller Zone and the descending trendline. The latest rebound suggests buyers are attempting to defend support, but resistance continues to cap the upside. As long as BTCUSDT remains below the 64,500 Seller Zone and the long-term descending trendline, the bearish scenario remains valid. A rejection from current levels could push price toward the 62,000 Buyer Zone (TP1). However, a breakout above 64,500 and the descending trendline would weaken the bearish outlook and favor a stronger bullish recovery. Please share this idea with your friends and click "Boost" 🚀 Short 
XAUUSD Triangle Support Holds, Recovery Toward $4,100Hello traders! Here’s my technical outlook based on the current XAUUSD (2H) chart structure. XAUUSD previously declined inside a bearish channel before finding support and reversing higher. After the recovery, price formed an ascending triangle, with buyers consistently defending the 4,020 Buyer Zone while sellers continue protecting the 4,100 Seller Zone and the descending resistance line. Currently, XAUUSD is trading above the 4,020 Buyer Zone while remaining below the 4,100 Seller Zone and the descending resistance line. The latest rebound from support suggests buyers are still attempting to build bullish momentum. As long as XAUUSD holds above the 4,020 Buyer Zone and respects the ascending support line, the bullish scenario remains valid. A continuation higher could push price toward the 4,100 Seller Zone (TP1). However, a rejection from resistance or a break below 4,020 would weaken the bullish outlook and increase the risk of another decline. Please share this idea with your friends and click "Boost" 🚀 Long 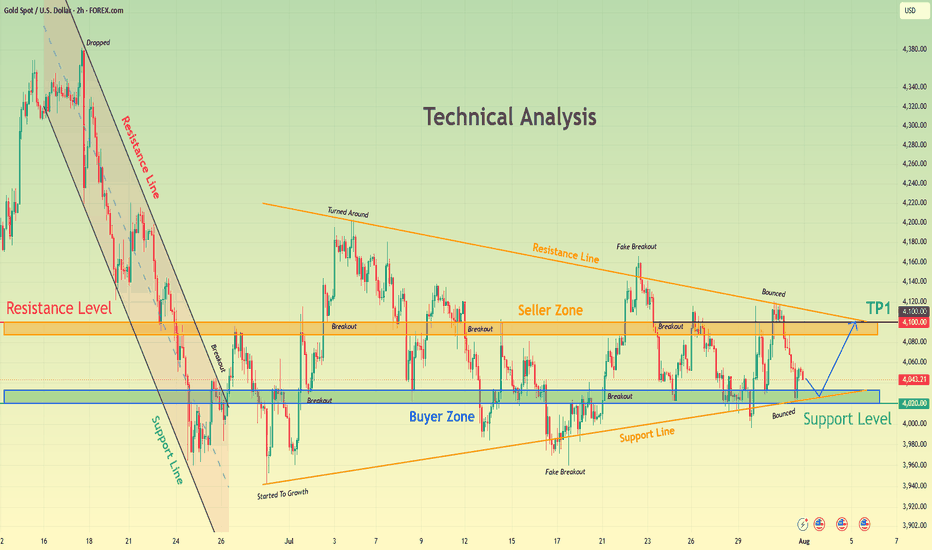
GOLD - A short squeeze could lead to a correction ICMARKETS:XAUUSD is advancing during the Asian session as part of a distribution phase, testing the 4166–4195 resistance zone. The move is being driven by Western comments regarding negotiations in the Middle East. However, Iran has yet to respond, leaving geopolitical uncertainty elevated.
The U.S. dollar remains in consolidation following last week's decline, which was largely triggered by intervention in the Japanese yen. Gold showed little reaction to the weaker dollar and continued trading sideways. Today's rally is primarily geopolitically driven, but the backdrop remains fragile because the market has only heard one side of the story. Any unexpected development could quickly reverse the move.
At the same time, the Federal Reserve's hawkish stance and uncertainty surrounding the negotiations may continue to limit upside potential. The sustainability of the current recovery will depend on developments in the Strait of Hormuz and upcoming U.S. labor market data.
Resistance levels: 4166, 4195
Support levels: 4130, 4116
From a technical perspective, gold has broken above 4166, but buyers have so far been unable to build on the breakout. A false breakout from this resistance zone could trigger a corrective move under the pressure of the broader bearish trend. The 4195 level also remains a key liquidity zone. A short squeeze into either resistance area could provide the catalyst for a decline toward 4130–4110.
Best regards,
R. Linda Short 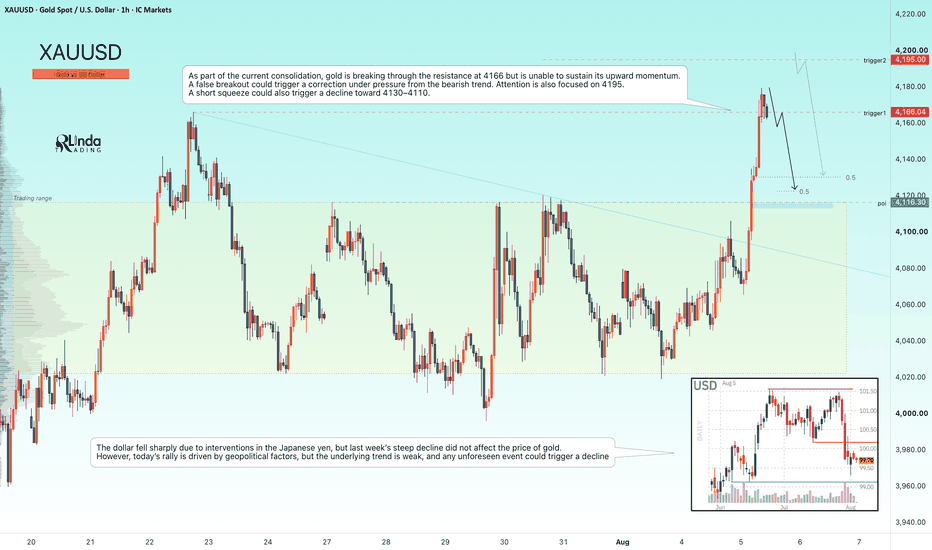
NZDUSD - Ready for growth within the trend Following a strong rally, FX:NZDUSD is now retesting the former resistance of its trading range, which has turned into support. This creates an opportunity for the bullish trend to continue.
The U.S. Dollar Index has broken its recent market structure, and continued dollar weakness could provide additional support for the pair
From a technical perspective, NZDUSD is performing a classic support retest within its countertrend recovery, while buyers are actively defending the 0.5863 level. Sustained consolidation above this trigger could become the catalyst for another bullish impulse
Resistance levels: 0.5908, 0.6000
Support levels: 0.5863, 0.5825
As long as price remains above 0.5863, the pair has the potential to extend its recovery, supported by the current weakness in the U.S. Dollar Index
Best regards,
R. Linda EURJPY - Long squeeze on support amid a bullish trend FX:EURJPY has fallen sharply following the Bank of Japan's intervention, triggering a long squeeze below key support. A recovery back into the trading range could provide the foundation for a bullish rebound
The market is currently stabilizing after the sharp decline, with price testing what was previously the daily range support, now acting as resistance.
A move back above the 180.80 level, followed by sustained consolidation, would confirm the recent breakdown as a false breakout and could trigger a bullish impulse
Resistance levels: 182.10, 183.56
Support levels: 180.80, 179.50
If buyers manage to reclaim and hold 180.80, the pair could regain upside momentum, opening the way for a recovery toward the next resistance levels
Best regards,
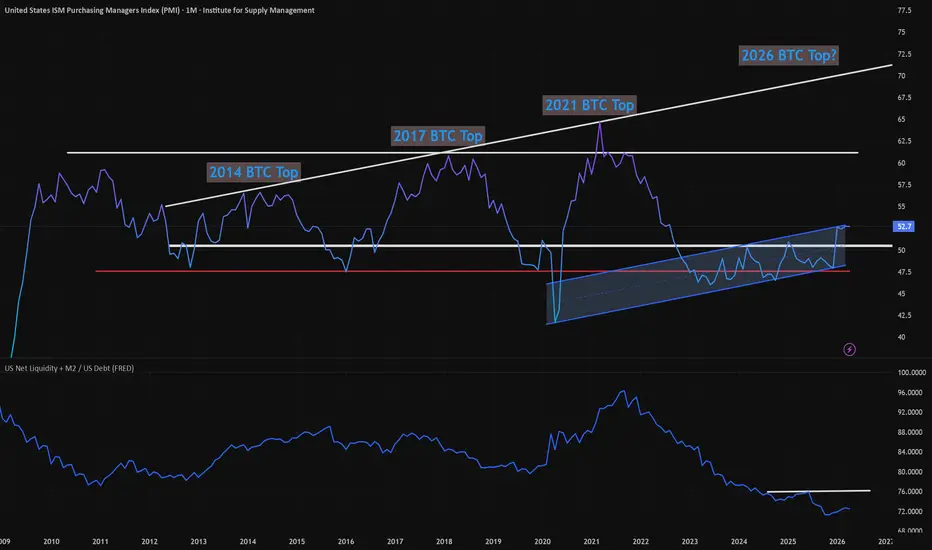
R. Linda 2026 ATH Rally? PMI and US Net Liquidity + M2 / US DebtIn this study, we analyze the ISM Purchasing Managers Index which while in an uptrending parallel channel of sorts, it also shows that the 2025 'Bull Run' never got close to projected 'top' levels.
Almost as if we never had the 2025 bull market top rally. Could it just be DELAYED?
While The ISM Manufacturing PMI is holding above the critical 50 threshold indicates continued economic expansion, which historically correlates with risk-on sentiment in crypto markets.
At 52.7 (+0.57%), we're seeing steady manufacturing growth that could support Bitcoin's current consolidation phase around $79,400, but NOT a rip-roaring market rally to new ATH.
Also, we can see from the US Net Liquidity + M2 / US Debt chart (lower frame) that we also didn't get the correlating rise in liquidity we usually see while building a new ATH on Bitcoin.
In fact, the prior floor for this back in 2011, now seems to be acting as resistance, rejecting in mid-2025. This points to a weak economic picture, and we'd need to see this ratio improve.
Either by dramatically lowering our close to $40T in debt (not likely anytime soon) and/OR seeing the 'Money Printer Go Brrrr' again, with post Covid-like stimulus and ideally lower interest rates and inflation. (I'm not a Macro guy, so don't beat me up here if I'm off a bit).
Either way, this chart tells the 'hidden story' of why we didn't see the massive pump to $150k - $200k Bitcoin in the last Bull Run...
But with improving economic and regulatory conditions... Could we?
For example, if / when the following tailwinds pick up:
- Final approval and signing of the Clarity Act into Law
- Easing of Middle-East tensions and an end to the Iran war
- New Fed-Chief approval and at least signaling lower rates later in 2026
- Fed QE and money printing to stimluate the economy
- ETF inflows continuing to increase and Strategy strong buying
- Potentially 're-valuing' Gold to current prices and selling enough to lower the US Debt
We could get our 2nd phase of the bull-cycle into 2026-2027.
I'd also like to point out that typically the cycle lows don't fully resolve and turn higher until 13 months after the previous highs, which points toward the Sept / October 2026 time-frame.
Cycle theory also points to this time-frame for the 4-year cycle lows to be in.
Key observations from this analysis:
- PMI above 50 typically supports risk asset rallies
- Current reading suggests economic stability vs recession fears
- Manufacturing strength often precedes crypto institutional inflows
- Historical correlation shows BTC tends to rally 2-4 weeks after sustained PMI strength
- Improved economic conditions per above could turn things around by Sept / Oct 2026
Scenarios:
Bullish Case: Sustained PMI above 52 could drive BTC toward $85k-$90k resistance
Bearish Case: PMI reversal below 50 would likely accelerate the correction to $70k support
This economic backdrop, combined with my previous technical analysis showing potential 50% corrections, creates an interesting divergence worth monitoring closely.
The next PMI release on June 1st will be critical for confirming this trend.
What's your take on how economic indicators should factor into crypto analysis?
Drop your thoughts below.