BTCUSDT Long: Targets 65,000 Following Demand Zone ReactionHello traders! Here’s my technical outlook based on the current BTCUSDT (3H) chart structure. BTCUSDT had been trading inside a broad descending channel after rejecting from a key pivot point near the top of its recent high. Earlier, price consolidated within a sideways range and broke out higher, but the rally stalled at the peak, initiating a prolonged downtrend where sellers regained control.
Currently, BTCUSDT is trading below the 65,000 supply zone while holding above the 61,500 demand zone. Price recently experienced a sharp breakdown below the descending channel and sliced straight through the 65,000 level, creating an aggressive downward breakout before finding a new pivot point at the lower support.
As long as BTCUSDT remains above the 61,500 demand zone and continues to respect this new pivot point, a short-term bullish pullback scenario remains valid. A recovery bounce could push price upward to retest the 65,000 supply zone (TP1). Manage your risk!
Parallel Channel
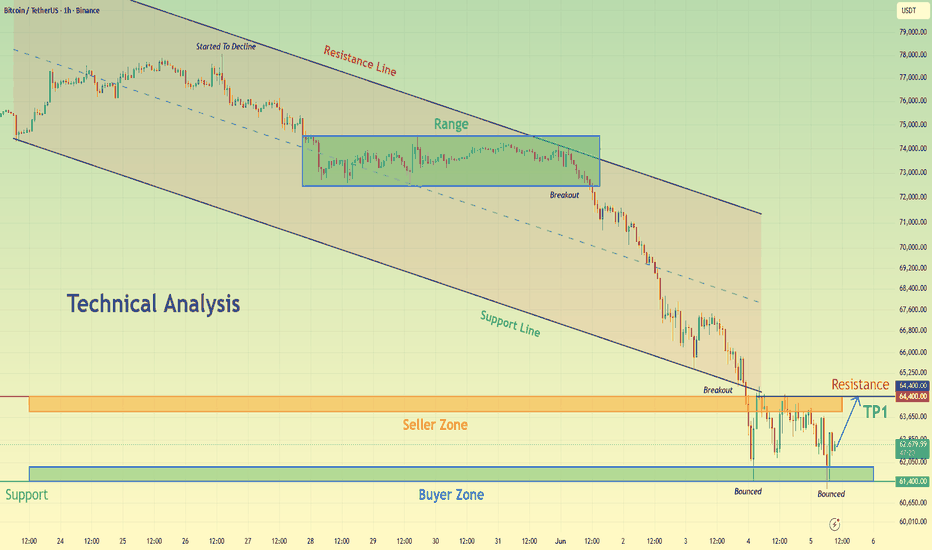
BTCUSDT Double Bounce Signals Potential Bullish ReversalHello traders! Here’s my technical outlook based on the current BTCUSDT (1H) chart structure. BTCUSDT previously traded inside a broad descending channel after reversing from a major high. Following a prolonged bearish move, price continued forming lower highs and lower lows while respecting both the channel resistance and support boundaries. A consolidation range developed near the upper half of the channel before a strong bearish breakout accelerated the decline. Currently, BTCUSDT is trading above the 61,400 Buyer Zone while remaining below the 64,400 Seller Zone, which now acts as the key resistance area. Price recently bounced twice from the Buyer Zone, signaling that buyers are attempting to defend support after the sharp sell-off. As long as BTCUSDT remains above the 61,400 Buyer Zone and continues to hold the current support structure, the bullish recovery scenario remains valid. A continuation higher could push price toward the 64,400 Resistance Level (TP1). Please share this idea with your friends and click “Boost” 🚀.
Google (Alphabet) in consolidating channel, bounce off 50-Day MAHey guys/gals.
I'm keeping this one really simple - no over exaggeration or technical indicators that will overcomplicate things.
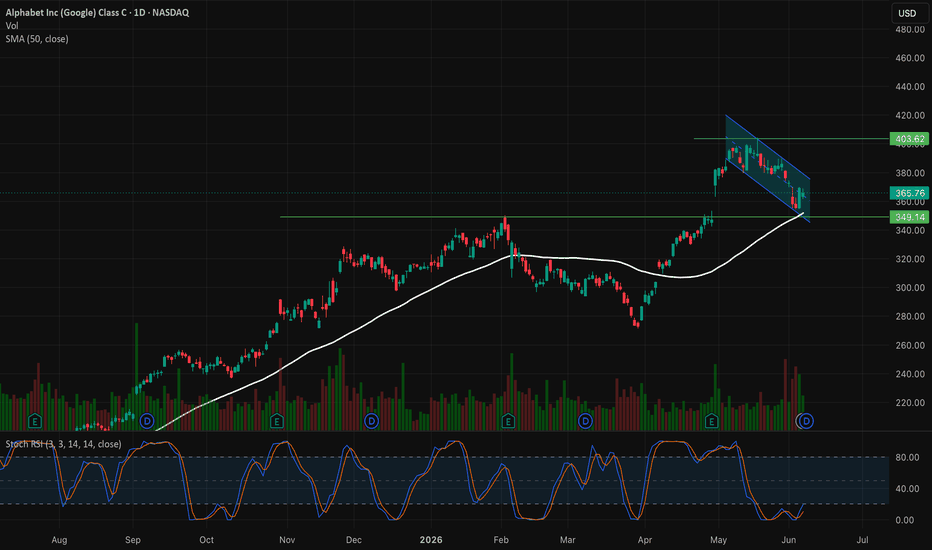
We can see that NASDAQ:GOOG ( NASDAQ:GOOGL ) recently entered a downward consolidation channel, which is quite common after a strong run up. The pullback looks controlled, and Google showed a lot of strength considering Friday's NASDAQ:NDX slump of 4%.
The technical picture on the daily chart is quite simple, with Stochastic RSI suggesting oversold territory. The most recent bounce within the downward channel also appeared to happen for two reasons: a bounce of the 50-Day SMA (white line) and a bounce of the support level around $350.
Multiple signs of strength/support like this is what makes me quite bullish, though cautiously depending how this upcoming week looks.
Note: Not financial advice - please do your DD as well before making an investment/trading decisions!
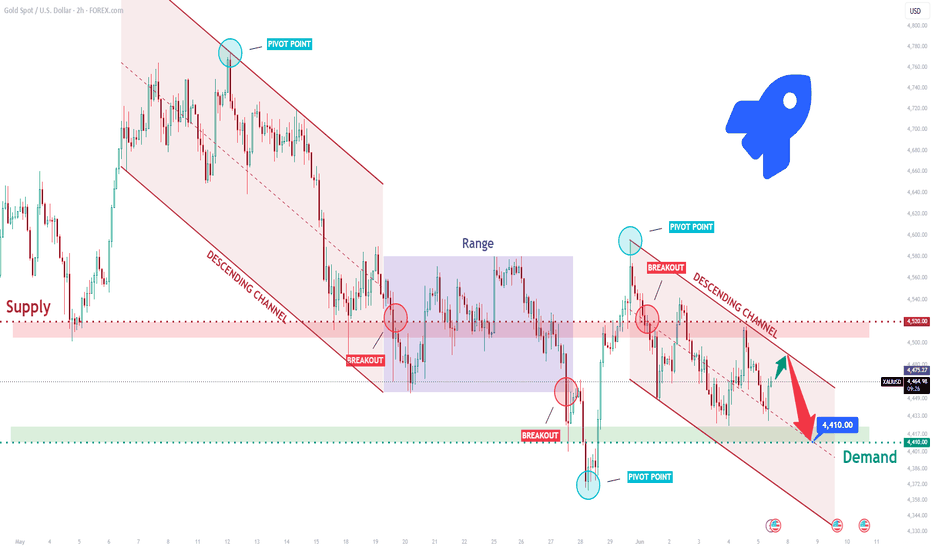
XAUUSD Short: Bears Defend Channel Resistance, Downside in FocusHello traders! Here’s my technical outlook based on the current XAUUSD (2H) chart structure. XAUUSD remains under bearish pressure after rejecting from a major pivot point and continuing to trade inside a descending channel. Price recently formed another lower high near channel resistance, confirming that sellers are still controlling the trend.
Currently, XAUUSD is trading below the 4,520 supply zone while holding above the 4,410 demand zone. The latest rebound failed to break channel resistance, signaling weak bullish momentum.
As long as XAUUSD remains below the 4,520 supply zone and respects the descending channel resistance, the bearish scenario remains valid. A continuation lower could push price toward the 4,410 demand zone (TP1). Manage your risk!
EURUSD Short: Bears Defend 1.1670 Resistance, Downside FavoredHello traders! Here’s my technical outlook based on the current EURUSD (4H) chart structure. EURUSD has been trading inside a broad descending channel after rejecting from multiple pivot points near the upper trendline resistance. Earlier, price formed an inverse head and shoulders pattern and rallied higher, but the recovery stalled near the 1.1670 supply zone, where sellers regained control.
Currently, EURUSD is trading below the 1.1670 supply zone while holding above the 1.1570 demand zone. Price recently attempted a breakout above the descending trendline but failed to sustain momentum, creating a fake breakout and confirming that resistance remains firmly in place.
As long as EURUSD remains below the 1.1670 supply zone and continues to respect the descending channel resistance, the bearish scenario remains valid. A continuation lower could push price toward the 1.1570 demand zone (TP1). Manage your risk!
EURUSD: Triangle Structure Points to Possible Drop Toward 1.1590Hello everyone, here is my breakdown of the current EURUSD setup.
Market Analysis
EURUSD previously traded inside a broad downward channel while also forming a large triangle pattern. After breaking above the triangle resistance, price rallied into the 1.1660 resistance zone and reached a local peak within the descending channel structure.
Currently, EURUSD is trading between the 1.1660 resistance zone and the 1.1590 support zone. Price recently failed to hold above resistance, creating another rejection near the upper boundary of the triangle resistance line. At the same time, the ascending triangle support line continues to provide short-term support, keeping the market in a compression phase.
My Scenario & Strategy
As long as EURUSD remains below the 1.1660 resistance zone and continues to respect the triangle resistance structure, the bearish scenario remains valid. A rejection from current levels could push price toward the 1.1590 support zone (TP1).
However, if EURUSD breaks above the 1.1660 resistance zone and confirms a breakout of the triangle resistance, the bearish outlook would weaken and a stronger bullish continuation could develop.
That’s the setup I’m tracking. Thank you for your attention, and always manage your risk.
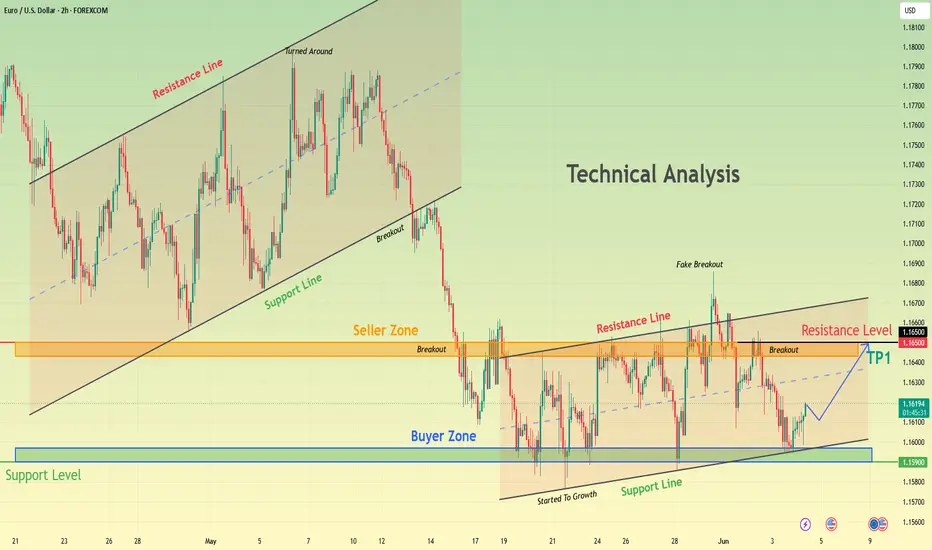
EURUSD Rebounds From Buyer Zone – Recovery Toward 1.1650Hello traders! Here’s my technical outlook based on the current EURUSD (2H) chart structure. EURUSD previously traded inside a broad ascending channel. After reaching a major turning point near the channel high, price lost bullish momentum and broke below the ascending support line, signaling a shift in market structure. Currently, EURUSD is trading inside a smaller rising channel after finding support near the 1.1590 Buyer Zone. Despite the recent decline, the ascending support line remains intact and continues to provide short-term bullish support. As long as EURUSD holds above the 1.1590 Buyer Zone and respects the ascending support line, a recovery toward the 1.1650 Resistance Level (TP1) remains possible. However, failure to hold support could invalidate the bullish setup and expose the pair to a deeper decline. Please share this idea with your friends and click “Boost” 🚀
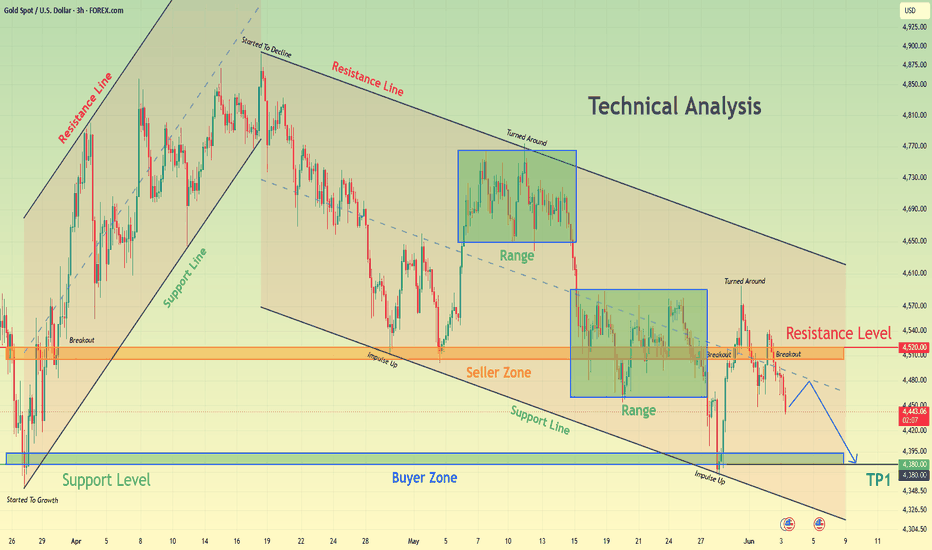
XAUUSD Faces Resistance Rejection, Bears Target 4,380$ SupportHello traders! Here’s my technical outlook based on the current XAUUSD (3H) chart structure. XAUUSD previously traded inside an ascending channel after recovering from a major support level. Following a rejection from the upper resistance line, price broke below the bullish structure and transitioned into a broader descending channel. Since then, multiple consolidation ranges have formed within the bearish trend, confirming continued selling pressure. Currently, XAUUSD is trading below the 4,520 seller zone while holding above the 4,380 buyer zone. Price recently failed to maintain momentum above the resistance level and was rejected again near the descending channel resistance, signaling that sellers remain in control. As long as XAUUSD remains below the 4,520 resistance zone and continues to respect the descending channel resistance, the bearish scenario remains valid. A continuation lower could push price toward the 4,380 buyer zone (TP1). Please share this idea with your friends and click “Boost” 🚀
GOLD - Bear market. A correction before the decline ICMARKETS:XAUUSD has broken below consolidation support, exiting the range and transitioning into a continuation of the downtrend. The key drivers are Friday's NFP report and a strong U.S. dollar
Gold is experiencing a bearish shift in both its fundamental and technical backdrop. The labor market report has altered expectations for future Fed policy, while the break below the 200-day SMA is adding significant pressure to the metal. The only notable positive factor remains the COT data: smart money positioning continues to be bullish and is at an 18-week high, even as price continues to decline.
A short-term corrective rebound toward the 4,368–4,400 area remains possible before the downtrend resumes. A close below 4,300 would open the path toward 4,260, followed by the 4,160–4,030 zone. For a trend reversal to occur, price would need to recover above 4,510–4,590, which can theoretically be viewed as the key reversal threshold
Resistance levels: 4,368, 4,400
Support level: 4,300
At the end of the trading session, the market began a correction that may extend toward the highlighted areas of interest at 4,368–4,400. A short squeeze could trigger a continuation of the decline toward the key daily level and liquidity zone at 4,300
Best regards, R. Linda
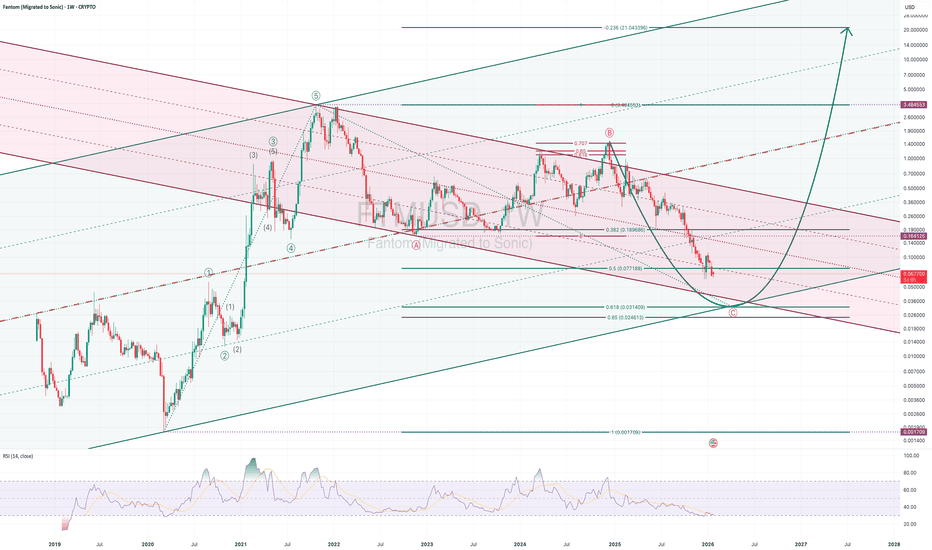
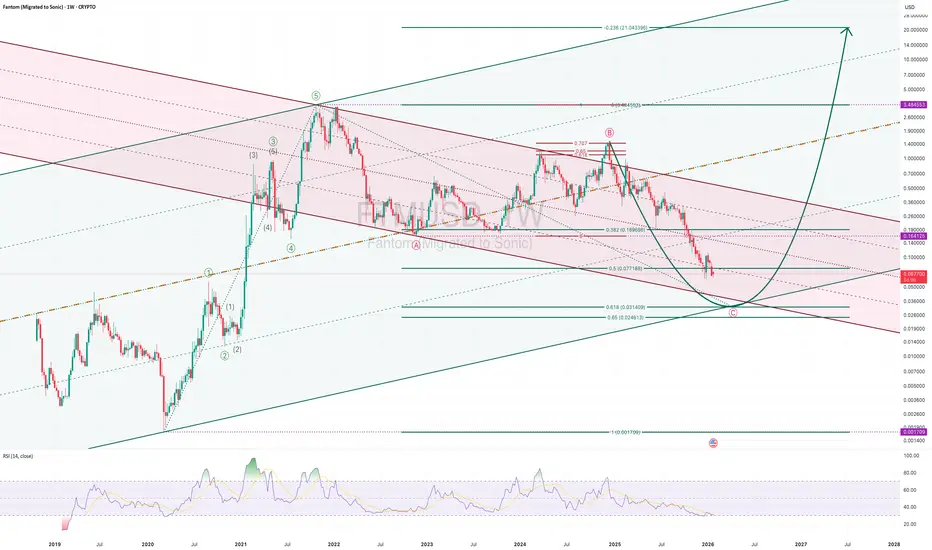
FTM [FANTOM] EWP TC FIB ANALYSIS WEEKLY TFFTM – Weekly Structure Overview
Price completed a clear 5-wave impulse from the 2020 low into the 2021/22 peak. Since then, the market has been unfolding a higher-degree A–B–C correction within a descending channel.
Wave B stalled in the typical 0.618–0.707 Fibonacci retracement zone, followed by an impulsive decline forming Wave C. The current selloff remains technically corrective and is approaching a strong confluence support area between the 0.5–0.618 retracements, aligned with long-term channel support.
Structure suggests late-stage correction, not trend failure.
A completed Wave C would open the door for a new primary impulsive cycle.
Key Takeaways:
• Macro trend remains structurally intact
• Current price action appears to be late-stage corrective behavior
• No bullish confirmation yet — but downside risk is approaching exhaustion levels
• Patience is required until Wave C completes and structure confirms
Like and follow for more charts like this.
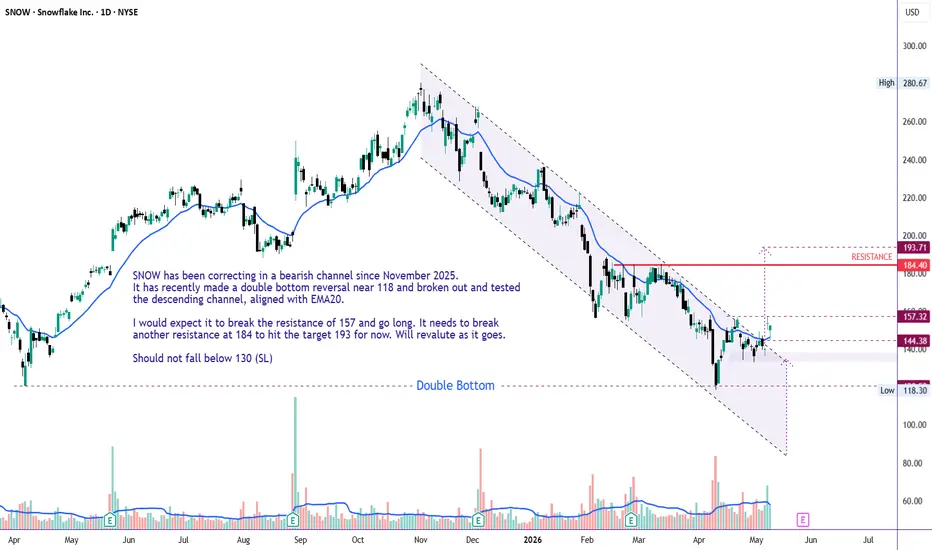
Double Bottom Reversal and Channel breakoutSNOW has been correcting in a bearish channel since November 2025.
It has recently made a double bottom reversal near 118 and broken out and tested the descending channel.
I would expect it to break the resistance of 157 and go long. It needs to break another resistance at 184 to hit the target 193 for now. Will revaluate as it goes.
Should not fall below 130 (SL)
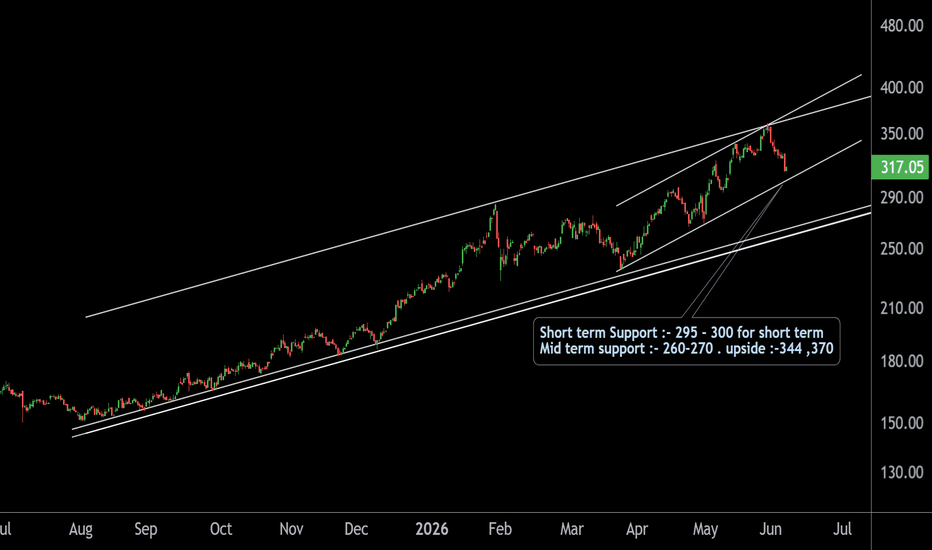
VEDL Near a High-Probability Support Zone – Is the Next Rally LoThe stock remains in a well-established long-term uptrend, trading within a defined ascending channel. Following a strong rally, the recent price correction appears to be a healthy retracement rather than a change in the prevailing trend.
The 295–300 zone represents a critical short-term support area, coinciding with the rising trendline and acting as a key level to monitor for potential buying interest. A sustained hold above this range could support the continuation of the broader upward movement.
From a medium-term perspective, the 260–270 zone serves as a major structural support area. As long as the stock remains above this level, the overall bullish outlook remains intact.
Upside objectives are placed near 344 and 370, while the current trend structure continues to favor buyers above the identified support zones.
Conclusion
The ongoing pullback should be viewed within the context of a broader uptrend. Market participants may closely watch the 295–300 support region for signs of stabilization, as a positive price reaction from this area could pave the way for the next leg of the upward move.
Thank you !!
GBPUSD to retest 12-month long Support zone?Broadly price is moving in a sideways direction, consolidating between the resistance zone at the level around 1.3652 & the support zone which is at the level around 1.3175.
Price is moving downward after retesting the Resistance zone, in a declining channel, respecting the lower and upper boundaries of the channel multiple times as marked by Green and red arrows.
Most Recent rejection from the upper boundary of the channel as marked by yellow arrow, has led us to think of the move that can lead the price till the confluence of lower boundary of the channel & Support zone.
Emergence of a symmetric Triangle acting as a consolidation formation before breaking in the downward direction, validate our outlook!
To capture this expected decline we can plan for a short trade
High risk short entry @ 1.3402
Low risk entry @ 1.3363
Stop loss around 1.3488
For the target of 1.3200
Strict Risk management should be applied and Position should be sized according to individuals risk appetite.
For Educational Purposes only, Not an Investment Advice
Preparation and script for the Nasdaq 100 H1 cash sessionOn the H1 timeframe, the price has been moving within a downtrend channel from the all-time high to the present (with a brief upward breakout yesterday, but it quickly returned to the channel overnight, which is bad news for the bulls)
Bulls: will definitely want to hold the current lows and bounce back up toward resistance—the green lines on the chart indicate the range of movement.
Bears: will try to push the price down to the lower side of the channel; the red lines indicate the range of movement, and support levels are marked horizontally.
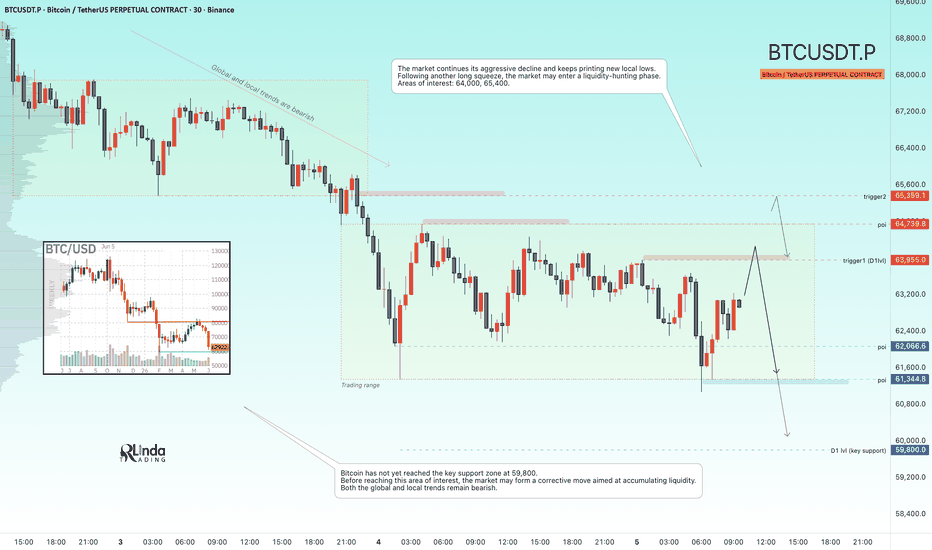
BITCOIN - A pullback before a drop to 60K, or perhaps even lowerBINANCE:BTCUSDT is moving toward 59,800 — the key support zone. However, after retesting a local level, the market is forming a correction against the broader trend
The market remains in panic mode and is testing the 60K area. Dynamic buyers have yet to appear, while fear continues to intensify. A move below 60K could trigger a cascade of liquidations, as many institutional hedging strategies are concentrated around this level.
There is currently no fundamental support for the market, while a series of weak news catalysts has fueled aggressive selling. Large funds continue transferring Bitcoin to exchanges.
Technically, the primary area of interest remains 59,800–53,300. Before reaching this target zone, Bitcoin may enter a local corrective phase
Resistance levels: 64,000, 64,740, 65,360
Support levels: 61,350, 59,800
A long squeeze from local support is driving the current correction. Technically, this is not buying pressure but rather a reaction to profit-taking. The market has entered a liquidity-hunting phase ahead of a potential continuation lower. Key triggers (areas of interest) are located at 63,955 and 65,360. A short squeeze could trigger the next leg down.
Best regards, R. Linda
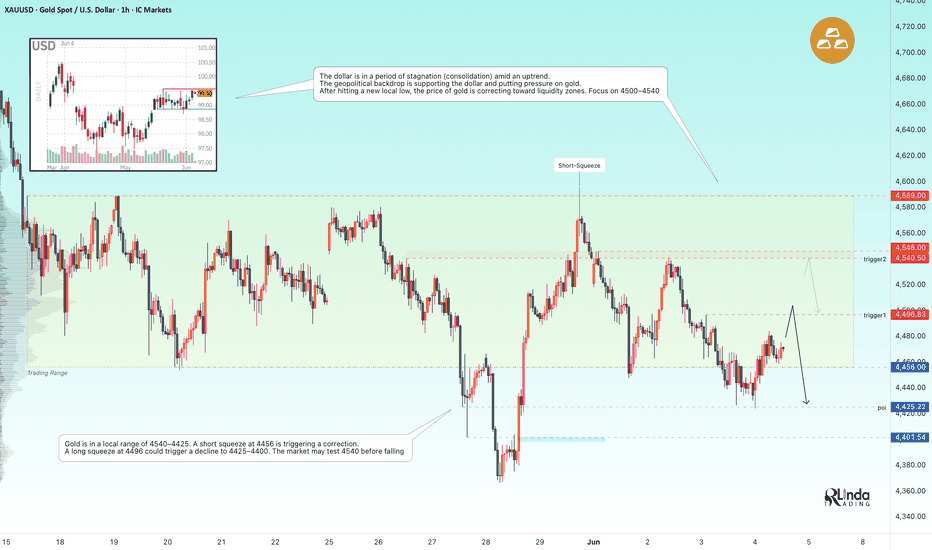
GOLD - The bearish trend may continue...ICMARKETS:XAUUSD has entered a corrective phase after printing a new local low. Against the backdrop of a strong U.S. dollar, the bearish trend in gold may continue...
Gold has received temporary relief from ceasefire-related headlines, but pressure from the dollar and hawkish Fed expectations remains intact. The key event ahead is Friday’s Non-Farm Payrolls (NFP) report. Geopolitical developments continue to play a decisive role.
Technically, within both the global and local downtrend, gold is consolidating inside the 4425–4550 range. Due to the uncertainty factor, the market has entered a corrective phase and a liquidity-hunting stage, during which it may test either 4496 or 4540 before resuming its decline.
Resistance levels: 4496, 4540, 4589
Support levels: 4456, 4425, 4400
The U.S. dollar remains in stagnation (consolidation) within a bullish trend. The geopolitical backdrop continues to support the dollar and weigh on gold, which is currently in a corrective phase. A short squeeze at 4496 could trigger a decline toward 4425–4400. Additionally, if the market fails to react at 4496, gold may test 4540 before moving lower.
Best regards, R. Linda
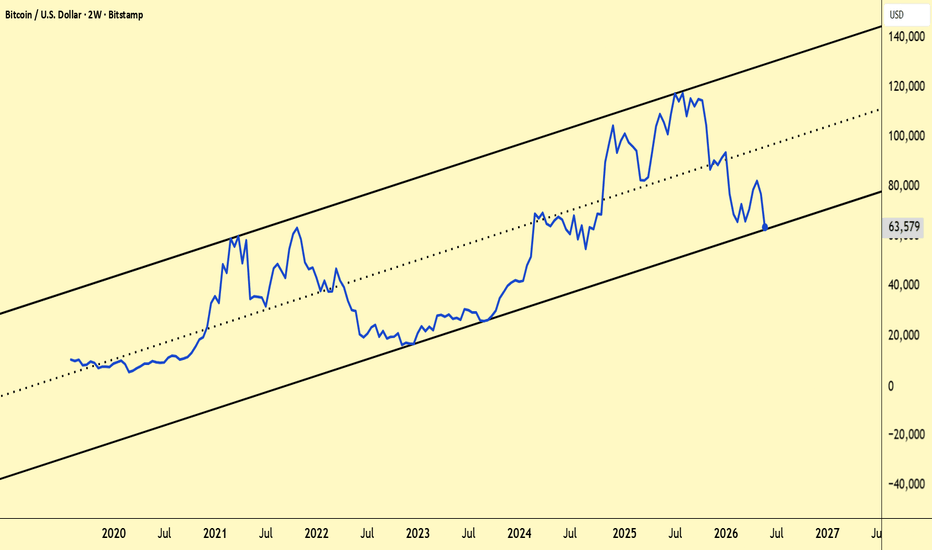
BTC heading sub 50K levels ?Declining channel is intact since October 2025, and price is respecting its boundaries by taking support & resistance form the lower & upper boundaries of the channel, as pointed by green and red arrow.
For the period of 4 months price consolidated near its support level of 62,300 and had showed multiple bounces in the upper direction, which couldn't sustain, now price is at an crucial point where, it's threatening the long standing support level so 60,000.
It 60k is out then consider a quick down-move, following to that subsequent bearish moves can test the levels below 50,000 as per the structure of channel intact.
Strict Risk management should be applied and Position should be sized according to individuals risk appetite.
For Educational Purposes only, Not an Investment Advice
#RENDERBTC #3D (Binance) Descending channel break retest [LONG]Render Network pulled back to 50MA regain support, looks like it's heading towards 200MA resistance next.
⚡️⚡️ #RENDER/BTC ⚡️⚡️
Exchanges: Binance
Signal Type: Regular (Long)
Amount: 4.2%
Entry Targets:
1) 0.00002288
Take-Profit Targets:
1) 0.00003928
Stop Targets:
1) 0.00001741
Published By: @Zblaba
CRYPTOCAP:RENDER BINANCE:RENDERBTC #3D #RenderNetwork #AI #DePIN #Web3 rendernetwork.com
Risk/Reward= 1:3.0
Expected Profit= +71.7%
Possible Loss= -23.9%
Estimated Duration= 3-4 months
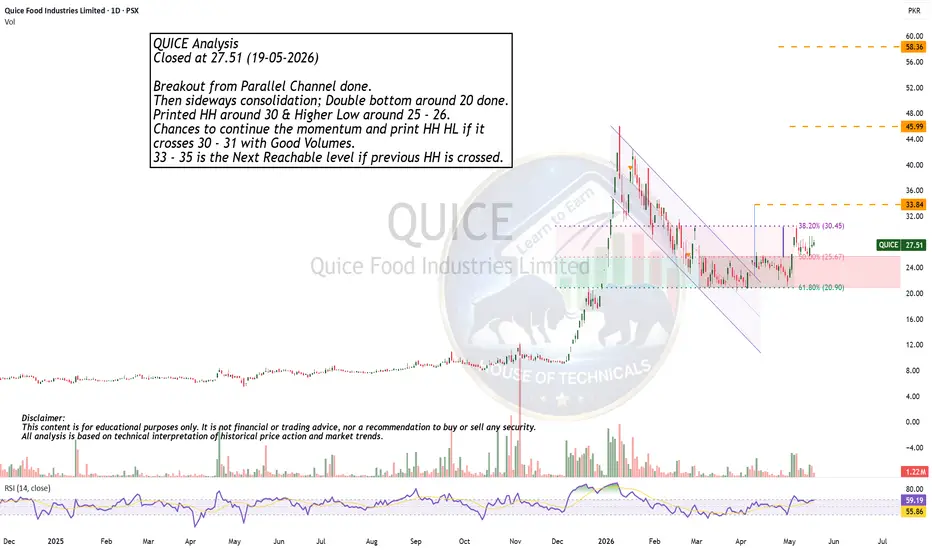
Breakout from Parallel Channel done.QUICE Analysis
Closed at 27.51 (19-05-2026)
Breakout from Parallel Channel done.
Then sideways consolidation; Double bottom around 20 done.
Printed HH around 30 & Higher Low around 25 - 26.
Chances to continue the momentum and print HH HL if it
crosses 30 - 31 with Good Volumes.
33 - 35 is the Next Reachable level if previous HH is crossed.