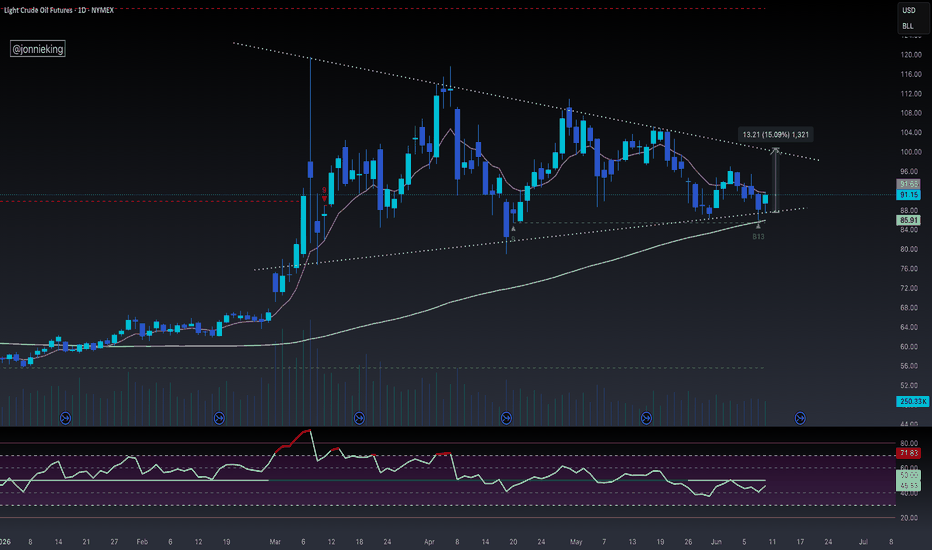
$OIL Long - Keep Support Retest + Buy SignalOpened a Long here on NSE:OIL
I normally don’t trade OIL because of how manipulated the market is with all these Trump Pump n Dump tweets, but the setup looks a bit too juicy to pass up.
Currently testing support on the 100D MA which coincides with the bottom of the bull pennant.
If PA doesn’t fall out of the pennant, at the very least we have ~15% gain if price reaches $100, which seems extremely feasible considering there is no clear off-ramp whatsoever for the war in Iran and opening t
Pennant
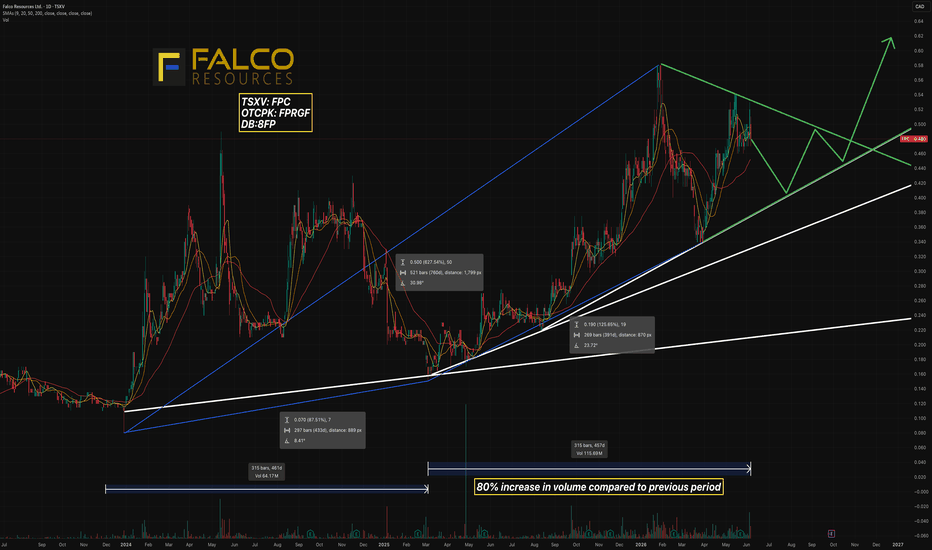
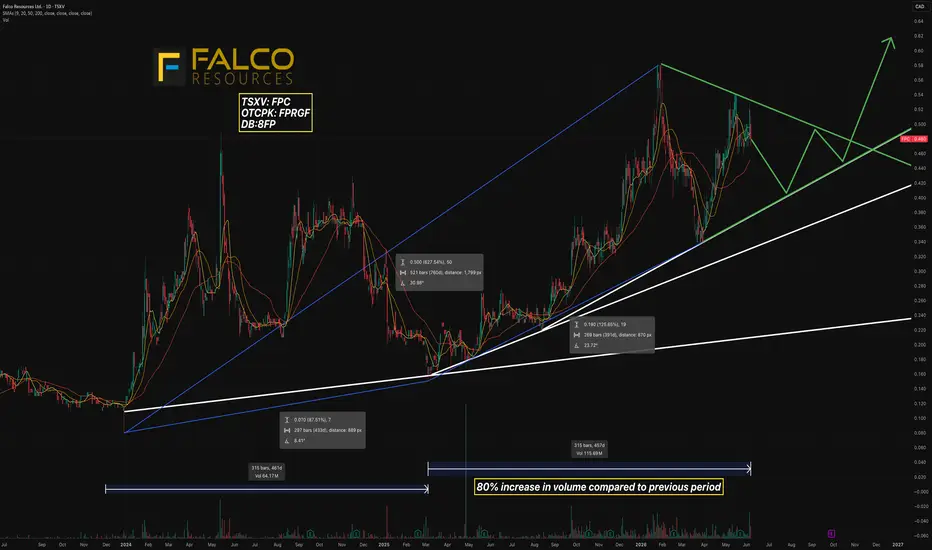
Falco Resources (TSXV) | Volume Expansion + Pennant SetupTSXV:FPC
One of the more interesting junior mining charts developing right now.
After a multi-year accumulation phase, FPC has constructed a clear bullish fan pattern. Each successive trendline break has resulted in a steeper rate of ascent, signaling increasing demand and strengthening market participation.
What's particularly notable is the volume profile.
The current advance has generated approximately 116M shares traded versus roughly 65M shares during the previous comparable period —
Lonely at the Top? Not for Long.📊 AUD/JPY | 4H Analysis
Everyone's shorting this one. Here's why I'm not. 👇
Structure: 📐 Ascending triangle forming on the 4H — price coiling up against 114.73 resistance 🕯 Beautiful bullish pin bar printed right on the trendline — rejection of lower prices
The contrarian edge: ⚠️ Majority of retail traders are SHORT on AUD/JPY
When the crowd is this one-sided, I start looking the other way. 🧠
3 ways to play this:
1️⃣ Aggressive — Pin bar entry now, stop below pin bar low, target breakout
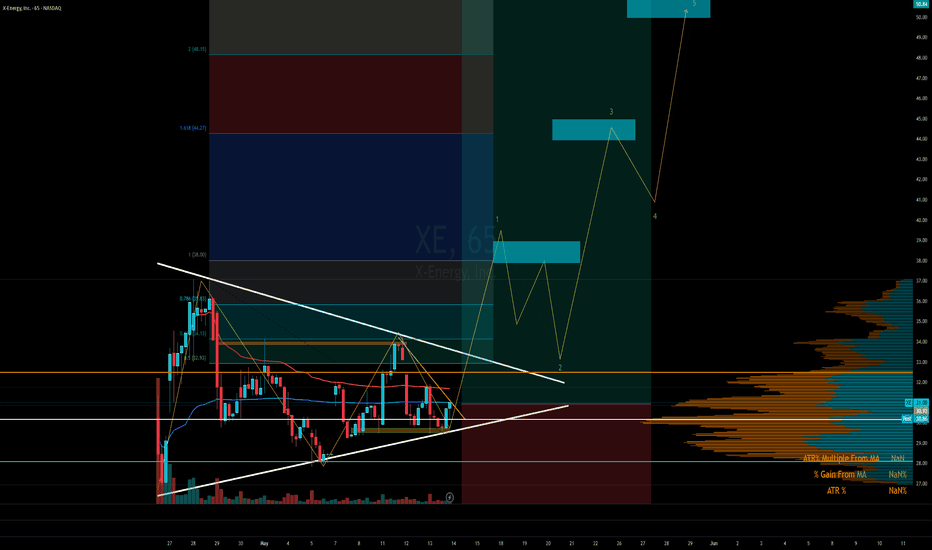
XE - Compressed and About to Pop !
3 Strong themes in this : AI Theme + Energy Theme + Nuclear Theme
+ Amazon backing with 20% stake
XE price is getting compressed here forming a pennant pattern.
High probability is this could resolve with a break out move to the upside.
Target 1 - 38
Target 2 - 45
Target 3 - 50
Stop loss - 25
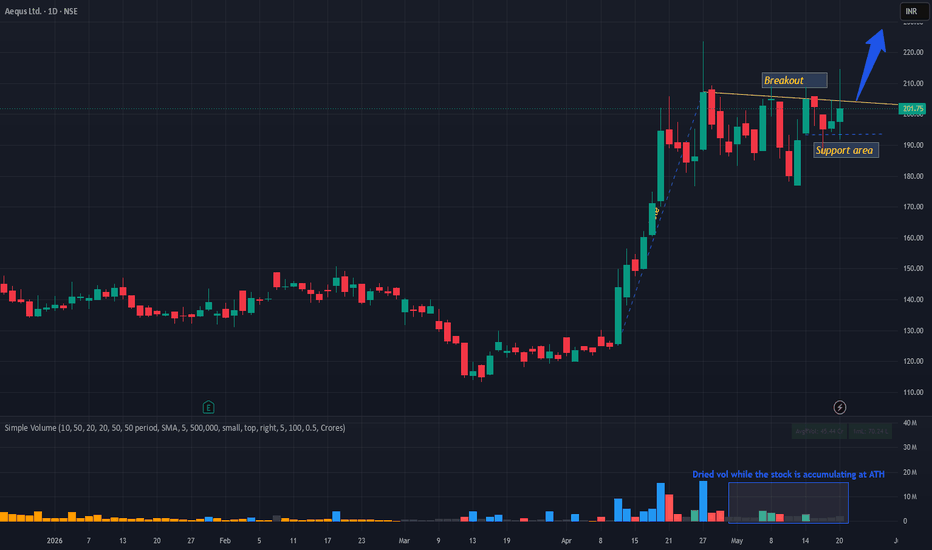
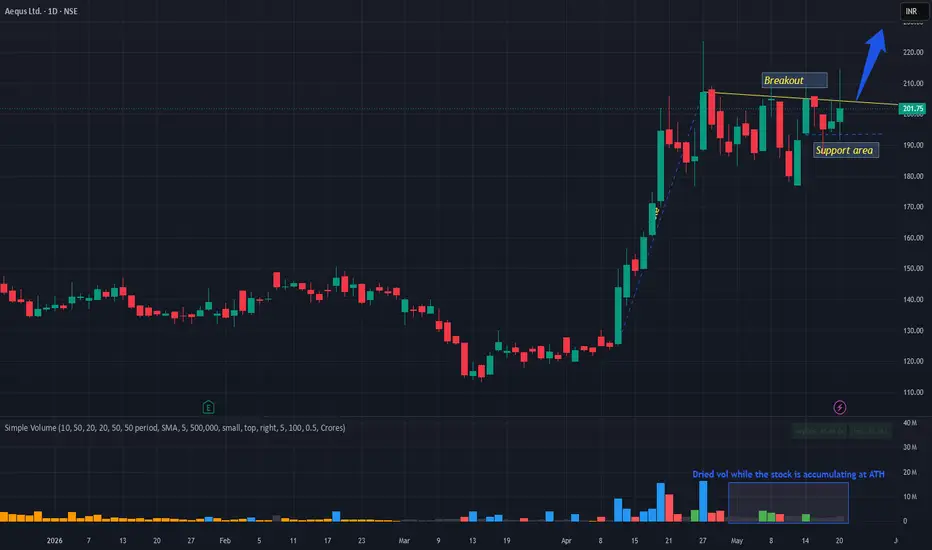
AEQUSAEQUS is nearing flag-pole breakout. Today it has shown devent volume as well. In recent days the stock was trading at ATH with dried volume. We can say this was institutional buying. So once it come out above 205-7 level n sustain then it may push towards new rally. Support seems near 194. So risk reward too is quite in favor. Keep it in yr watchlist.
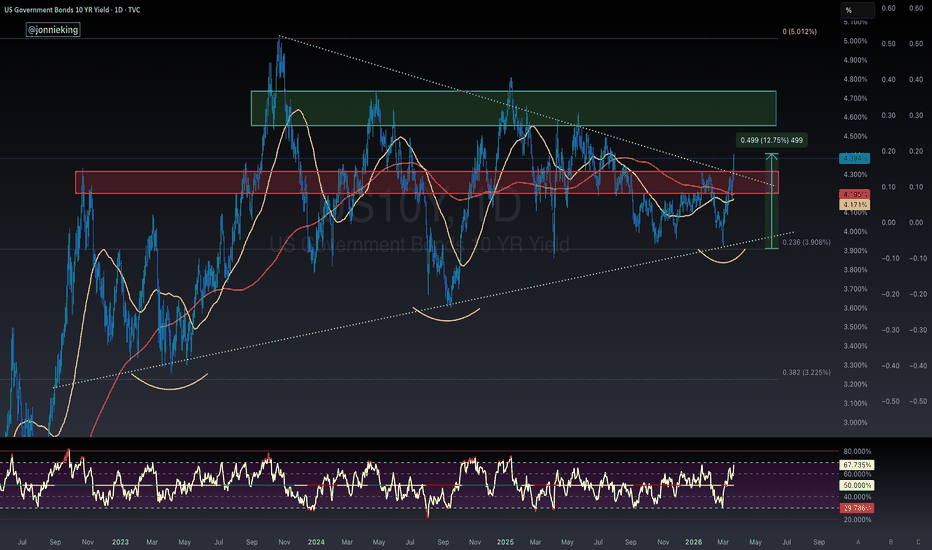
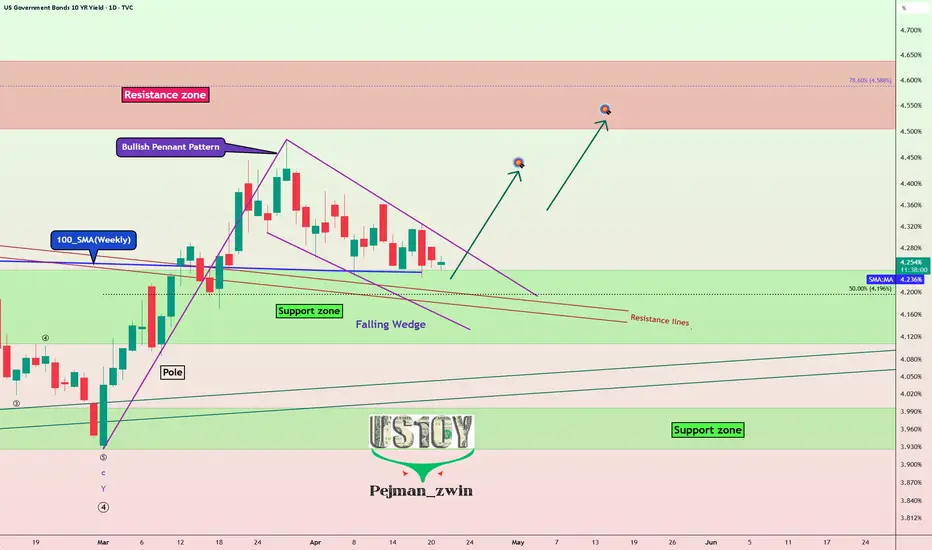
US10Y Is Waking Up — Major Markets Could Feel It!Today, we’re taking a closer look at the U.S. 10-Year Government Bond Yield ( TVC:US10 ) on the daily timeframe. This metric reflects the return investors earn from holding 10-year U.S. Treasury bonds and serves as a key indicator of market sentiment toward the U.S. economy. Because of its importance, movements in this yield play a major role in shaping capital flows across different asset classes and influencing overall financial conditions.
------------
Let’s look at US10Y on the daily timef
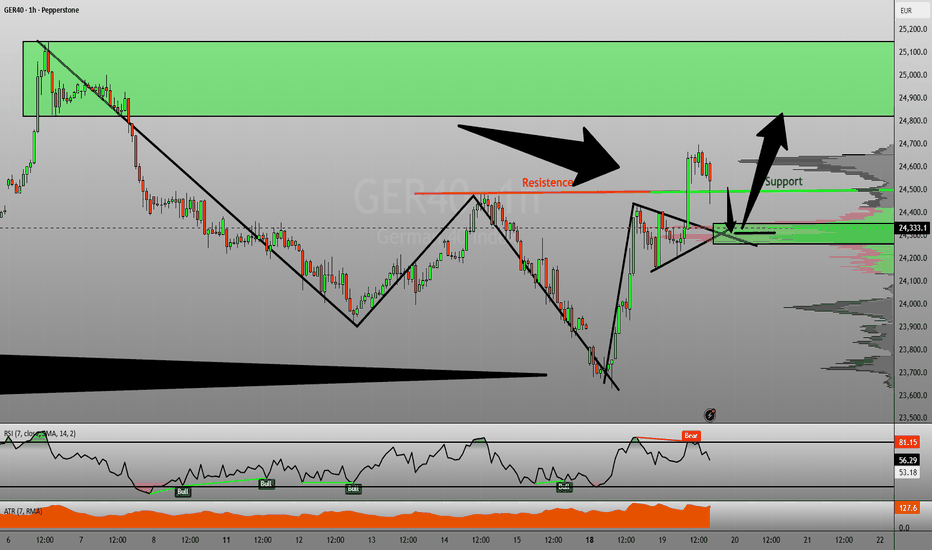
DAX Pullback Sets Up Potential Bullish Continuation OpportunityThe DAX continues to show signs of bullish strength after recently breaking and closing above a key structural resistance level. Following the breakout, price is now pulling back into the previous area of interest, creating the possibility for a continuation trade should buyers step back into the market.
While the broken structure level itself is important, the primary focus is actually the previously broken bullish pennant pattern. That breakout zone now acts as a much larger area of potential
US10Y Massive Weekly Close Breakout - 5% Next !?THE US10Y IS THE BEACON OF TRUTH IN FINANCIAL MARKETS.
As predicted, the 10Y yield is back above 4.6% and have officially entered the danger zone.
The US Guvament has to refinance ~$9.8T of debt this year with the biggest intra-year cliffs in February and August.
I think we all remember what happened to CRYPTOCAP:BTC in February; don’t be surprised if we see the same in August.
If yields stay elevated for the next couple of Weekly Closes outside of this massive 6-year bull pennant, then I
Nasdaq Head and Shoulders with EVENING STAR IT'S OVER📋 NQ TRADE PLAN — TUE MAY 12, 2026
Current: 29,290 (London KZ, post-overnight bear thrust)
24h Range: 29,227 ↔ 29,479 (252pt — wide)
Bias going in: BEARISH structural, bull bounces tradeable
🗺️ KEY LEVELS
Zone Price Type
Strong resistance 29,500 Round number
Resistance 29,479-80 Yesterday RTH BSL (4× rejected)
Resistance 29,455 ETH bounce high
Pivot 29,400-410 OB / failed RTH pivot
Major flip 29,377 Yesterday RTH SSL → now resistance
Mid 29,300 Round / current chop center
Local low 29,271-79 Pr
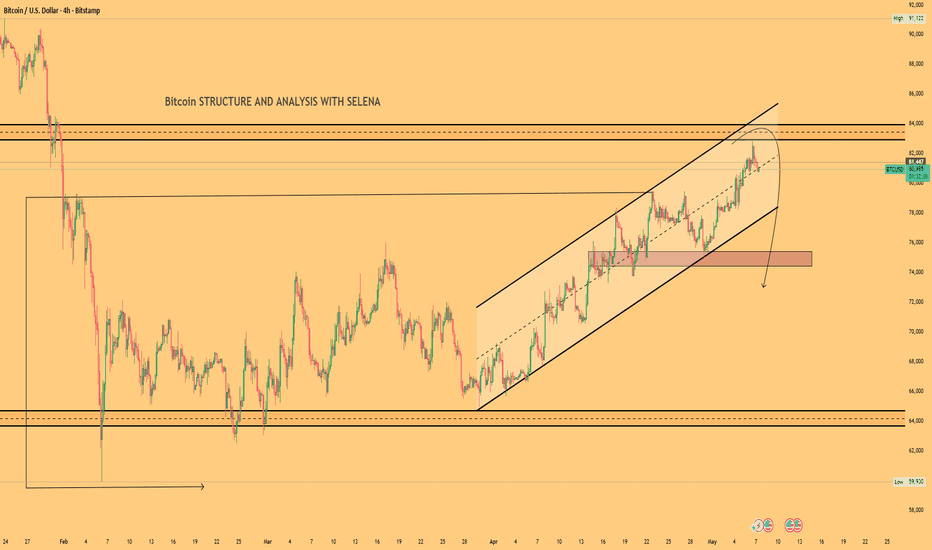
Selena | BTCUSD 4H – Liquidity Rejection Near Major ResistanceBITSTAMP:BTCUSD
✅ Bullish Case 🚀
If BTC holds the 74k–75k demand area after retracement, bullish continuation remains highly probable.
Strong buyer reactions from that region could drive price toward:
🎯 84k resistance
🎯 88k liquidity region
🎯 New external highs above current structure
❌ Bearish Case 📉
Failure to defend the highlighted demand zone could trigger deeper corrective movement.
Sustained weakness below demand may expose:
🎯 72k support
🎯 68k imbalance region
🎯 Previous accumulation ra
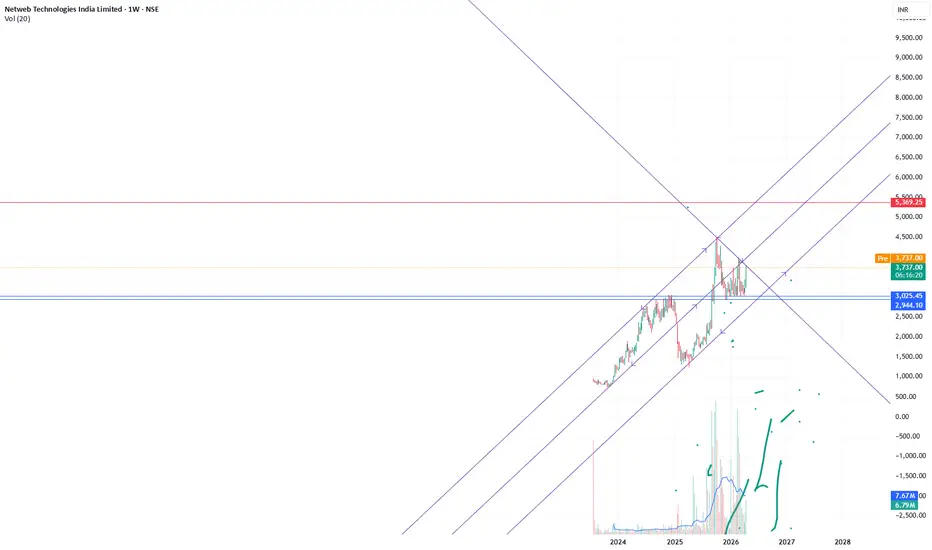
NETWEB | Pennant Formation Inside Rising Broad Channel | 5300+ PNETWEB is currently consolidating in a pennant formation after a strong up move, and the structure is developing within a broader rising channel, which keeps the overall trend constructive.
Chart View:
Price continues to respect the broader upward channel
After the recent rally, the stock has moved into a tight pennant consolidation
This kind of setup often acts as a continuation pattern, provided the breakout comes with strength and volume
Trade Thesis:
A decisive breakout above the pennant r
EUR/JPY Bulls Circle as BOJ Decision Loomsith the price coiling within a structure resembling a bull pennant, and with signs momentum may be starting to turn, traders should be alert to the risk of a bullish breakout and retest of the April highs in EUR/JPY. After a strong rebound from the swing low set in late March, the pair has spent much of the past fortnight consolidating in a compression pattern characterised by a series of higher lows and lower highs on the H4 chart.
After grinding higher late last week, the price now finds itse
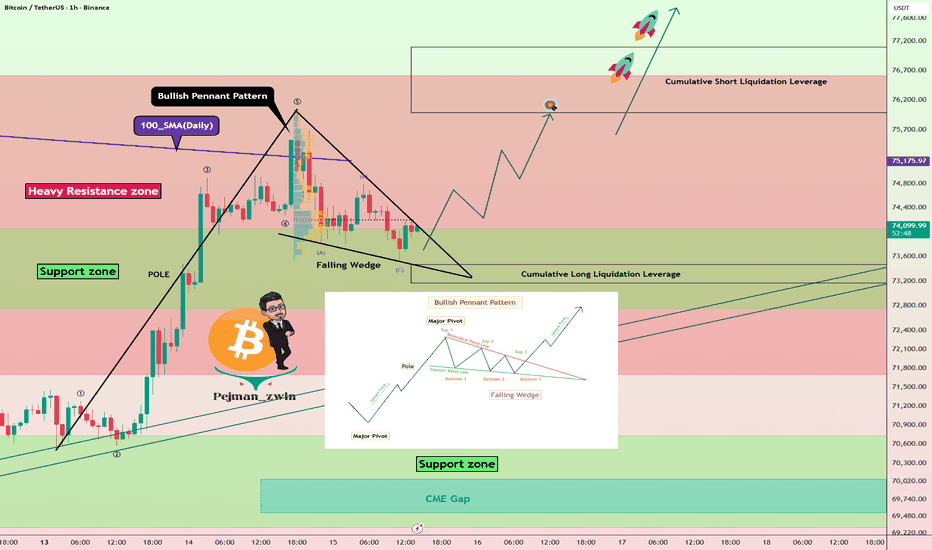
Bitcoin Roadmap: Bulls Aren’t Done YetOver the past two days, Bitcoi n( BINANCE:BTCUSDT ) began to rise and gained over +7% in price, surprising many traders—though, as I expected in a previous idea , I had analyzed this and hit all targets.
Currently, Bitcoin is still moving within the heavy resistance zone($76,600-$71,700) and near the support zone($74,000-$72,760) and Cumulative Long Liquidation Leverage($73,470-$73,170).
From a classical technical analysis perspective, Bitcoin may continue its upward trend and break the heav
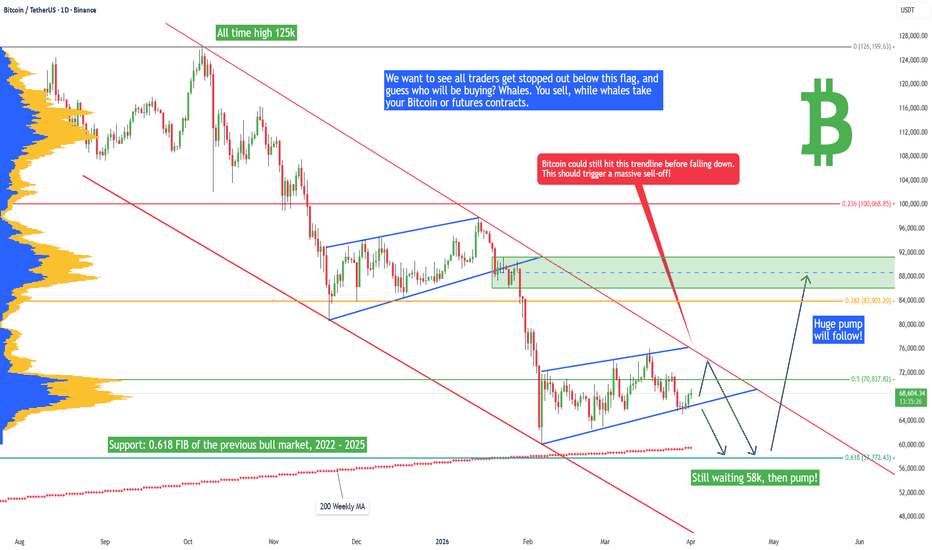
Bitcoin - 58k soon, then rally 88k! (Best opportunity, must see)Bitcoin has been pretty boring in past weeks, but this should change very soon. I am still expecting a last drop to 58k, but then a huge pump to 88k! Why? First of all, I think Bitcoin has been consolidating in this bearish flag for many weeks, and bearish flags are in general negative patterns for the price. There is a much higher probability of going down. So many traders have their stop-loss places below the bear flag, so what we want to see is a liquidity sweep! We want to see all traders ge
EURUSD | What if this level breaks?
Price is trading into higher timeframe supply after taking liquidity above recent highs.
At first glance, this looks like a normal reaction.
But zooming out tells a different story.
The 2022 low wasn’t random.
It was created during macro pressure.
That level still sits below. Untouched.
If this level fails,
price may revisit what was created under stress.
Prediction Markets Tighten Rules As Insider Trading Ban BeginsPrediction markets just entered a critical phase. Platforms now face rising scrutiny from regulators and lawmakers. At the same time, user trust depends on fairness and transparency. This balance creates pressure on every major platform.
The recent prediction markets crackdown shows how fast the landscape changes. Kalshi and Polymarket introduced strict rules on the same day. Meanwhile, lawmakers pushed a bill that could shut these platforms down. This timing reflects urgency across the industr
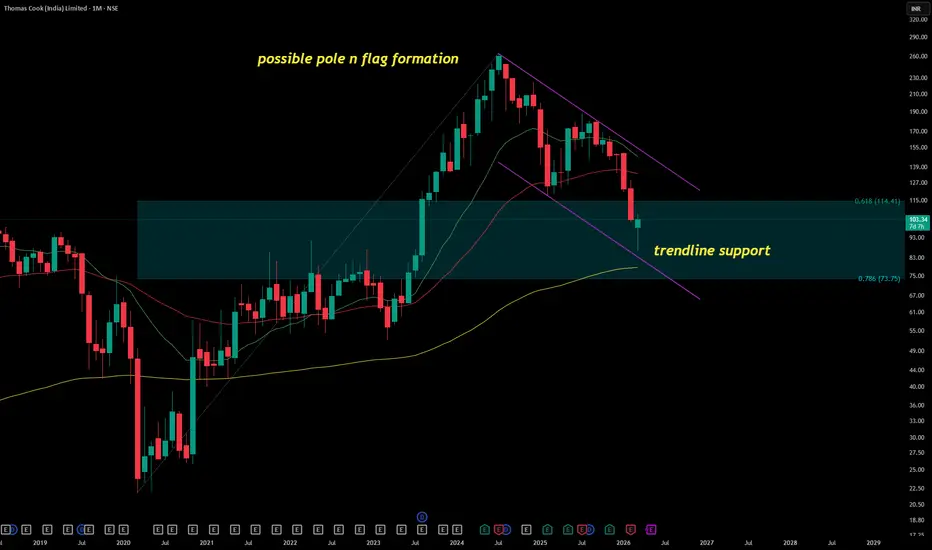
THOMAS COOKThomas Cook (India) Ltd. (NSE: THOMASCOOK) is a mid‑cap travel services company offering foreign exchange, holiday packages, corporate travel, and visa services. It is part of the Fairfax Financial Holdings Group (Fairbridge Capital Mauritius Ltd.), which is the promoter. As of Dec 2025, promoters hold 63.83%, with balanced institutional and retail participation.
FY22–FY26 Snapshot
Revenue Growth: CAGR ~11–12% over FY22–FY26, driven by recovery in travel demand post‑COVID. → Good
Net Profit: F
GOLD sell we are building nice Price action.
This is high probability trade here, wait for brake out of trend line to go short.
This ascending channel brake out and form a kind of flag and we brake out of flag with smaller flag that is going to be our entry!
Trade your strategy in short direction.
BE safe!
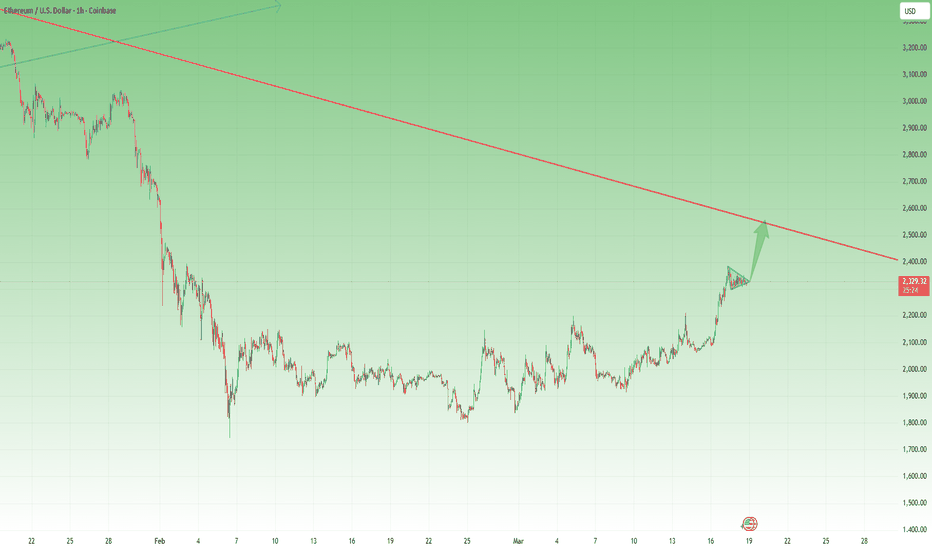
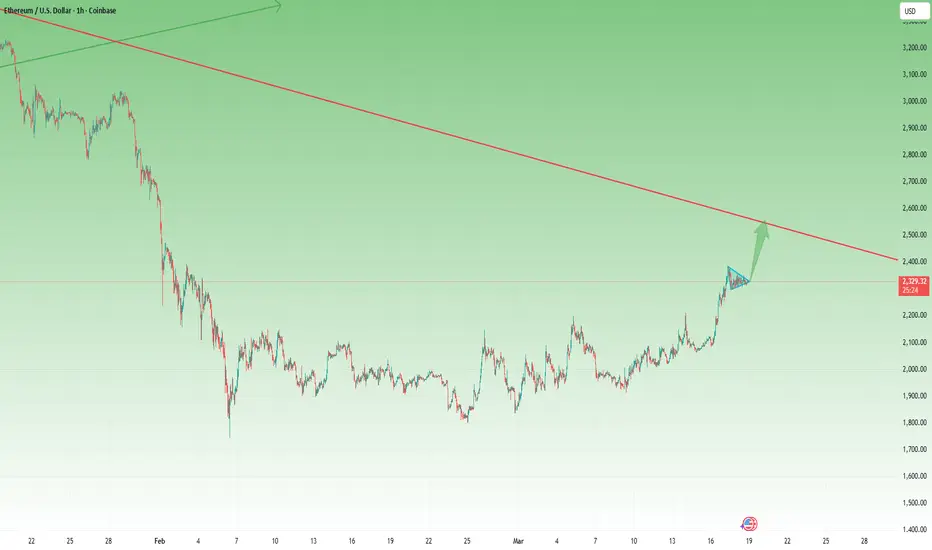
Eth- Another push to 2500?In my previous Ethereum analysis, I mentioned that the 1800 zone had a high probability of acting as a temporary low, with good chances for an upside reversal.
So far, the market has behaved in line with that expectation.
ETHUSD reacted well from that area and moved higher, and since my entry, the position is currently up around 15%, confirming that buyers were indeed willing to step in at those levels.
A Reversal… But Not the Bottom
That being said, it is important to separate a tradable
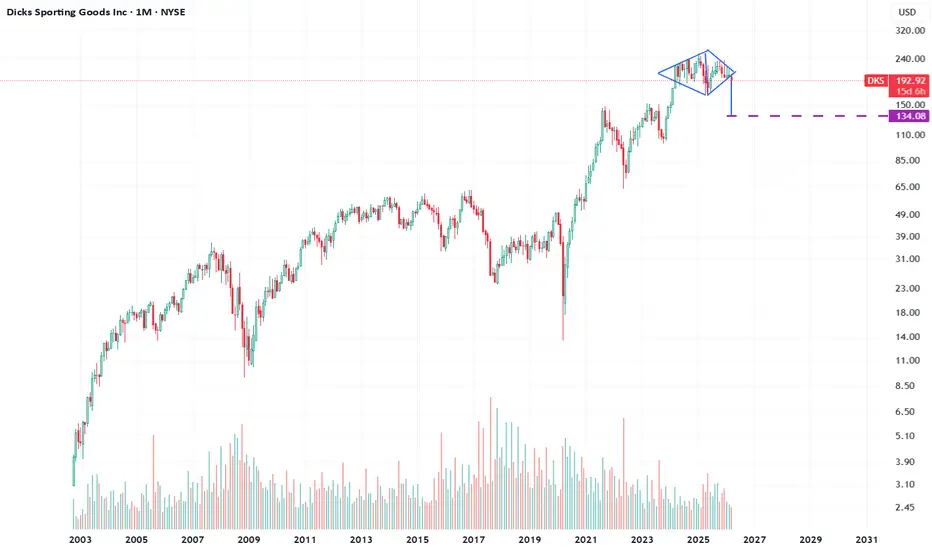
DKS - rare diamond pattern formed at potential top of bull trendBearish - Diamond top ? if price turns round and shoots out the top then bull continuation if wrong. But I think the tops in for US equites at some point this year so why not now?
Pattern is not perfect but it looks there to me
Here are the main reasons Dick’s Sporting Goods (DKS) could move lower, ranked most important first:
Lower-than-expected earnings outlook – Even after strong recent results, the company projected future earnings below analyst expectations, which can trigger selling.
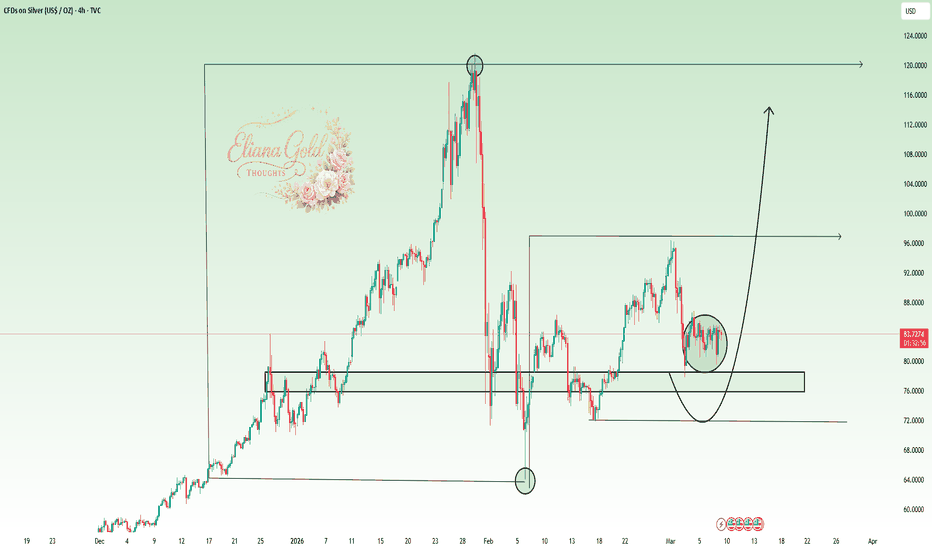
Eliana | XAGUSD · 4H – Accumulation Before Bullish ExpansionFX:XAGUSD
The market is currently consolidating around the mid-range between 80 and 88. This structure often indicates accumulation where liquidity builds before the next directional move. The recent reaction from the demand zone around 76–78 suggests buyers are gradually regaining control. If price holds above this support structure, the market could initiate a new bullish expansion phase targeting the upper liquidity zones.
Key Scenarios
✅ Bullish Case 🚀
Hold above 76 – 78 demand zone
🎯 Ta