Short
ShortPitchforks
Short
Elliott wave analysis of SPXDaily candles with repeated lower highs and lower lows since ATH on 13 August 2026.
With today's low, which broke high of 15 June, impulse wave of lower degree has been invalidated (red count).
Ending diagonal wave (5) of ((5)) remains in play above support of 7433.65.
Wave (1) > (3) > (5), price should not exceed 8151.54. For price to tag median line, looking for new highs before ~ midterm elections (3 November 2026).
3-4:1 reward/risk for long position above 7433.64.
 Long
Long
Elliott wave analysis for US500This count has wave (4) of ((5)) complete, wave (5) of ((5)) in progress.
Wave (1) overlaps with wave (4), so this count considers wave ((5)) an ending diagonal.
Wave (5) needs to be shorter than wave (3), so count is valid with wave (5) finish below 8169.2. For wave (5) to be valid and tag median line, top should form before end of October 2026 (mid-November if viewed on daily timeframe).
This week's low could go lower next week, and this count would still be valid. Wave (4) just needs to finish above 7422.1).
A long with low of week as stop and median line as profit target has 4-5:1 reward/risk ratio.
Long
Elliott wave analysis of ES1! (US500)I still anticipate a final move towards 8000 to tag the median line and complete the impulse from October 2022 low.
Wave 4 of (5) can finish anywhere above 7438.50. Any move below 1 June high of 7632.25 would turn wave (5) into a diagonal.
Count valid above 7438.50, below 8241.25.

Gold in RM pergram. 28/August/26Warning!! Whoever used to invest in gold and make some profit better release it at around 620 RM pergram!.


Gold. will continue surging after breakout? 20/August/26Xauusd's major downtrend line for many months finally broken after US Dept of Treasury said it will increase at least double! the size to buyback = QE! What will happen to Gold and Equity market soon? by next Fed next rate decision on Mid of Sept?

Gold wave analysis 6/August/26XAUUSD breakout of triangle probably created panic and FOMO on market sentiment...gold price could have a deep pullback until around coming NFP..

Elliott wave analysis for NAS100.I wanted to focus on the corrective structures that have occurred after the October 2022 bottom.
Liberation Day gave us a zigzag, truncated C wave and sharp reversal to the upside.
5 months of price action from October 2025-March 2026 gave us a regular flat, ending diagonal C wave, and sharp reversal upward.
June-July 2026 could be interpreted as another regular flat, but I am suspicious of two flats in a row. With the law of alternation, two flats would need to be interpreted as a 1/2, 1/2 rather than a 1/2/3/4. This would be very bullish, and price above 30758.3 and then 32711.1 would certainly go a long way to confirm that, and the bull market would then have many months left to it.
As long as price remains below the ATH of 30758.3, I remain suspicious that the top is in, and short positions entered near ATHs have an excellent risk/reward ratio. The anticipated structure would still be a flat, just of higher degree and with a large C down. Bears see a complete impulsive wave off of October 2022 low, 1>3>5, and bearish target towards Liberation day low of 16324.1 to complete the corrective structure.
 Short
Short
Gold finally break 2 bullish triangle! 5/August/26XAUUSD's bullish triangle just broken! What next? Trump 'hunger" for Mexico's TACO again? Maybe he try Italian Pizza first? later only TACO?

Gold Roller Coastering. 31/ July/26XAUUSD. Roller Coastering making us losing the sense of direction. Where should it leads us after stop rollering?
 Long
Long
Elliott wave analysis for NAS100.28187.2 held as support on 17 July, consistent with a diagonal (red ellipse). However, price action from that bounce does not appear impulsive, but rather a double three (W is zigzag, Y is regular flat).
Given this development, I see two possible scenarios:
1) 28187.2 holds as support and price goes for a (c) wave towards 30000, or
2) 28187.2 breaks on volume and confirms that the red ellipse is
a leading rather than an ending diagonal, suggesting price to go lower quickly, with targets including the median line of the pitchfork shown.
Short
Gold possible "bottomed". 8/July/26XAUUSD with Hong Kong Rollout of Gold Clearing system for China.. A "catalyst" for "faster" "Dedollarization"?
Long
LINK Price Climbs 4% as Whales Scoop Up $2.17M Worth of ChainlinChainlink (LINK) extended its weekly recovery on Wednesday, climbing more than 4% as investors returned to large-cap altcoins amid a broader crypto market rally. While Bitcoin and Ethereum provided the macro tailwind, LINK’s move appears to be backed by something stronger than market optimism. Fresh on-chain data shows record wallet growth, aggressive whale accumulation, and continued exchange outflows—three signals that often precede sustained upside when they align with improving technical structure.
Whale Buys $2.17 Million Worth of LINK
One of the biggest catalysts behind today’s price rally came from on-chain tracking platforms, which revealed that an anonymous whale accumulated approximately 273,793 LINK tokens, worth nearly $2.17 million, over the past two days at an average purchase price of around $7.94. The latest purchase reportedly occurred just minutes before the data surfaced, highlighting continued accumulation rather than a one-off transaction.
On-chain flows further strengthen the bullish narrative. LINK recorded more than $6.6 million in net exchange outflows over the last 24 hours and nearly $50 million during the past week, suggesting investors are steadily moving tokens off centralized exchanges into self-custody. Historically, declining exchange balances are viewed as a sign of reduced near-term selling pressure.
Chainlink Adoption Hits an All-Time High
Beyond whale activity, Chainlink’s network fundamentals continue to strengthen despite months of muted price action. According to on-chain data, the number of non-empty LINK wallets has surpassed 900,000 for the first time, setting a new all-time high. More than 20,000 new wallets have been added over the past month even as LINK traded near local lows.
The divergence between rising adoption and relatively subdued price performance suggests long-term investors have continued accumulating throughout the correction. Market analysts often view this type of accumulation phase as a constructive setup, particularly when network growth accelerates before price fully responds.
LINK Price Analysis: Can Bulls Push Toward $10?
LINK has staged a notable recovery after defending its long-term demand zone around $7.20-$7.40. The token has now reclaimed its short-term moving averages while breaking above a descending trendline that had capped price action since late May. Daily RSI has also climbed above 60, indicating strengthening bullish momentum without yet reaching overbought territory.
LINK price outlook
The next immediate resistance sits near $8.80-$9.00, where sellers previously rejected multiple recovery attempts. A decisive daily close above this region could accelerate buying momentum toward the psychological $10 level, followed by a stronger supply zone around $11.50-$12.00. However, failure to sustain above $8.20 may trigger a healthy retest of the breakout area before bulls attempt another move higher.
What’s Next for Chainlink?
Chainlink is increasingly showing signs that fundamentals are catching up with price action. Record wallet growth, multi-million-dollar whale purchases, and persistent exchange outflows suggest long-term conviction remains intact despite recent volatility. If broader crypto market sentiment stays supportive and LINK successfully clears the $9 resistance zone, the combination of improving technicals and strengthening on-chain metrics could pave the way for a larger recovery toward double-digit prices in the coming weeks.
 Short
Short
Expert Warns Pi Could Lose Top-100 Status Below $0.01Crypto expert Dr Altcoin has alleged that Pi Network is facing a supply crisis tied to a wave of token unlocks scheduled for the second half of 2026.
According to the post, pioneers who locked their Pi for three years are now seeing large amounts of that supply released. Roughly 775.8 million Pi tokens are set to unlock between now and December 2026. That works out to an average of 129.3 million Pi tokens unlocked each month now. Dr Altcoin argued that a significant portion of this unlocked supply is likely to reach exchanges, adding further selling pressure to the market.
Calls for the Pi Core Team to respond
The post argued that no single announcement, ecosystem update, or exchange listing would be enough to stabilize price without the Pi Core Team directly addressing supply, demand, and liquidity concerns. It called for the team to publicly acknowledge the situation and discuss potential solutions with the community, framing continued silence as a failure of leadership.
Proposed steps, according to the post
Dr Altcoin outlined several measures that could be considered if the Core Team continues its current communication approach:
Burning a substantial portion of remaining supply, potentially as much as 50%, drawing a comparison to Stellar’s historical token burn.
Allowing major exchanges, including Binance and Coinbase, to list Pi.
Introducing a transparent and verifiable buyback-and-burn mechanism.
Price risk raised in the post
The post also warned that if Pi falls below $0.01, it could lose its position among the top 100 cryptocurrencies by market cap, and that a sustained price decline could pressure the project financially, potentially forcing spending cuts or restructuring.
Community reaction
Replies to the post were mixed. Some users voiced support for the criticism, while others questioned Dr Altcoin’s own past promotional activity around Pi. Several replies echoed concerns about token distribution, with some users arguing that a small number of wallets, including the Core Team’s own holdings, control a disproportionate share of total supply.
The Pi Core Team has not publicly responded to these specific allegations as of now. These claims reflect one crypto expert’s analysis and have not been independently verified.
 Long
Long
Brent Crude Oil, 200, 400? when? 16/July/26UKOIL / Brent oil will hit 200 or 400? due to the war on Middle East? Iran and US war "can't settle" it short term?


Elliott wave analysis of DJI.This count envisions an ending-diagonal wave ((5)) off October 2022 low, and if correct would imply relatively quick move down towards end of wave ((4)) at 28660.94.
Inability to tag median line of pitchfork would imply the same move down to the end of wave ((4)).
 Short
Short
FVRR to go up this monthI expect FIVRR to go up this month (despite the market which I expect to fall). This is based on pitchfork analysis and my own indicators (which Tradingview doesn't let me post here since they are not pusblished).
 Long
Long
UNG to go up this monthI expect UNG to go up this month (despite the market). This is based on pitchfork analysis and my own indicators (which Tradingview doesn't let me post here since they are not pusblished).
 Long
Long
QQQ to fall this monthI expect QQQ to fall this month (along with the market). This is based on pitchfork analysis and my own indicators (which Tradingview doesn't let me post here since they are not published).
 Short
Short
TZA to go up over the next 1-3 daysTZA reached lowest pitchfork bounds. I expect it to go up over the next 1-3 days. Now 3.79.
 Long
Long
ROKU to fall this monthI expect ROKU to fall this month (along with the market). This is based on pitchfork analysis and my own indicators (which Tradingview doesn't let me post here since they are not published).
 Short
Short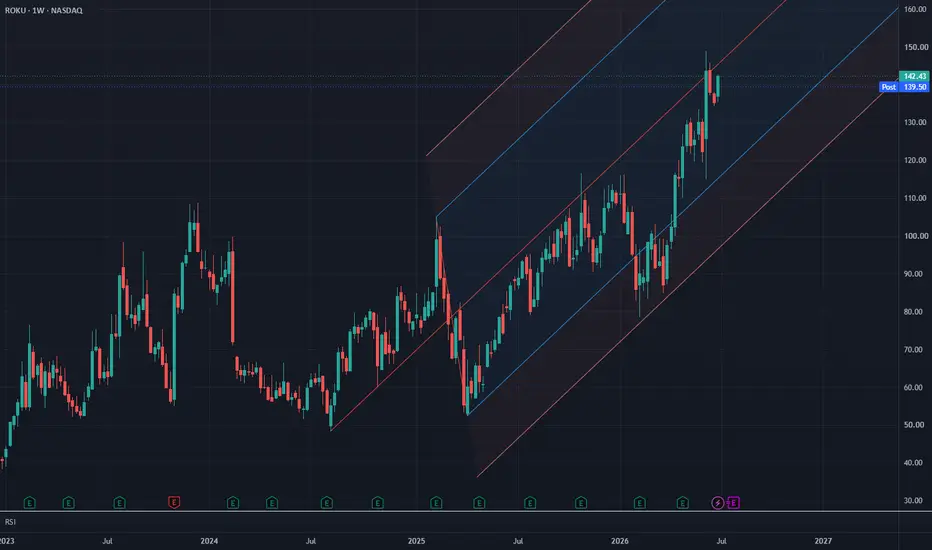
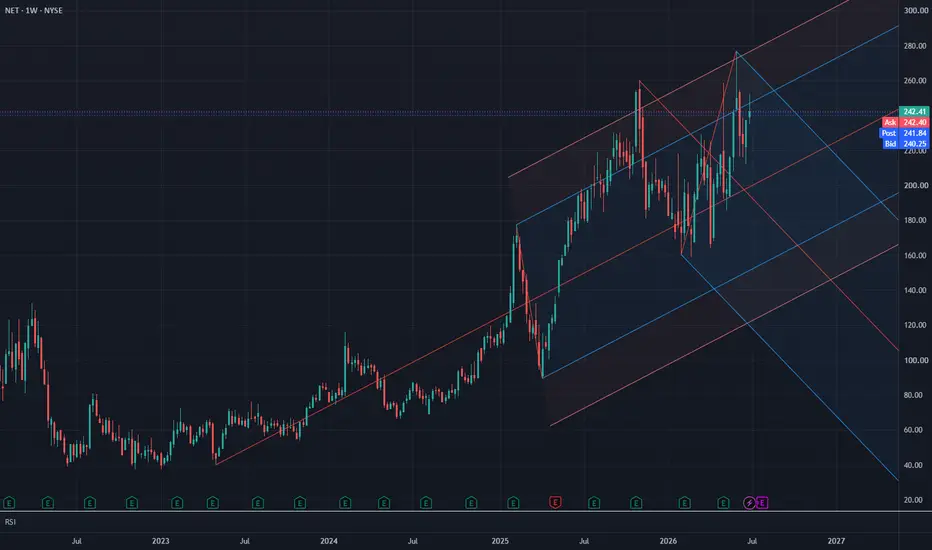
NET to fall this monthI expect NET to fall this month (along with the market). This is based on pitchfork analysis and my own indicators (which Tradingview doesn't let me post here since they are not pusblished).
 Short
Short