EURUSD: Support & Resistance Analysis for Next Week 🇪🇺🇺🇸
Here is my latest structure analysis and important supports
and resistances for EURUSD for next week.
Consider these structures for pullback/breakout trading.
❤️Please, support my work with like, thank you!❤️
I am part of Trade Nation's Influencer program and receive a monthly fee for using their TradingView charts in my analysis.
Pivot Points
GOLD (XAUUSD): Support & Resistance Analysis for Next Week
Here is my latest structure analysis for Gold.
Resistance 1: 4113 - 4148 area
Resistance 2: 4190 - 4220 area
Resistance 3: 4329 - 4436 area
Support 1: 3958 - 4000 area
Support 2: 3886 - 3932 area
Support 3: 3771 - 3817 area
The price will likely rise more and reach Resistance 1.
Consider these structures for pullback/breakout trading.
❤️Please, support my work with like, thank you!❤️
I am part of Trade Nation's Influencer program and receive a monthly fee for using their TradingView charts in my analysis.
Gold Forecast: Bullish Market Structure Could Drive Price to 445Gold is showing early signs of a bullish recovery after sweeping liquidity below the Equal Relative Lows (ERL). The recent reaction suggests that sell-side liquidity may have been cleared, allowing buyers to regain momentum.
If price continues forming a bullish market structure, the current recovery could extend toward the higher-timeframe Point of Interest (POI). The liquidity resting above recent swing highs remains an attractive objective, increasing the probability of further upside.
A sustained move above short-term resistance would strengthen the bullish outlook and could lead to a continuation toward the 4450 POI, where price may encounter its next major decision point.
Key Concepts Used:
* Smart Money Concepts (SMC)
* Market Structure
* Liquidity
* Liquidity Sweep
Potential Scenario:
* Support Zone: ERL Liquidity Area
* Bullish Confirmation: Liquidity sweep followed by bullish market structure confirmation.
* Target: 4450 POI
Not Financial Advice.
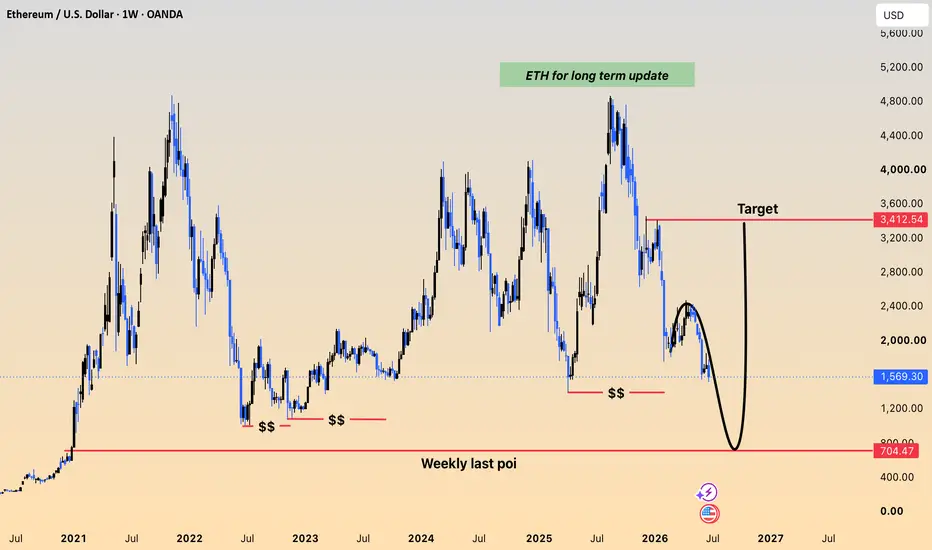
ETHUSD: Weekly Demand Reaction Could Ignite a Rally Toward $3,40Ethereum is approaching a significant Weekly Demand Zone, an area where institutional buying has previously entered the market. After a prolonged bearish decline, price is nearing a high-probability Point of Interest (POI) that could serve as the foundation for the next major bullish move.
The current sell-off appears to be targeting liquidity resting below recent lows. If Ethereum sweeps this liquidity and buyers successfully reclaim bullish market structure, a strong reversal could develop from the Weekly Demand Zone.
As long as this higher-timeframe support holds, the probability of a sustained recovery increases. A confirmed bullish reaction from this area could trigger a long-term rally, with $3,400 acting as the first major upside objective.
Key Concepts Used:
* Smart Money Concepts (SMC)
* Market Structure
* Liquidity
* Liquidity Sweep
Potential Scenario:
* Support Zone: Weekly Demand / Weekly POI
* Bullish Confirmation: Liquidity sweep followed by bullish market structure confirmation.
* Target: $3,400
Not Financial Advice.
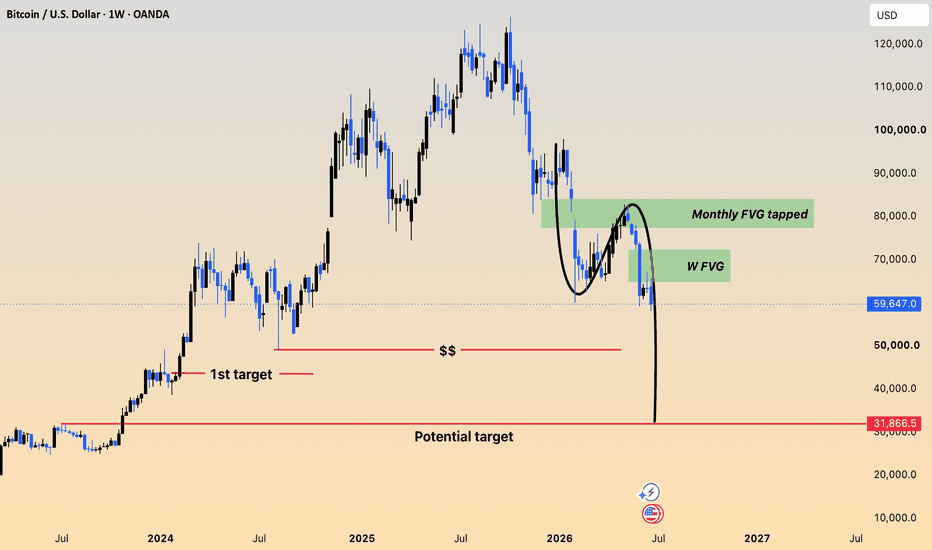
(BTCUSD) | Weekly FVG Rejection Could Trigger the Next Sell-OffBitcoin is showing signs of weakness after reacting from the Weekly Fair Value Gap (FVG), a key area where sellers have stepped back into the market. Despite the recent recovery, price failed to establish a bullish market structure, suggesting that the move was likely a liquidity sweep rather than a genuine trend reversal.
As long as Bitcoin remains below the highlighted Weekly FVG, the overall outlook remains bearish. A confirmed rejection from this zone could trigger the next impulsive leg lower, with price targeting major liquidity resting below current levels.
If bearish momentum continues, the first downside objective is around $47K, while the larger higher-timeframe target remains near $31K.
Key Concepts Used:
* Smart Money Concepts (SMC)
* Market Structure
* Liquidity
* Liquidity Sweep
Potential Scenario:
* Resistance Zone: Weekly FVG
* Bearish Confirmation: Rejection from the Weekly FVG followed by bearish market structure confirmation.
* Targets: $47K → $31K
Not Financial Advice.
GOLD seems to have reached the end of its bullish trend! (1D)Before anything else, please make sure you have checked my signature; otherwise, you will miss important analyses and updates.
We are active exclusively in the crypto market and do not normally operate in other markets. However, as an exception, we have analyzed GOLD at the request of our users.
On the chart, we can observe a bearish CH pattern, which clearly indicates the presence of sellers in the market. In addition, there is a 3D pattern visible on the chart, which is more relevant for higher timeframes. This suggests that sellers may soon initiate position liquidations and take profits, potentially causing downward pressure on the price.
When looking at pivots and liquidity zones, there is no significant support until the $3,600–$3,400 range, which could leave the market vulnerable to further declines in the short term.
For risk management, the invalidation level can be set above the most recent high, where sharp bearish moves were previously observed. A daily candle closing above this level would invalidate this analysis and signal a potential change in market dynamics.
Overall, traders should be cautious and monitor these levels closely, as the combination of bearish patterns and lack of strong support points to a possible continuation of selling pressure in the near future.
What’s your take on this setup do you see the same bearish structure or a different scenario?
Drop your analysis in the comments and let’s compare perspectives.
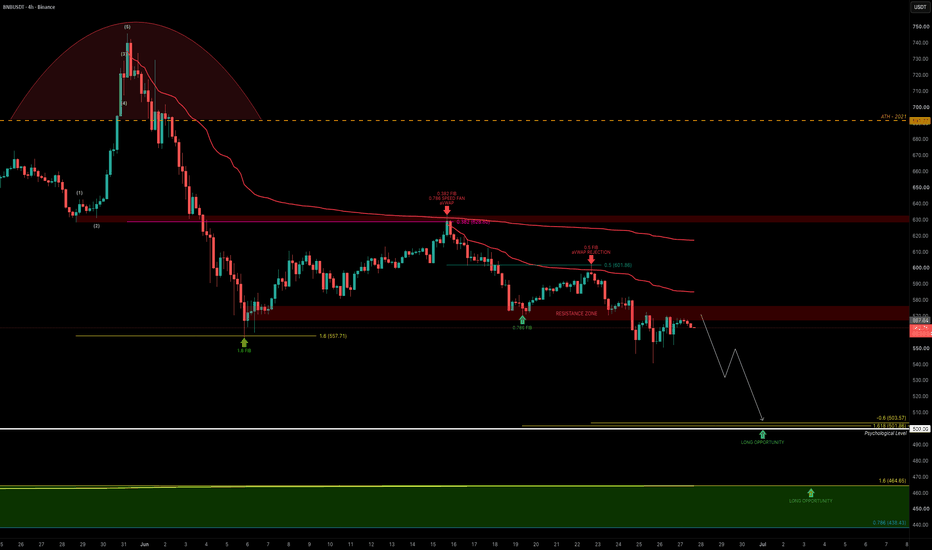
BNB — Is a 20-30% Drop Still Ahead?Breakdown Below Support, Lower Targets in Focus
BNB is slowly breaking below key support. The $570 area previously acted as support and is now acting as resistance.
For the next move, I'd like to see another leg lower toward the $500 psychological level, which aligns well with the Fibonacci confluence such as the -0.6 fib and 1.618 fib, giving us an overall target of $503.57 and $500.
My primary downside target sits between $463.65–$438.43, suggesting there could still be another 20–25% move to the downside before a high-probability long setup develops.
Several key confluences line up in this region:
Anchored VWAP aligning with the 1.618 Fibonacci extension around $464.65
0.786 Fibonacci retracement at $438.43
Liquidity Zone
Educational insight — Anchored VWAP:
Anchored VWAP is powerful because it represents the average price of all participants from a specific starting point, rather than just the current session. This makes it especially useful for identifying where larger market participants are likely positioned. When price repeatedly reacts to an anchored VWAP, especially when it aligns with Fibonacci levels it often signals interest zones where liquidity is being defended or distributed.
One reason I continue to rely heavily on the Anchored VWAP is its ability to identify support and resistance. In this case, it's lining up almost perfectly with the Fibonacci extension, a confluence that has already produced two clean rejections.
Overall, BNB has respected Fibonacci levels remarkably well throughout this cycle. I'll remain patient and wait for price to reach these higher-confluence zones before looking for the next long opportunity.
_________________________________
💬 If you found this helpful, drop a like and comment! a
NZDUSD: Waiting For Another Breakout 🇳🇿🇺🇸
To accurately sell NZDUSD next week, I recommend waiting
for a bearish breakout and a daily candle close below 0.5636 key support.
That will be a strong signal to sell.
I will expect a bearish continuation to 0.569 then.
❤️Please, support my work with like, thank you!❤️
I am part of Trade Nation's Influencer program and receive a monthly fee for using their TradingView charts in my analysis.
IREN | June, 2026 | Continued stock growth- Timeframe: Weekly
- Trade type: Buy stop order
- Price: 63.17
- Take Profit: Open
- Stop Loss: 57.71 (-8.60 %)
Idea: Long on a breakout above last week's high - bullish momentum continuation.
Entry: Buy stop above last week’s high.
Stop-loss: Below the low of the same candle.
If the weekly candle closes below this level, the trade is invalidated.
Take Profit: Trailing stop following the lows of new weekly candles.
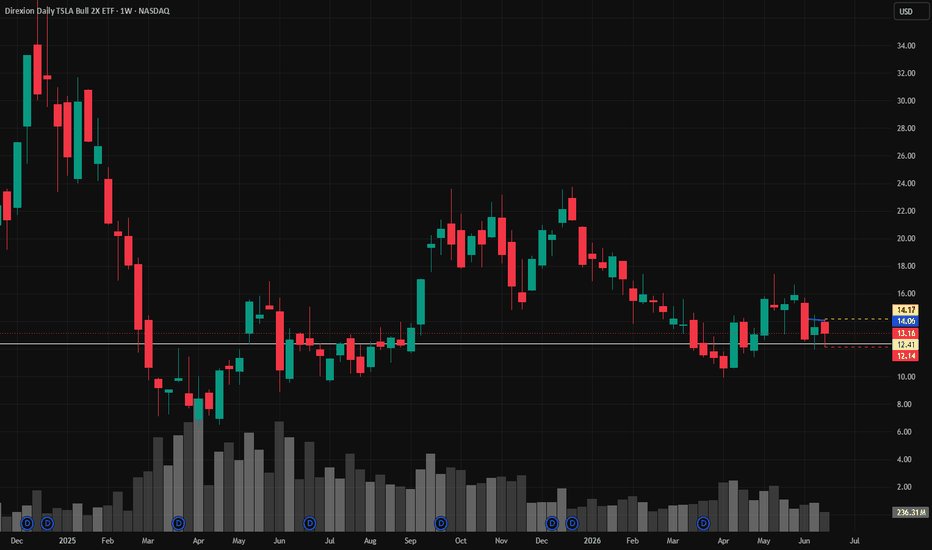
TSLL | June, 2026 | The time to go long has come- Timeframe: Weekly
- Trade type: Buy stop order
- Price: 14.17
- Take Profit: Open
- Stop Loss: 12.14 (-14.30 %)
Idea: Long on a breakout above last week's high - bullish momentum continuation.
Entry: Buy stop above last week’s high.
Stop-loss: Below the low of the same candle.
If the weekly candle closes below this level, the trade is invalidated.
Take Profit: Trailing stop following the lows of new weekly candles.
SWKS | June, 2026 | Continued stock growth- Timeframe: Weekly
- Trade type: Buy stop order
- Price: 78.89
- Take Profit: Open
- Stop Loss: 69.37 (-12.10 %)
Idea: Long on a breakout above last week's high — bullish momentum continuation.
Entry: Buy stop above last week’s high.
Stop-loss: Below the low of the same candle.
If the weekly candle closes below this level, the trade is invalidated.
Take Profit: Trailing stop following the lows of new weekly candles.
Feel free to like and share your thoughts in the comments! ❤️
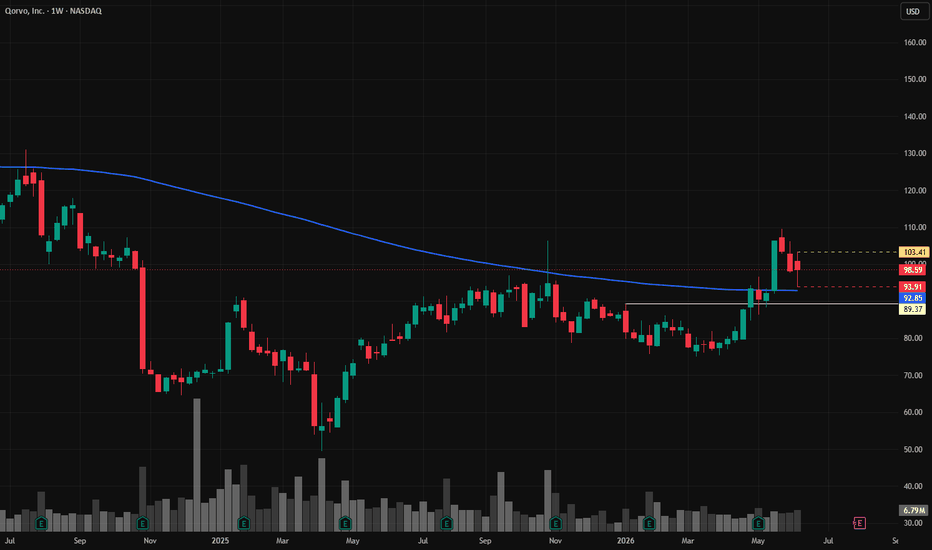
QRVO | June, 2026 | Continued stock growth- Timeframe: Weekly
- Trade type: Buy stop order
- Price: 103.41
- Take Profit: Open
- Stop Loss: 93.91 (-9.20 %)
Idea: Long on a breakout above last week's high — bullish momentum continuation.
Entry: Buy stop above last week’s high.
Stop-loss: Below the low of the same candle.
If the weekly candle closes below this level, the trade is invalidated.
Take Profit: Trailing stop following the lows of new weekly candles.
Feel free to like and share your thoughts in the comments! ❤️
TSM | June, 2026 | Continued stock growth- Timeframe: Weekly
- Trade type: Buy stop order
- Price: 438.16
- Take Profit: Open
- Stop Loss: 405.51 (-7.50 %)
Idea: Long on a breakout above last week's high — bullish momentum continuation.
Entry: Buy stop above last week’s high.
Stop-loss: Below the low of the same candle.
If the weekly candle closes below this level, the trade is invalidated.
Take Profit: Trailing stop following the lows of new weekly candles.
Feel free to like and share your thoughts in the comments! ❤️
EME | June, 2026 | Continued stock growth- Timeframe: Weekly
- Trade type: Buy stop order
- Price: 845.99
- Take Profit: Open
- Stop Loss: 775.88 (-8.30 %)
Idea: Long on a breakout above last week's high — bullish momentum continuation.
Entry: Buy stop above last week’s high.
Stop-loss: Below the low of the same candle.
If the weekly candle closes below this level, the trade is invalidated.
Take Profit: Trailing stop following the lows of new weekly candles.
Feel free to like and share your thoughts in the comments! ❤️
NSC | June, 2026 | Continued stock growth- Timeframe: Weekly
- Trade type: Buy stop order
- Price: 315.96
- Take Profit: Open
- Stop Loss: 307.50 (-2.70 %)
Idea: Long on a breakout above last week's high — bullish momentum continuation.
Entry: Buy stop above last week’s high.
Stop-loss: Below the low of the same candle.
If the weekly candle closes below this level, the trade is invalidated.
Take Profit: Trailing stop following the lows of new weekly candles.
Feel free to like and share your thoughts in the comments! ❤️
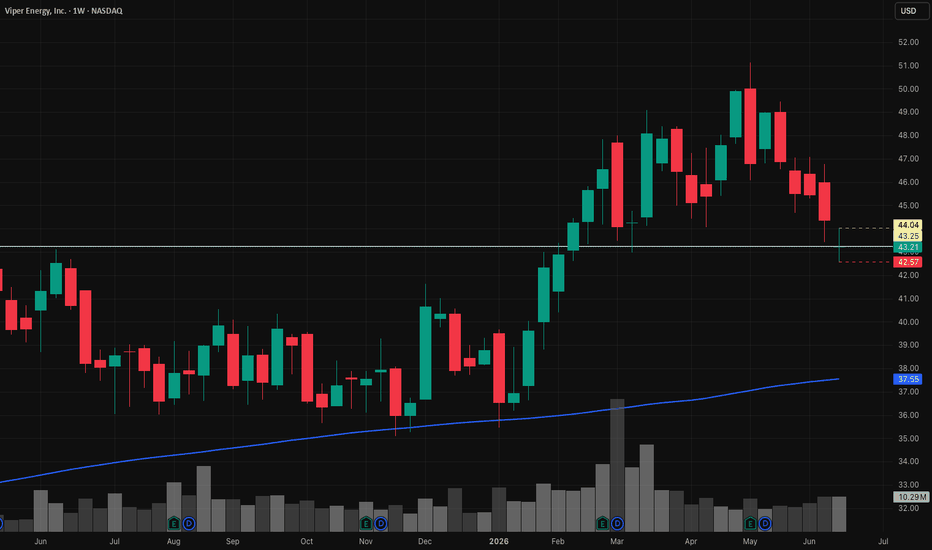
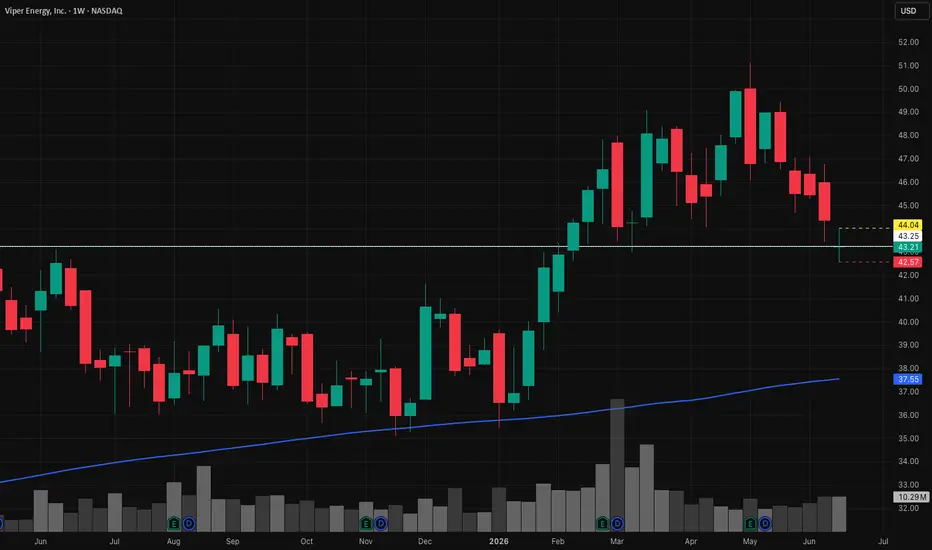
VNOM | June, 2026 | Continued stock growth- Timeframe: Weekly
- Trade type: Buy stop order
- Price: 44.04
- Take Profit: Open
- Stop Loss: 42.57 (-3.30 %)
Idea: Long on a breakout above last week's high - bullish momentum continuation.
Entry: Buy stop above last week’s high.
Stop-loss: Below the low of the same candle.
If the weekly candle closes below this level, the trade is invalidated.
Take Profit: Trailing stop following the lows of new weekly candles.
USNAS100 | Bears Defend 29,400 as Consolidation ContinuesUSNAS100 | Nasdaq Trapped in Consolidation as Bears Remain in Control
🟠The Nasdaq remains under pressure as investors continue to monitor AI-sector performance, Federal Reserve policy expectations, and geopolitical developments.
🟠Although the index has stabilized after the recent sell-off, buyers have yet to reclaim the key resistance zone, leaving the broader structure tilted to the downside.
📈 Technically:
• The market remains below an important resistance level.
• Holding below resistance keeps downside pressure active.
• A breakout from the current range could determine the next major trend.
Pivot: 29,400
Support: 28,800 – 28,150
Resistance: 29,720 – 30,200
$USELESS Defending 0.070MEXC:USELESSUSDT continues to respect the broader range structure after multiple successful defenses of the .050 demand zone. Each revisit into support has been met with buying, resulting in a series of higher lows while price continues to compress beneath resistance.
So far, sellers have struggled to force acceptance back below the range, keeping the short-term structure constructive.
If USELESS can continue to hold the .070s here as support, I think price has room to rotate back into .09-.102s supply zone.
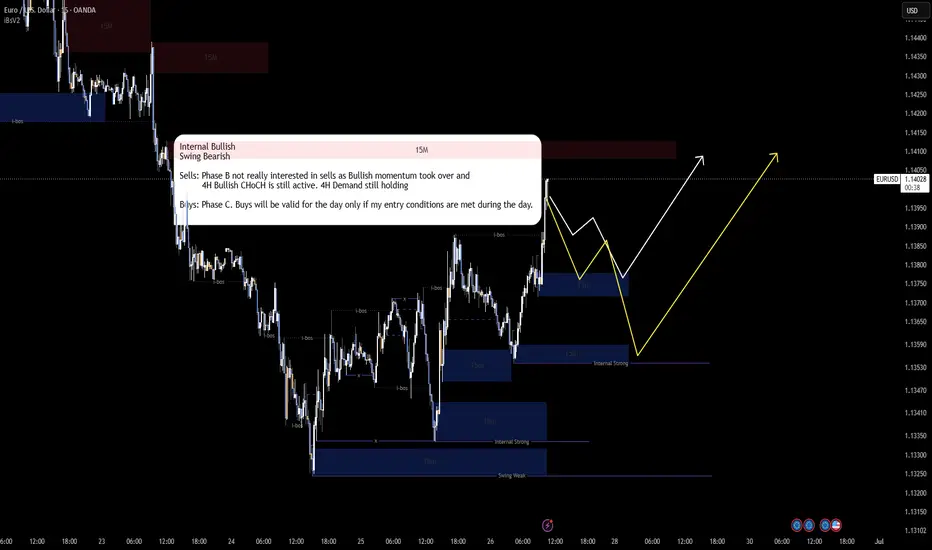
EURUSD | 15M Execution | 26 June 2026Market Bias
Bullish (Intraday)
Higher-timeframe order flow remains constructive despite the recent impulse into resistance.
4H Bullish ChoCH remains valid.
4H demand continues to hold.
Selling pressure has weakened as bullish momentum reclaimed internal structure.
Current expectation is continuation higher after liquidity is collected.
Market Structure
Current 15M structure is printing:
Internal Bullish
Swing Bearish
This creates a mixed lower timeframe environment, meaning patience is required. We are not interested in chasing price into premium.
The preferred approach is allowing price to retrace into institutional demand before looking for confirmation.
Primary Trading Scenario (High Probability)
Buy the Discount
Allow price to retrace into the highlighted 15M demand.
Confirmation required:
✓ Liquidity sweep below short-term lows
✓ Bullish Market Structure Shift (ChoCH)
✓ Strong displacement from demand
✓ Fair Value Gap or Order Block confirmation
Only after confirmation should long exposure be considered.
Targets
TP1
Previous intraday highs
TP2
15M supply
Extended Target
Continuation toward higher-timeframe premium should momentum remain intact.
Alternative Scenario
If buyers fail to defend the first demand zone:
Expect continuation into the lower 15M demand.
This area aligns with stronger internal support and offers the higher-quality institutional entry.
A deeper pullback does not invalidate the overall bullish narrative while 4H demand remains respected.
Invalidation
The bullish thesis becomes invalid if:
15M demand fails with strong bearish displacement.
4H demand is decisively broken.
Market begins printing lower highs and lower lows across both internal and swing structure.
Until then, pullbacks remain buying opportunities rather than reasons to sell.
RegimeWorks Execution Plan
Bias: Bullish
Execution Timeframe: 15M
Confirmation Required: Yes
Entry Style: Confirmation-based only
Risk: Maximum 1% per position
Reward Objective: Minimum 1:3 R:R
Trade Management
Do not chase impulsive candles.
Allow price to trade into demand.
Wait for structure confirmation before execution.
Protect capital if confirmation fails.
RegimeWorks Summary
Narrative: Higher-timeframe buyers remain in control. The current rally is approaching premium pricing, making fresh longs unattractive at current levels. The preferred strategy is to allow price to retrace into 15M demand, confirm renewed buying interest, and execute in alignment with the prevailing 4H bullish order flow. Patience remains the edge. The best trade is not the first move—it is the confirmed continuation from institutional demand.
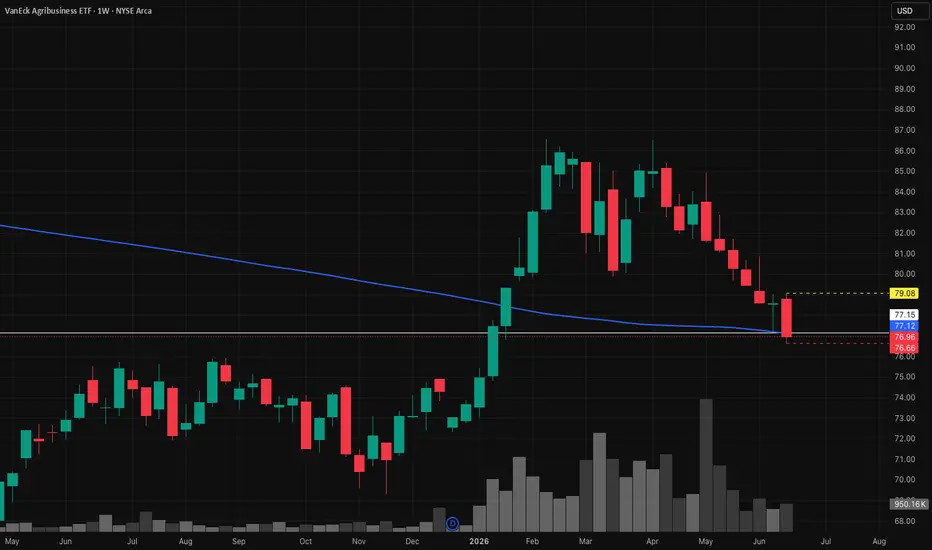
MOO | June, 2026 | The time to go long has come- Timeframe: Weekly
- Trade type: Buy stop order
- Price: 79.08
- Take Profit: Open
- Stop Loss: 76.66 (-3.10 %)
Idea: Long on a breakout above last week's high - bullish momentum continuation.
Entry: Buy stop above last week’s high.
Stop-loss: Below the low of the same candle.
If the weekly candle closes below this level, the trade is invalidated.
Take Profit: Trailing stop following the lows of new weekly candles.
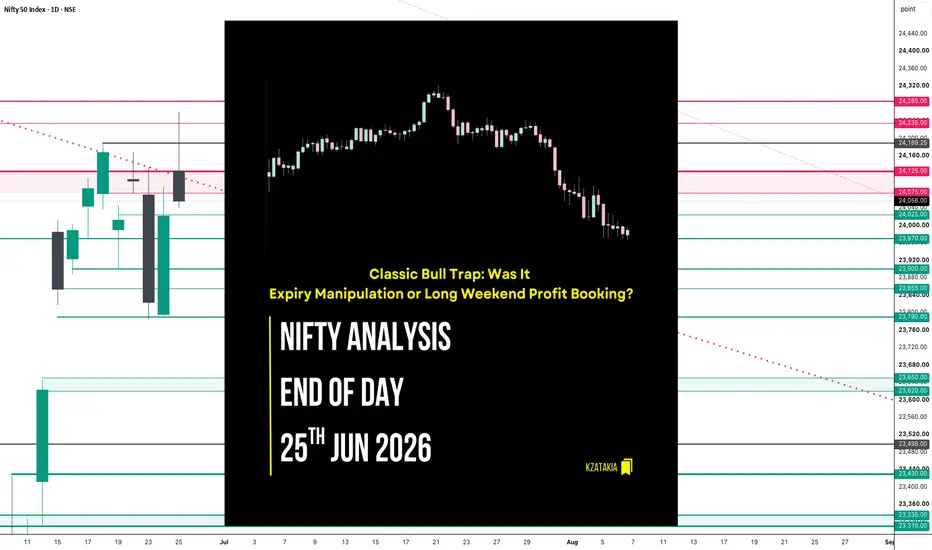
Nifty Analysis EOD – June 25, 2026 – Wednesday🟢 Nifty Analysis EOD – June 25, 2026 – Wednesday 🔴
Classic Bull Trap: Was It Expiry Manipulation or Long Weekend Profit Booking?
🗞 Nifty Summary
Nifty opened with a 123-point gap up, above the PDH and exactly at the high of June 23rd (Tuesday). After the opening tick, the index found a base at 24,107.80 — about 23 points below the open. From there, it climbed to the PWH zone of 24,185 ~ 24,190, where it formed the IBH and spent around 50 minutes consolidating before breaking above both IBH and PWH to test the IBH_1x level.
At this point, Nifty had already entered the higher time frame Fib 0.784 ~ 0.786 zone — and the rejection from that zone was swift. Price got dragged back down into a support cluster made up of PWH + IBH + VWAP + Intraday Fib 0.618. That zone held things together for nearly an hour and a half, price staying within a tight 35-point box. But at 14:10, the box broke — and Nifty fell sharply, dropping 142 points, breaching CDO, IBL, PDH, and nearly testing the IBL_1x level. The day closed almost at the low.
Textbook bull trap day. IBH breaks → IBH_1x tested → IBL breaks → IBL_1x tested. On one side, today’s close is above the previous day’s close, today’s high and low formed an HH-HL structure — all of that looks constructive. But on the other side, price couldn’t close above the June 18th and June 22nd closing levels, slipped below the 24,075 ~ 24,125 zone, fell under the HTF trendline, and left behind an inverted hammer candle. Two very different pictures depending on where you’re looking.
As for what disturbed the day’s sentiment — likely two things. The Sensex expiry manipulation (we saw something similar on Tuesday’s Nifty expiry session), and pre-long-weekend position lightening, with traders wanting to stay light ahead of the uncertainty. Now, Monday’s opening tick will tell us which side of the picture the market wants to show. Until then, enjoy the long weekend.
The day printed an inverted hammer on the daily — a candle worth watching. Monday’s opening bias will matter more than usual given the holiday gap.
🛡 5 Min Intraday Chart with Levels
📉 Daily Time Frame Chart with Intraday Levels
🕯 Daily Candle Breakdown
Open: 24,125.85
High: 24,261.60
Low: 24,039.00
Close: 24,056.00
Change: +34.35 (+0.14%)
🏗️ Structure Breakdown
Type: Inverted Hammer — gap up open, upper wick rejection, close near the low
Range: ≈ 222 points — moderate volatility
Body: ≈ 70 points — minor net gain masking a full intraday reversal
Upper Wick: ≈ 136 points — meaningful supply and rejection from the upper zone
Lower Wick: ≈ 17 points — very little demand stepped in near the close
🛡 5 Min Intraday Chart
⚔️ Gladiator Strategy Update
ATR: 263.45
IB Range: 77.55 → Small
Market Structure: ImBalanced
Trade Highlights:
10:15 Long Trade: Target Hit (R:R 1:2.21)
13:39 Long Trade: SL Hit
13:57 Short Trade: Target Hit (R:R 1:1.43)
Trade Summary: The long at 10:15 worked well — system did its job there. The 13:39 long hit SL, which stings a little in hindsight given what followed on the short side. The 13:57 short caught part of the breakdown and hit target. The bigger regret is leaving points on the table — the bull trap setup triggered, but I didn’t take it given the expiry day, not wanting to give back what I’d already earned. A reasonable call in the moment, though it’s the kind of trade that stays in your head after the close.
🧱 Support & Resistance Levels
Resistance Zones: 24,125 | 24,190 | 24,235 ~ 24,285
Support Zones: 24,025 | 23,970 | 23,900 | 23,855
🧠 Final Thoughts
“Sometimes the setup you skip teaches you more than the one you take.”
The thing that stays with me from today is how cleanly the bull trap played out — the IBH break, the HTF fib rejection, the slow grind in that support box, and then the sharp drop. Price followed the structure almost to the page. The setup was visible; the decision to sit it out was mine, and it was made for a reason.
For Monday, the opening tick near 24,075 ~ 24,125 will matter a lot. If price opens and holds above that zone, the HH-HL structure could still be in play. If it gaps down or opens weak and fails to reclaim it, the inverted hammer and the HTF trendline breakdown might start to carry more weight.
Going into the long weekend, the plan is simple — no assumptions, no bias. Just wait for Monday’s opening tick and let the price show where it wants to go.
✏️ Disclaimer
This is my personal digital diary and represents my own analysis and point of view. It is not financial advice; please consult a professional advisor before making any trading decisions.
Gold (XAUUSD) - Weekly Outlook: Monday 22.06.26 | 8:00 AM AESTAs always, this is not a prediction. It's a roadmap of potential scenarios based on the current market structure and the levels to watch.
Gold remains bearish on the higher timeframe after rejecting resistance and creating a lower high as seen in the previous idea. Price is currently sitting near a key demand area, which means both directions remain possible.
Bullish Scenario: If buyers defend the current zone, I will be looking for price to reclaim the nearby imbalance and target the higher supply area above.
For any long position, I would want to see a clear MSS and retest on the lower timeframes during time based liquidity windows before considering any position.
Bearish Scenario: Failure to hold the current demand zone could open the door for a move toward the strong low below in the $4020 area.
A breakdown alone is not enough. I would still wait for confirmation and structure before looking for entries.
The zone are important but the price reaction is more important.
Many traders focus on where price is. Professional traders focus on how price behaves once it gets there.
Have a blessed week and stay safe.
Disclaimer: Educational Purpose Only
All content shared on this page — including market outlooks, technical analysis, psychology content, and mentorship sessions — is provided for general educational and informational purposes only. Nothing here constitutes financial product advice, a recommendation to buy or sell any financial product, or personalised advice tailored to your individual circumstances.