Shark
POWER - PSX - Technical Analysis - Monthly & DailyPOWER on Monthly Time Frame, has completed the SHARK Harmonic Pattern Zone-1 and has tested it twice and then price came down. It may even try to test Zone 2 or Zone 3 by taking support from Weekly Trend Line (Blue). Even presently price is in support zone (green) and may go up again from this zone.
A regression channel has also been drawn which price is following.
In my personal opinion, price will try to test SHARK Potential Reversal zone 3 before eventually coming down.
I recommend enterin
ETH Elliott wave analysis 13/10 /2025In my view, ETH has not yet completed its upside cycle, and the recent decline is simply part of wave (c) within wave (IV).
I believe we are currently in wave (5), specifically within wave 3 of that structure. The reason is that if waves 1 and 3 were corrective ABC structures, then wave C should not exceed 138.2% of wave A, otherwise it would invalidate the b-failure flat pattern—and this limit has already been exceeded, confirming the impulsive nature of the current move.
The Shark harmonic p
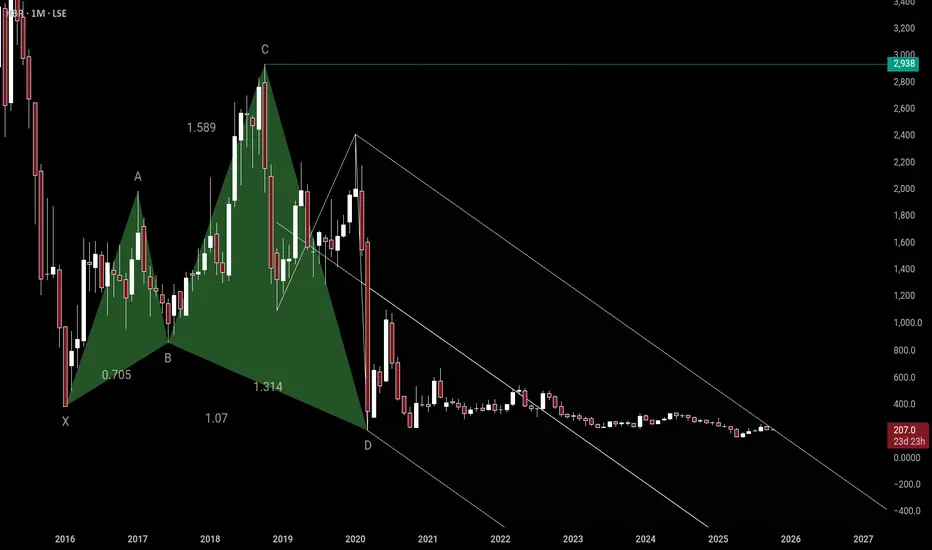
HBR massive shark pattern.This one shows a shark harmonic with schiff pitchfork. The fact this has been in consolidation/PRZ since 2020 means 1 of 2 things.
1. Bearish, the pattern has failed.
2. Bullish, this going to explode so fast and hard.
The fact Brent oil is threatening to clear its main resistance leads me to the latter.
$BTC Bearish Divergence on 1H Chart Near Key Support#BTC BearishBTC/USDT on the 1-hour timeframe is flashing a bearish structure with clear divergence. The immediate correction zone looks to be around $111K, with the $110.8K support acting as the deciding level. If that floor gives way, we could see a sharp drop toward $98K. But if buyers defend the level, it may reset as a new higher low, setting up continuation. With Fed data on deck today, expect liquidity grabs both ways—first stop likely downside before any rebound.
IWM Appears Due for a Minimum 40-60% Downside CorrectionOn the lower timeframes IWM has been treating $223 as short term support with much sold put leverage building at $220 and recently IWM has begun to retrace back down into those levels putting those sold puts at risk of expanding the volatility and of squeezing through these short puts as a result.
The short term the loss of this zone could likely squeeze down to $200.
However in the longer term we have been trading within this much larger parallel channel since the peak and bottom of 2008-20
EURNZD Bearish Shark Follow-UpFrom my previous post regarding potential Bearish Shark forming on the EURNZD (see Related Publications ->) a shooting star pattern might be forming right around the 1.97500 level. I usually don't trade candlestick patterns, but will look for a handful of certain ones around areas of fib confluence, S/R, S/D, and divergence. The Kiwi is weak relative to all other currencies, but I think the Euro is exhausted. Nevertheless, I would not be surprised if bulls make another exhausted push up towards
COSUSDT.P | 1H Short ThermOpening a short setup on COSUSDT.P (1H) based on the completion of a Shark harmonic pattern at point D.
🔎 Confluences:
– Shark pattern completion aligning with resistance
– TDG indicator flashing bearish momentum (Sell mode)
– Market structure respecting the pitchfork channel
📉 Setup:
– Entry: Point D rejection
– Targets: TP1 → TP2 → TP3 (scaling out)
– Stop: Above X to limit risk
⚠️ This is not financial advice, just sharing my analysis for discussion.
Question: Do you guys find Shark patter
CShort
Exide Ltd is currently trading near its 200-day moving averageExide Ltd – Technical Outlook
Exide Ltd is currently trading near its 200-day moving average, which is acting as a key resistance level. A decisive breakout above this level could trigger a positional upmove of approximately 15%, making it a strong candidate for a medium-term long trade.
Additionally, the stock has been consolidating within a narrow 5% range, indicating a phase of accumulation. A breakout from this sideways range could present a short-term swing trading opportunity.
Actionabl
Bitcoin Bearish Shark Detected – CME Gap Below $115K in Sight?Today's analysis is on the 15-minute timeframe , following the previous analysis I shared with you on the 1-hour timeframe .
Bitcoin ( BINANCE:BTCUSDT ) is currently trading in the Resistance zone($120,100-$118,240) near the Potential Reversal Zone(PRZ) and Cumulative Short Liquidation Leverage($121,490-$119,965) .
From a technical perspective , it looks like Bitcoin is completing the Bearish Shark Harmonic Pattern on the 15-minute timeframe .
From an Elliott wave theory per
Oil Futures Approaching Key Reversal Zone – Bullish HarmonicOil futures may be forming a bullish Shark harmonic pattern, with price approaching the potential reversal zone at point D. This pattern suggests a possible bounce if buyers step in around this area. If price action shows signs of support or a shift in momentum, it could offer a solid long opportunity. Look for confirmation like bullish candles or indicators turning up before entering. If the pattern plays out, it could provide a strong risk-to-reward setup.
ONDO Bullish Shark to T1 & Potential Bearish BatTicker: ONDO
Timeframe: Daily
Entry: 0.84887
Stop Loss: 0.76000
Take Profit: 1.386
R/R Ratio: 6.05
Pattern: Bullish Shark & Potential Bearish Bat
DOT: 1
HSI: 46
AmpRSI: 41
This bullish shark has held up during the last few months while we form a potential bearish bat with a C point at the terminal bar of the bullish shark. While HSI and AmpRSI are under the 50 it signals that we may spend more time down here. I added a stop under the terminal bar and structure low
1000APU Shark to T11h showing bullish shark pattern. Confirmed XA level with 2 bullish dots. HSI over 50. AmpRSI under 50 but making higher lows. Stop just under C point wicks. TP at T1
Ticker: 1000APU
Entry: 0.178
Stop Loss: 0.1723
Take Profit: 0.1975
R/R Ratio: 3.83
Pattern: Shark
DOT: 2
HSI: 57
AmpRSI: 42
1Long