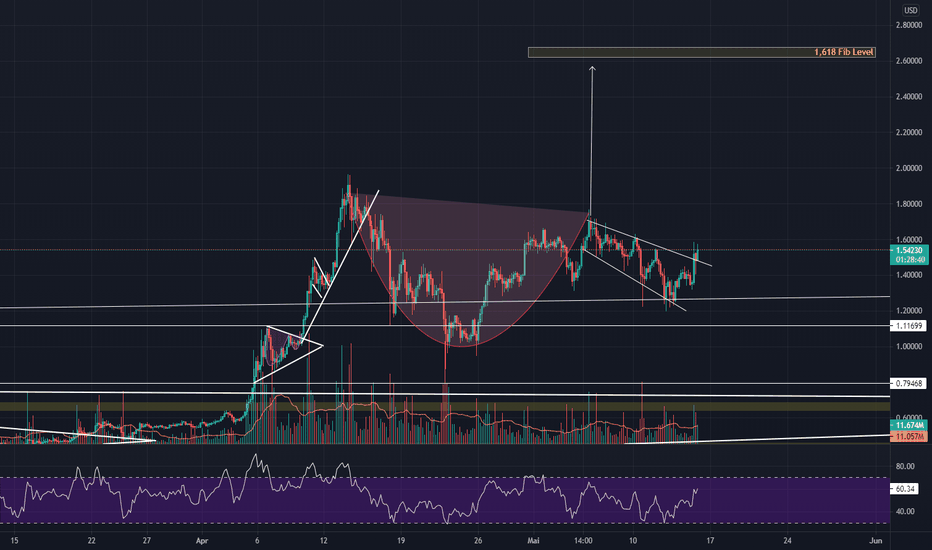
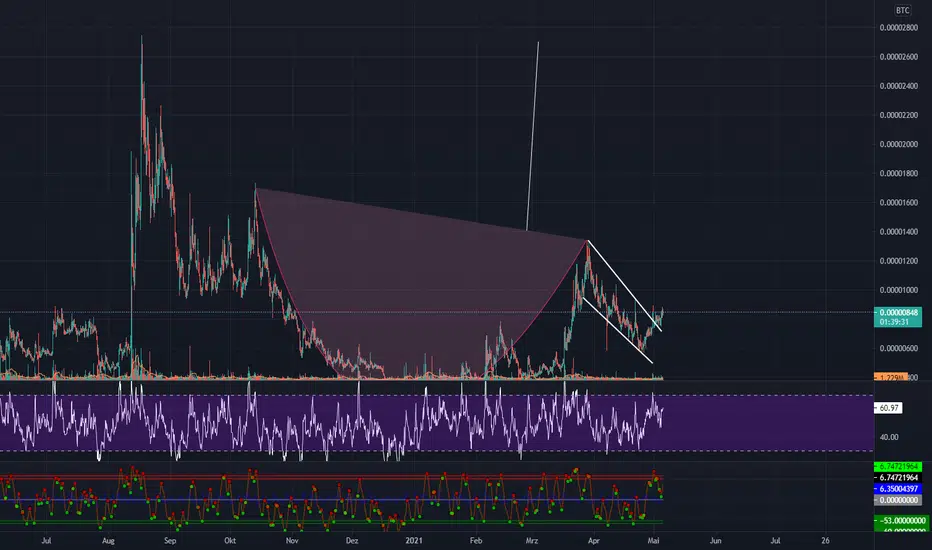
XMHQ - 28 months HEAD & SHOULDERS CONTINUATION══════════════════════════════
Since 2014, my markets approach is to spot
trading opportunities based solely on the
development of
CLASSICAL CHART PATTERNS
🤝Let’s learn and grow together 🤝
══════════════════════════════
Hello Traders ✌
After a careful consideration I came to the conclusion that:
- it is crucial to be quick in alerting you with all the opportunities I spot and often I don't post a good pattern because I don't have the opportunity to write down a proper didactical comment;
- since my parameters to identify a Classical Pattern and its scenario are very well defined, many of my comments were and would be redundant;
- the information that I think is important is very simple and can easily be understood just by looking at charts;
For these reasons and hoping to give you a better help, I decided to write comments only when something very specific or interesting shows up, otherwise all the information is shown on the chart.
Thank you all for your support
🔎🔎🔎 ALWAYS REMEMBER
"A pattern IS NOT a Pattern until the breakout is completed. Before that moment it is just a bunch of colorful candlesticks on a chart of your watchlist"
═════════════════════════════
⚠ DISCLAIMER ⚠
The content is The Art Of Charting's personal opinion and it is posted purely for educational purpose and therefore it must not be taken as a direct or indirect investing recommendations or advices. Any action taken upon these information is at your own risk.
Technical Analysis
WEEKLY MARKET OUTLOOK – COMPRESSION CONTINUES, BREAKOUT AWAITS NIFTY 50 – TWO WEEKS OF INDECISION
Nifty closed at 24,056, almost unchanged from the previous week's close.
Weekly High: 24,261 Weekly Low: 23,784
Once again, Nifty respected my projected range of 24,550–23,600, reinforcing that the market continues to remain in a well-defined consolidation zone.
More importantly, this is the second consecutive week that Nifty has delivered an indecisive weekly close. Such price action generally indicates that larger market participants are waiting for the next meaningful trigger before committing to a directional move.
The encouraging part is that while the monthly timeframe is still awaiting bullish confirmation, both the weekly and daily charts continue to strengthen, suggesting that underlying momentum is gradually improving.
NIFTY – KEY LEVELS TO WATCH
Bullish Trigger
👉 Decisive weekly close above 24,400
If achieved, confidence among bulls is likely to improve significantly, opening the path toward:
24,800
25,000
Bearish Trigger
👉 Hourly close below 23,993
A sustained break below this level may quickly attract selling pressure and push the index toward:
23,700
23,600
Expected Range
👉 24,500 – 23,600
A breakout from either side of this range is likely to produce a sharp expansion in volatility and momentum.
BANK NIFTY – STILL LEADING THE MARKET
Bank Nifty closed at 58,177, around 500 points higher than the previous week.
Just like Nifty, Bank Nifty also respected my projected range of 58,950–56,450 highlighting that both indices remain in controlled consolidation.
The positive takeaway is that Bank Nifty has once again managed to hold above 57,112 reinforcing this level as an important short-term support.
Bullish Trigger
👉 Strong weekly close above 58,700
If achieved, the next leg of the rally could gather momentum.
Expected Range
👉 59,250 – 57,100
As has been the case over the past few weeks, Bank Nifty is likely to remain the key driver of Nifty's next major move.
S&P 500 – SUPPORT STILL HOLDS
S&P 500 closed at 7,354, down around 150 points from the previous week's close.
Although the index briefly tested the important support near 7,334, it has now managed to close above this level for seven consecutive weeks, highlighting the strength of this support zone.
Bullish Trigger
👉 Strong weekly close above 7,500
If achieved, it would significantly improve the probability of resuming the broader uptrend.
Until then, expect the index to remain in a consolidation phase.
FINAL VIEW
* Nifty: Consolidating below major resistance
* Bank Nifty: Continues to show relative strength
* S&P500: Holding above critical support
* Higher Timeframes: Improving, but monthly confirmation still pending
Markets are entering a compression phase, and historically such periods are often followed by strong directional moves.
For now, avoid anticipating the breakout.
👉 Let the market confirm the move first.
Trade the levels, not the emotions.
CBK - 11 months RECTANGLE══════════════════════════════
Since 2014, my markets approach is to spot
trading opportunities based solely on the
development of
CLASSICAL CHART PATTERNS
🤝Let’s learn and grow together 🤝
══════════════════════════════
Hello Traders ✌
After a careful consideration I came to the conclusion that:
- it is crucial to be quick in alerting you with all the opportunities I spot and often I don't post a good pattern because I don't have the opportunity to write down a proper didactical comment;
- since my parameters to identify a Classical Pattern and its scenario are very well defined, many of my comments were and would be redundant;
- the information that I think is important is very simple and can easily be understood just by looking at charts;
For these reasons and hoping to give you a better help, I decided to write comments only when something very specific or interesting shows up, otherwise all the information is shown on the chart.
Thank you all for your support
🔎🔎🔎 ALWAYS REMEMBER
"A pattern IS NOT a Pattern until the breakout is completed. Before that moment it is just a bunch of colorful candlesticks on a chart of your watchlist"
═════════════════════════════
⚠ DISCLAIMER ⚠
The content is The Art Of Charting's personal opinion and it is posted purely for educational purpose and therefore it must not be taken as a direct or indirect investing recommendations or advices. Any action taken upon these information is at your own risk.
3186 - 5 months HEAD & SHOULDERS CONTINUATION══════════════════════════════
Since 2014, my markets approach is to spot
trading opportunities based solely on the
development of
CLASSICAL CHART PATTERNS
🤝Let’s learn and grow together 🤝
══════════════════════════════
Hello Traders ✌
After a careful consideration I came to the conclusion that:
- it is crucial to be quick in alerting you with all the opportunities I spot and often I don't post a good pattern because I don't have the opportunity to write down a proper didactical comment;
- since my parameters to identify a Classical Pattern and its scenario are very well defined, many of my comments were and would be redundant;
- the information that I think is important is very simple and can easily be understood just by looking at charts;
For these reasons and hoping to give you a better help, I decided to write comments only when something very specific or interesting shows up, otherwise all the information is shown on the chart.
Thank you all for your support
🔎🔎🔎 ALWAYS REMEMBER
"A pattern IS NOT a Pattern until the breakout is completed. Before that moment it is just a bunch of colorful candlesticks on a chart of your watchlist"
═════════════════════════════
⚠ DISCLAIMER ⚠
The content is The Art Of Charting's personal opinion and it is posted purely for educational purpose and therefore it must not be taken as a direct or indirect investing recommendations or advices. Any action taken upon these information is at your own risk.
Detailed Analysis for Major 4 : Nifty/USOIL/Silver/GoldThis one will be like a lengthy one, like a tutorial class :), with all aspects clearly explained, with all levels explained in detail.
This video will cover technical analysis for Nifty, Crude, Silver and Gold. It will be a clarity on the direction of the prices on Monday market.
The Hidden Reason Many Trading Strategies Fail in Live Markets
Most traders do not fail because they know nothing about the market.
Many traders study for years. They learn market structure, support and resistance, trendlines, moving averages, liquidity, order blocks, volume, candlestick behavior, market profile, order flow, session timing, macro news, and multiple-timeframe analysis.
They watch charts every day.
They save screenshots.
They study patterns.
They backtest setups.
They follow different methods.
They keep searching for the next better confirmation.
But still, many traders struggle.
The reason is often uncomfortable:
The problem is not always analysis.
The problem is execution.
A trader can read the market correctly and still lose money.
A trader can identify the right direction and still enter too late.
A trader can find a good setup and still place the stop-loss badly.
A trader can be in a winning trade and still exit too early because of fear.
A trader can have a profitable method and still destroy the result through overtrading, revenge trading, emotional sizing, and rule-breaking.
This is why execution must be treated as a separate trading skill.
Analysis tells the trader what the market may be doing.
Execution decides whether the trader is allowed to participate.
That difference is very important.
Many traders believe that once they understand direction, they should immediately take a trade. But direction alone is not enough.
A bullish market does not mean every buy is valid.
A bearish market does not mean every sell is safe.
A liquidity sweep does not automatically mean reversal.
A breakout does not always mean continuation.
A strong candle does not always mean opportunity.
A pullback does not always mean value.
A rejection wick does not always mean reversal.
The chart may show opportunity, but execution decides whether the location, timing, risk, and condition are acceptable.
The Real Pain of Retail Traders
Most traders know the feeling.
You wait for a setup.
You see price moving.
You hesitate.
Then the candle becomes strong.
You feel the move is leaving without you.
You enter quickly.
Immediately after entry, price slows down or reverses.
Then the mind starts working against you.
“Maybe I entered too early.”
“Maybe I should hold.”
“Maybe it will come back.”
“Maybe I should add one more position.”
“Maybe this stop-loss is too close.”
“Maybe I should move the stop.”
“Maybe I can recover in the next trade.”
This is where many accounts are damaged.
Not because the trader had no knowledge.
But because live execution pressure changed the trader’s behavior.
A chart looks simple after the move is completed. But during the live candle, the trader is dealing with uncertainty, speed, emotion, fear, greed, and pressure.
This is why execution is harder than analysis.
Analysis is done with the chart.
Execution is done with the mind.
A Good Setup Can Still Be a Bad Trade
One of the most important lessons in trading is this:
A good-looking setup is not always a good trade.
A setup may look perfect on the chart, but the execution quality may be poor.
Price may already be overextended.
The entry may be late.
The stop-loss may be too wide.
The target space may be too small.
The next support or resistance may be too close.
The market may be in a low-quality range.
Volatility may be unstable.
The trader may be entering because of fear of missing out, not because of a complete plan.
In such cases, the trader is not entering opportunity.
The trader is entering risk.
This is one of the biggest differences between amateur execution and professional execution.
The amateur trader asks:
“Is there a setup?”
The professional trader asks:
“Is this setup still worth risking capital?”
That second question changes everything.
Because not every setup deserves execution.
Market Traps and Execution Errors
Many traders lose money inside market traps.
A trap happens when price action attracts traders into one side of the market, but the conditions behind the move are weak, late, exhausted, or unstable.
Common examples include:
A breakout that fails after traders buy the high.
A breakdown that reverses after traders sell the low.
A liquidity sweep that pulls traders into the wrong direction.
A strong candle that creates emotional late entries.
A range that traps both buyers and sellers repeatedly.
A session open move that reverses after collecting liquidity.
A trend that is real, but already too extended for fresh entry.
The painful part is that traps often look attractive before they fail.
That is why traders enter them.
A trap rarely looks obvious at the moment of entry. It usually looks like confirmation.
The breakout looks strong.
The candle looks powerful.
The direction looks clear.
The move looks urgent.
The trader feels pressure to participate.
But professional execution requires the ability to pause and ask:
Is this a clean entry, or is this where the crowd is being pulled in?
This question can save many unnecessary trades.
Prediction Creates Pressure
Many traders approach the market with one main question:
“Where will price go next?”
This question creates pressure because it forces the trader to predict.
Once the trader becomes emotionally attached to a direction, the mind begins to search for evidence that supports that direction. The trader may ignore invalidation, hold losing trades, move stop-losses, and avoid accepting that the original idea was wrong.
Professional execution uses a different question:
“Is the current condition suitable for a trade?”
This is a better question because it does not force prediction.
It focuses on qualification.
The trader is not trying to prove the market will go up or down. The trader is simply checking whether the current environment is clean enough to justify risk.
This shift is powerful.
Prediction creates emotional attachment.
Qualification creates discipline.
The Four Layers of Execution Quality
Strong execution usually requires four layers.
1. Market Context
Before any entry, the trader must understand the market environment.
Is the market trending, ranging, expanding, compressing, or reversing?
Is price near an important high, low, support, resistance, value area, or liquidity zone?
Is the higher timeframe aligned or conflicting?
Is the current move early, mature, or exhausted?
Is the session active enough?
Is volatility supporting the setup or damaging it?
Without context, entries become random.
A breakout method may work well in expansion but fail repeatedly in a range.
A reversal method may work near exhaustion but fail badly during strong trend continuation.
A scalping entry may work during active sessions but become weak during low-liquidity periods.
Context protects the trader from applying the right idea in the wrong environment.
2. Setup Qualification
After context, the trader must qualify the setup.
A setup should not be judged by one candle alone.
The trader should ask:
Why here?
Why now?
Where is the invalidation?
Where is the target?
Is the trade fresh or already late?
Is the move still offering value?
Is there enough space before the next obstacle?
Is the stop-loss placed beyond a meaningful level?
Is the market showing acceptance or rejection?
Many traders focus only on the trigger.
They see an engulfing candle, a breakout, a sweep, a pullback, or a structure shift, and they enter. But a trigger is not a complete trade.
A trigger is only one part of a qualified decision.
If the location, risk, target, and context are weak, the trigger alone is not enough.
3. Risk Positioning
Risk is not only about lot size.
Risk positioning means understanding the cost of being wrong.
A good trade should have logical invalidation. The stop-loss should not be placed only where the trader feels comfortable. It should be placed where the trade idea is actually proven wrong.
Many traders place stops based on money fear instead of market structure.
If the stop is too tight, normal market noise can remove the trade.
If the stop is too wide, the reward-to-risk may become poor.
If the position size is too large, the trader becomes emotional.
If the loss is too painful, the trader may break rules.
Good execution requires risk to match structure.
Before entry, the trader should know:
What proves this trade wrong?
How much capital is at risk?
Is the target realistic?
Is the reward worth the risk?
Can I accept this loss without emotional damage?
If these questions are not clear, the trade is not ready.
4. Trade Management
Entry is not the end of execution.
It is only the beginning.
Many traders enter with discipline but manage with emotion.
They close too early when price moves slightly in profit.
They hold too long when price moves against them.
They move the stop-loss.
They add to losing trades.
They exit before the plan because of fear.
They turn a planned trade into an emotional decision.
This is why management must be planned before entry.
The trader should know:
Where to reduce risk.
Where to take partial profit.
When to move the stop-loss.
When to exit early.
When to do nothing.
When the trade idea is invalid.
A trade without a management plan becomes a psychological test.
Most traders are not prepared for that test.
Execution Drift
Execution drift is one of the silent killers in trading.
It happens when a trader slowly moves away from the original rules.
At first, the trader follows the plan. Then small exceptions begin.
One early entry.
One late chase.
One extra trade.
One revenge trade.
One moved stop-loss.
One oversized position.
One trade outside the session.
One trade without complete confirmation.
Each mistake looks small.
But over time, these small violations destroy consistency.
The trader then blames the strategy, the market, the broker, or the indicator. But the real issue may be that the trader was no longer executing the original plan.
A strategy can only be measured properly if it is executed consistently.
If the trader keeps changing behavior under live pressure, the results no longer reflect the strategy.
They reflect emotional variance.
Why Traders Overtrade
Overtrading is not usually caused by lack of knowledge.
It is caused by lack of boundaries.
A trader without clear boundaries sees opportunity everywhere.
Every candle becomes a signal.
Every pullback becomes an entry.
Every breakout becomes confirmation.
Every missed move becomes emotional pain.
Every loss creates a desire to recover.
Every win creates confidence to take more risk.
Professional execution requires the ability to say no.
No to late entries.
No to unclear structure.
No to poor reward space.
No to emotional recovery trades.
No to low-quality setups.
No to trades outside the plan.
No to the need to always be active.
The quality of a trader is not measured only by the trades taken.
It is also measured by the trades avoided.
Avoiding a bad trade is a form of risk management.
Sometimes the best trade is no trade.
The Market Does Not Pay for Activity
Many traders think more trading means more opportunity.
In reality, more trading often means more exposure to mistakes.
The market does not reward activity.
It rewards quality decision-making under uncertainty.
A trader who takes fewer but cleaner trades may perform better than a trader who takes many average trades. This is especially true when spreads, commissions, slippage, fatigue, and emotional pressure are included.
Selectivity is not fear.
Selectivity is professionalism.
A disciplined trader does not need to participate in every move.
The goal is not to catch everything.
The goal is to execute well when the conditions are qualified.
Every Strategy Has Execution Risk
Different traders use different methods.
Some focus on price action.
Some use support and resistance.
Some use trend-following.
Some use liquidity concepts.
Some use market structure.
Some study order flow.
Some use volume.
Some use market profile.
Some use moving averages.
Some use session-based models.
Each method can have value.
But every method has the same weakness:
Execution risk.
A trader can understand liquidity and still enter too early.
A trader can understand market structure and still force a setup.
A trader can understand order flow and still react too fast.
A trader can understand market profile and still trade levels blindly.
A trader can understand price action and still chase candles late.
A trader can understand trend-following and still buy exhaustion.
So the real question is not only:
“Which strategy is best?”
A better question is:
“How do I control execution across any strategy?”
Because a strategy gives the idea.
Execution decides whether that idea is safe, qualified, and worth risking capital.
The Importance of Post-Trade Review
Execution cannot improve without review.
Most traders review only profit and loss.
But profit and loss does not tell the full story.
A winning trade can be badly executed.
A losing trade can be well executed.
This is why traders should review the quality of the decision, not only the outcome.
A useful post-trade review may ask:
Was the trade taken according to the plan?
Was the market context valid?
Was the entry clean or late?
Was the stop-loss logical?
Was the target realistic?
Was position size correct?
Was the exit based on rules or emotion?
Did I follow the process?
Was I trading the setup or my feelings?
This kind of review builds execution awareness.
It helps the trader identify repeated mistakes and correct them systematically.
Execution Is a System, Not a Feeling
Many traders depend on confidence.
But confidence changes.
It changes after a loss.
It changes after a win.
It changes when the market moves fast.
It changes when the account is under pressure.
It changes when the trader is tired.
It changes when the trader wants to recover.
A professional trader cannot depend only on confidence.
Execution must be systemized.
A systemized process gives the trader a repeatable decision framework. It reduces emotional interpretation. It creates structure before action. It helps the trader avoid impulsive decisions when the market becomes fast or confusing.
The goal is not to remove human judgment completely.
The goal is to guide judgment with rules.
Final Thought
Trading success is not built only on finding better setups.
It is built on executing better decisions repeatedly.
The market will always be uncertain. No trader can control the next candle. No trader can control liquidity, volatility, news, or sudden reversals.
But every trader can control process, risk, patience, and discipline.
The professional trader does not ask only:
“Where is the trade?”
The professional trader asks:
“Is this trade qualified enough to risk capital?”
That single question separates emotional trading from structured execution.
In the long run, execution is not just a part of trading.
Execution is the bridge between knowledge and results.
The more seriously a trader treats execution, the more professional the trading process becomes.
Read the market.
Respect the risk.
Wait for quality.
Execute with discipline.
Which execution problem do you think damages traders the most — early entry, late entry, overtrading, poor stop placement, or emotional exits?
Educational content only. This is not financial advice or a recommendation to buy or sell any financial instrument.
GOLD Breakout and Potential Retrace!Hey Traders, in tomorrow's trading session we are monitoring XAUUSD for a selling opportunity around 4,120 zone, GOLD was trading in an uptrend and successfully managed to break it out. Currently is in a correction phase in which it is approaching the trend at 4,120 support and resistance area.
Trade safe, Joe.
AAPL BEST PLACE TO BUY FROM|LONG
AAPL SIGNAL
Trade Direction: long
Entry Level: 281.28
Target Level: 297.58
Stop Loss: 270.32
RISK PROFILE
Risk level: medium
Suggested risk: 1%
Timeframe: 9h
Disclosure: I am part of Trade Nation's Influencer program and receive a monthly fee for using their TradingView charts in my analysis.
✅LIKE AND COMMENT MY IDEAS✅
Fed Rate Hike Talk Sends USDCAD Toward Key Buy Zone!Hey Traders,
In today's trading session, we are monitoring USDCAD for a potential buying opportunity around the 1.41500 zone. USDCAD is trading in a broader uptrend and is currently in a correction phase, with price approaching the 1.41500 support and resistance area, a key trendline support zone that could provide an attractive opportunity for bullish continuation.
From a fundamental perspective, the U.S. Dollar remains well supported following hawkish comments from former Fed Governor Kevin Warsh, who argued that the Federal Reserve should remain prepared to tighten policy further if inflation fails to ease. His remarks reinforced the market's higher-for-longer interest rate expectations, supporting both Treasury yields and the U.S. Dollar.
Meanwhile, the Canadian Dollar continues to face headwinds as markets assess the outlook for global growth and commodity prices. With the policy outlook favoring continued USD strength, the balance of risks remains skewed to the upside for USDCAD.
With price correcting into the 1.41500 support zone within a broader bullish structure, the current pullback may offer an attractive opportunity for buyers to position in line with the prevailing trend.
As long as price remains above the 1.41500 support zone, the bullish structure remains intact, and we anticipate continuation toward higher resistance levels.
Trade safe,
Joe
GOLD (XAUUSD): Support & Resistance Analysis for Next Week
Here is my latest structure analysis for Gold.
Resistance 1: 4113 - 4148 area
Resistance 2: 4190 - 4220 area
Resistance 3: 4329 - 4436 area
Support 1: 3958 - 4000 area
Support 2: 3886 - 3932 area
Support 3: 3771 - 3817 area
The price will likely rise more and reach Resistance 1.
Consider these structures for pullback/breakout trading.
❤️Please, support my work with like, thank you!❤️
I am part of Trade Nation's Influencer program and receive a monthly fee for using their TradingView charts in my analysis.
US10Y - Technicals Over Sentiment, Bearish Leg Starting?US10Y respected the technical structure despite the recent hawkish sentiment.
Price rejected the resistance area and the upper boundary of the weekly symmetrical red triangle, then broke below both the EMA50 and the green trigger area, which provided an early indication that a bearish leg may have started.
This move increases the probability that the recent reaction was driven more by technical factors than by the hawkish tone.
Price is now testing the EMA100, where a short-term reaction may develop and lead to a retest of the green area before continuation lower.
If the bearish scenario remains valid, the next area of interest becomes the lower boundary of the symmetrical triangle aligned with the support zone.
📌From a broader market perspective, US Treasury bonds are often considered lower-risk assets. Continued downside in US10Y yields may serve as an early signal that investors are gradually becoming more comfortable increasing exposure to higher-risk assets such as equities, cryptocurrencies, and other asset classes. However, confirmation across broader market conditions remains important.
The reaction around EMA100 may provide more clarity on whether the market is preparing for continuation lower, or if buyers still have room to challenge the breakdown.
⚠️ Disclaimer: This analysis reflects my personal market view and is not financial advice.
Rayan Nasser
#US10Y #Bonds #TechnicalAnalysis #PriceAction #EMA #MarketStructure #MacroAnalysis #Trading
XAG/USD Sell Setup – Watching for Bearish Confirmation at SupplySilver is testing a key supply zone after a strong recovery, where sellers may look to regain control. The recent rally appears corrective, and a bearish rejection with a break in short-term market structure would strengthen the case for a continuation of the broader downtrend. Until confirmation appears, the risk of further upside remains, making patience important before considering new short positions.
At the same time, renewed geopolitical tensions following the resumption of conflict in the Middle East are likely to keep volatility elevated. Safe-haven demand can trigger sharp rallies in precious metals, while shifts in market sentiment may quickly reverse those gains. Traders should also keep an eye on upcoming economic data and central bank commentary, as changes in interest rate expectations and U.S. dollar strength could significantly influence silver's next move. Combining technical confirmation with the evolving news flow may provide a stronger basis for trade decisions.
NZDUSD: Waiting For Another Breakout 🇳🇿🇺🇸
To accurately sell NZDUSD next week, I recommend waiting
for a bearish breakout and a daily candle close below 0.5636 key support.
That will be a strong signal to sell.
I will expect a bearish continuation to 0.569 then.
❤️Please, support my work with like, thank you!❤️
I am part of Trade Nation's Influencer program and receive a monthly fee for using their TradingView charts in my analysis.
USOIL SHORT FROM RESISTANCE
USOIL SIGNAL
Trade Direction: short
Entry Level: 73.51
Target Level: 72.53
Stop Loss: 74.15
RISK PROFILE
Risk level: medium
Suggested risk: 1%
Timeframe: 1h
Disclosure: I am part of Trade Nation's Influencer program and receive a monthly fee for using their TradingView charts in my analysis.
✅LIKE AND COMMENT MY IDEAS✅
EUR/USD BUYERS WILL DOMINATE THE MARKET|LONG
EUR/USD SIGNAL
Trade Direction: long
Entry Level: 1.134
Target Level: 1.139
Stop Loss: 1.130
RISK PROFILE
Risk level: medium
Suggested risk: 1%
Timeframe: 1h
Disclosure: I am part of Trade Nation's Influencer program and receive a monthly fee for using their TradingView charts in my analysis.
✅LIKE AND COMMENT MY IDEAS✅
ETH/USD LONG FROM SUPPORT
ETH/USD SIGNAL
Trade Direction: long
Entry Level: 1,574.73
Target Level: 1,816.87
Stop Loss: 1,413.27
RISK PROFILE
Risk level: medium
Suggested risk: 1%
Timeframe: 9h
Disclosure: I am part of Trade Nation's Influencer program and receive a monthly fee for using their TradingView charts in my analysis.
✅LIKE AND COMMENT MY IDEAS✅
AUD/CAD BULLS WILL DOMINATE THE MARKET|LONG
Hello, Friends!
It makes sense for us to go long on AUD/CAD right now from the support line below with the target of 0.980 because of the confluence of the two strong factors which are the general uptrend on the previous 1W candle and the oversold situation on the lower TF determined by it’s proximity to the lower BB band.
Disclosure: I am part of Trade Nation's Influencer program and receive a monthly fee for using their TradingView charts in my analysis.
✅LIKE AND COMMENT MY IDEAS✅
CHF/JPY SENDS CLEAR BEARISH SIGNALS|SHORT
Hello, Friends!
Previous week’s green candle means that for us the CHF/JPY pair is in the uptrend. And the current movement leg was also up but the resistance line will be hit soon and upper BB band proximity will signal an overbought condition so we will go for a counter-trend short trade with the target being at 199.448.
Disclosure: I am part of Trade Nation's Influencer program and receive a monthly fee for using their TradingView charts in my analysis.
✅LIKE AND COMMENT MY IDEAS✅
AUDUSD Bearish After Hawkish Fed Remarks!Hey Traders,
In the coming week, we are monitoring AUDUSD for a potential selling opportunity around the 0.69200 zone. AUDUSD is trading in a broader downtrend and is currently in a correction phase, with price approaching the 0.69200 support and resistance area, a key resistance zone that could provide an attractive opportunity for bearish continuation.
From a fundamental perspective, the U.S. Dollar continues to find support after Fed Governor Kevin Warsh's hawkish remarks, which reinforced the view that the Federal Reserve may need to maintain a restrictive policy stance if inflation remains persistent. His comments have strengthened the higher-for-longer narrative, supporting Treasury yields and the U.S. Dollar.
This creates a challenging environment for AUDUSD. The Australian Dollar, being a risk-sensitive currency, tends to underperform when the U.S. Dollar strengthens and markets price in tighter U.S. monetary policy. As long as the Fed maintains a hawkish tone, the balance of risks continues to favor further USD strength.
With price correcting into the 0.69200 resistance zone within a broader bearish structure, the current rally may present an attractive opportunity for sellers.
As long as price remains below the 0.69200 resistance zone, the bearish structure remains intact, and we anticipate continuation toward lower support levels.
Trade safe,
Joe
How I Confirm TRIX Divergence on Gold
This XAUUSD 1H chart shows two examples of how I use TRIX divergence together with price structure confirmation.
In the bearish example, price continued to hold near the highs while TRIX momentum was already weakening. For me, the divergence was an early warning, not an automatic sell signal.
The setup became more relevant only after price broke the local ascending structure. The structure break provided confirmation that the loss of momentum was beginning to affect price.
The bullish example shows the opposite sequence. Price moved into a lower area while TRIX formed a stronger momentum structure, creating a possible bullish divergence.
Again, the divergence itself was only a warning. I waited for price to break the local descending structure before considering the recovery scenario.
For me, the sequence is:
Divergence → momentum warning → structure break → possible trade scenario.
This indicator is not a standalone trading system. Divergences can warn about a possible correction or reversal, but they do not guarantee an immediate reversal. I use the same strategy on the 1 min chart for intraday scalping.
XAUUSD H4 — Liquidity Zones Decide The Next Move
Gold is trading around $4,088 after recovering from the low near $3,958. The short-term reaction is bullish, but the H4 structure is not fully reversed yet. Price is now moving between a lower buy liquidity zone and a higher medium-term sell OB zone, so chasing the middle range is not ideal.
From an SMC perspective, gold created a CHoCH near the lower area and started to push upward. This shows that buyers are trying to defend the lower demand zone. However, above the current price, there are still major liquidity and supply areas that may attract selling pressure again.
The key buy zone is $4,013–$4,027. If gold pulls back into this zone and buyers defend it with clear bullish confirmation, price may continue toward $4,110–$4,125, then $4,175–$4,195. The main sell reaction zone is $4,175–$4,195, where the medium-term OB is located. If price reaches this area and fails to break higher, sellers may return.
Buy setup 1
Condition:
Gold pulls back into the $4,013–$4,027 buy liquidity zone and confirms bullish MSS / CHOCH on lower timeframe.
Entry: $4,013–$4,027
SL: below $3,985
TP1: $4,088
TP2: $4,110–$4,125
TP3: $4,175–$4,195
Buy setup 2
Condition:
If gold breaks above the liquidity zone around $4,110–$4,125 and retests it as support, bullish continuation remains valid.
Entry: $4,110–$4,125 after breakout retest
SL: below $4,075
TP1: $4,150
TP2: $4,175–$4,195
TP3: $4,222
Sell setup
Condition:
Gold reaches the medium-term OB sell zone around $4,175–$4,195 and shows bearish rejection with MSS / CHOCH confirmation.
Entry: $4,175–$4,195
SL: above $4,222
TP1: $4,125
TP2: $4,088
TP3: $4,027
Key levels
Current price area: $4,088
Buy liquidity zone: $4,013–$4,027
Low area: $3,958
Liquidity zone: $4,110–$4,125
FVG area: $4,130–$4,160
Medium-term OB sell zone: $4,175–$4,195
Buy-side liquidity: $4,222
Month high: $4,383
Bullish confirmation: clean break above $4,125
Bearish reaction confirmation: rejection from $4,175–$4,195
Bullish invalidation: clean H4 close below $3,985
My current view is that gold is in a recovery phase after taking lower liquidity, but the safest Prime Gold plan is still to wait for price to reach major liquidity zones. I prefer buying only around the $4,013–$4,027 liquidity zone with confirmation, and watching for sell reaction if price reaches the $4,175–$4,195 OB zone.
No confirmation, no trade.
XAUUSD (1H) – Bullish Recovery SetupXAUUSD (1H) – Bullish Recovery Setup
Gold is showing signs of a bullish reversal after a strong sell-off into the 4,040 area. Price has reclaimed the 4,170 support and is now approaching a key demand zone around 4,300–4,320 (highlighted area).
The idea is for price to retest the demand zone, attract buyers, and then continue higher toward the first resistance at 4,363. A successful breakout above that level could open the path toward the major liquidity target around 4,541, where previous sellers entered the market.
Key Levels:
Demand Zone: 4,300–4,320
Resistance 1: 4,363
Major Target: 4,541
Invalidation: Sustained move below the demand zone
"Gold is recovering from a sharp decline and forming a potential bullish continuation structure. Watching the demand zone for buyer confirmation before targeting higher liquidity levels at 4,363 and 4,541."
MASON XAUUSD – Important Rebound Zone AheadMASON XAUUSD – Gold May Rebound Toward Fibonacci Before Next Decision
XAUUSD is trading around 3,997 after a strong bearish move inside the descending channel. Price remains below the Ichimoku cloud, so the main structure is still bearish.
However, gold is reacting near the strong liquidity zone and buy area around 3,960–3,990, so a short corrective rebound may appear before the next trend confirmation.
Technical View
Gold is still moving inside a clear bearish channel. The market has been creating lower highs and lower lows, showing that sellers are still controlling the main structure.
Price is also below the Ichimoku cloud. This means the broader trend has not shifted bullish yet. Any recovery from the current zone should be treated as a correction unless price can break above the cloud and hold.
The current area around 3,960–3,990 is important because it combines the marked buy zone and strong liquidity support. Price reacting here shows that sellers may slow down in the short term.
If buyers defend this zone, gold may recover toward 4,040–4,050 first, then the Fibonacci and liquidity area around 4,118. This is the key rebound target to watch.
The stronger resistance remains near 4,216. If price reaches this zone and rejects, the bearish trend may continue again.
Key Zones
Current price: 3,997
Buy reaction zone: 3,960–3,990
Short-term confirmation: 4,040–4,050
Fibonacci & liquidity zone: 4,118
Strong resistance: 4,216
Invalidation for recovery: below 3,960
Trading Plan
Buy Recovery Priority: 3,960–3,990
Condition: wait for bullish rejection, higher low, or price holding above the strong liquidity zone.
SL: below 3,960
TP1: 4,040–4,050
TP2: 4,118
TP3: 4,216
Alternative Scenario
If gold breaks and holds above 4,050, wait for a retest before looking for continuation toward the Fibonacci liquidity zone at 4,118.
Sell View
Sell remains the main trend view while price stays below the Ichimoku cloud and inside the descending channel. A cleaner sell setup may appear if gold rejects from 4,118 or 4,216.
Final View
Overall, gold is still in a bearish structure, but the current liquidity zone may create a short corrective rebound. The key area to watch is 4,118, where Fibonacci and liquidity may decide the next move.
Will gold rebound toward the Fibonacci zone first, or break below the strong liquidity area directly?