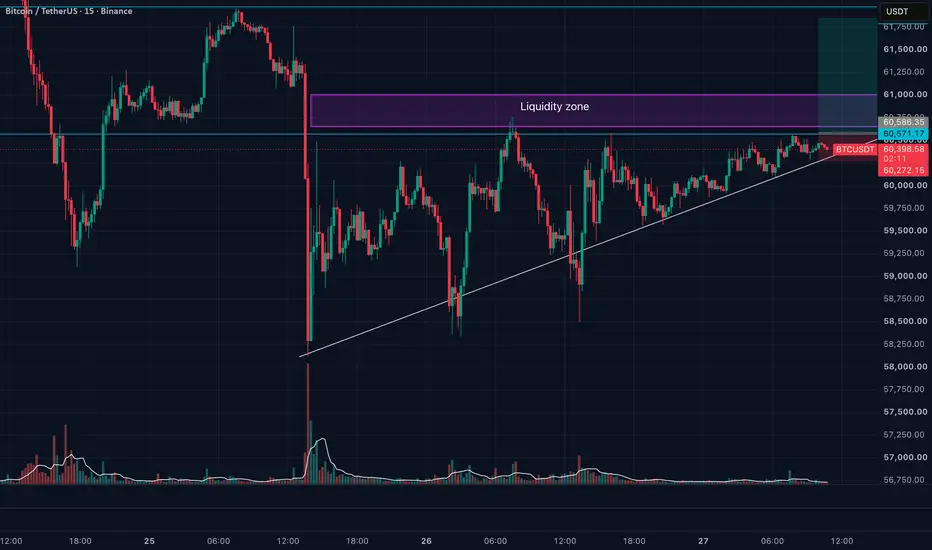
BTCUSDTBTCUSDT Long – Ascending Triangle Breakout (15m)
- Setup: Higher lows into liquidity zone at ~60,586. Triangle tightening near apex.
- Entry: Trigger long at 60,600 — or wait for 15m candle close above 60,586.
- Stop Loss: 60,250
- TP: 61,800 (~3.5R)
Context: Coinglass liquidity above 60,600 — sharp sweep likely on breakout.
---
Disclaimer
Always use proper money management. This is just an analysis — it can be wrong.
Triangle
BTC 1H: Trapping Trendline Sellers & Liquidity Hunt1. Market Context
On the 1H chart of image, Bitcoin has successfully performed a liquidity sweep at the 58,288 support level. The "No Buyer" signals at the lows confirm that the selling pressure has been absorbed, and the market is currently testing the major descending trendline.
2. Sentiment & Price Trap Analysis
• The Trendline Seller Trap: Retail traders are actively shorting at the descending trendline (marked "Seller"), expecting the downtrend to continue. They are building a massive pool
GOLD - Countertrend correction to the liquidity zoneFX:XAUUSD appears to be forming a local bottom and may enter a countertrend correction to build liquidity. However, the broader outlook remains negative, driven by a weak fundamental backdrop, a strong U.S. dollar, and the prevailing bearish trend
Gold remains vulnerable. The technical picture, combined with uncertainty surrounding the security of shipping through the Strait of Hormuz, continues to weigh on prices. In addition, doubts over the durability of the U.S.–Iran peace agreement ar
XAUUSD 1H: Trapping Trendline Sellers & Buyer Exhaustion1. Market Context
On the 1H chart of image, Gold is struggling under the major descending trendline. The price is currently oscillating within a small consolidation zone below the trendline, failing to sustain any significant bullish momentum.
2. Sentiment & Price Trap Analysis
• The Trendline Seller Trap: Retail traders are aggressively selling at the descending trendline (marked "Seller"), building a wall of buy-stop liquidity just above the trendline.
• The "A Few Buyer" Trap: Retail trader
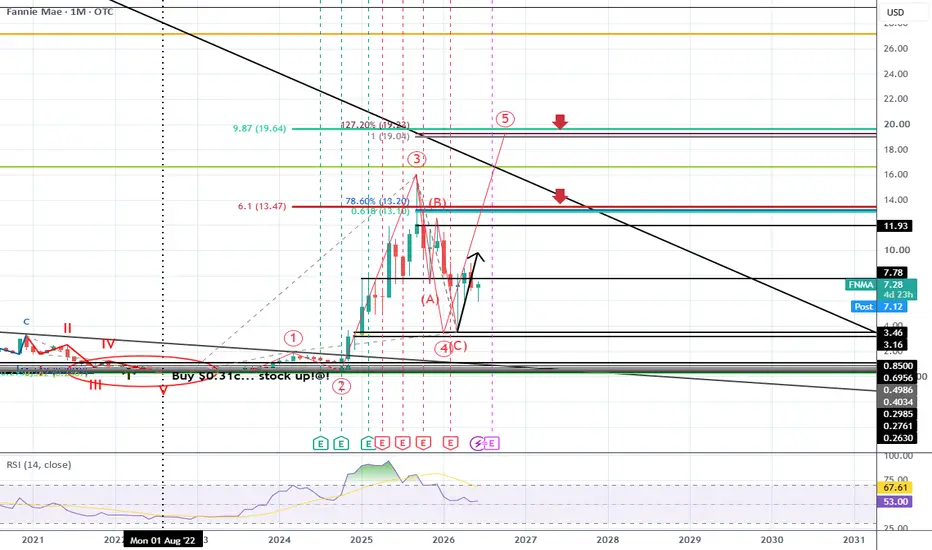
FNMA Monthly Wave 4 appears to be completeFNMA wave 4 appears to be complete, 285%.. which is solid, could buy now, sell half at $15 and let it ride with original cash out of it (that's what I do)...
My original investment in FNMA was returned years ago and if it reaches $20 then there should be a 6 figure profit with no original cash in it, but I do not trade this stock - it is a long term buy and hold...
Forming a monthly basing candle that looks like it will be targeting around $20 in the next 1-2 years, that's ~$7 to $20 =
The 5t
USDJPY: Ongoing Bullish Accumulation 🇺🇸🇯🇵
USDJPY continues coiling on the resistance at the current ATH.
I see an ongoing bullish accumulation on a 4H with a formation
of an ascending triangle pattern.
The market is likely preparing for a breakout of the underlined resistance.
Your strong confirmation signal will be its violation with a daily candle close above that.
The price will likely go way higher then.
❤️Please, support my work with like, thank you!❤️
I am part of Trade Nation's Influencer program and receive a monthly f
AAL- American Airlines Multi-Year Pattern Breaks to the UpsideNASDAQ:AAL is finally breaking out of a symmetrical triangle that has been forming since January 2025, setting up a high R/R swing opportunity.
I’m using the 3-day chart for this analysis.
Price has been compressing for 18 months inside this structure, and last week we saw a clean breakout with above-average volume, signaling expansion after long-term consolidation.
One of the key characteristics of symmetrical triangles is that the longer the consolidation lasts, the more meaningful the br
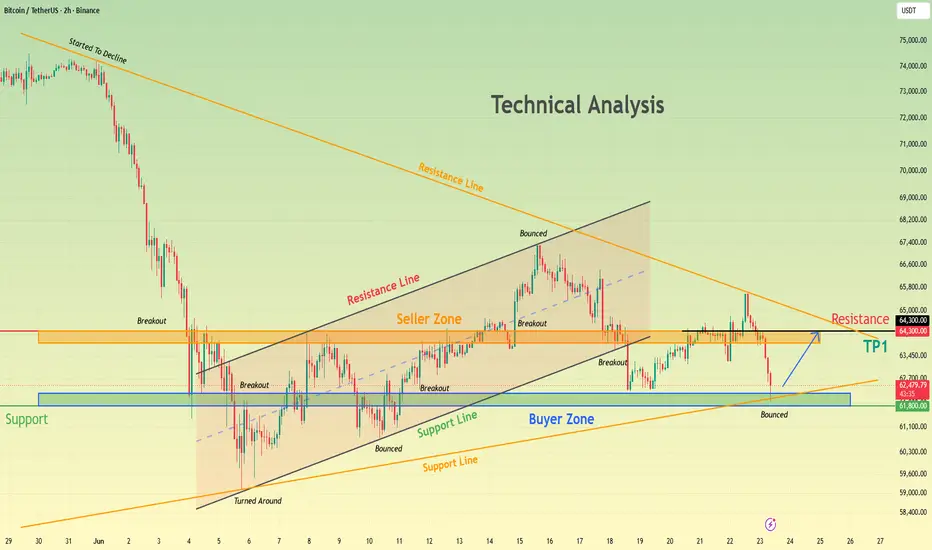
Bitcoin Buyers Step In at Support, Upside Target Remains ActiveHello traders! Here’s my technical outlook based on the current BTCUSDT (2H) chart structure. BTCUSDT experienced a strong bearish decline after breaking down from a major support area and remained under pressure beneath a long-term descending resistance line. After forming a local bottom, price recovered and traded inside an ascending channel, where buyers gradually regained control. Currently, BTCUSDT is trading above the 61,800 Buyer Zone while remaining below the 64,300 Seller Zone. The late
BITCOIN - Consolidation (correction) before the fallBINANCE:BTCUSDT.P remains under pressure. There is no meaningful fundamental support for the market, while the broader bearish trend continues to define the medium-term direction. There are still no clear signs of a market bottom forming
Globally, Bitcoin continues to maintain a bearish trend. Within this trend, the market remains in a consolidation phase with no indications of a reversal. Technically, the downtrend may continue in the medium term.
Fundamentally, the outlook remains weak.
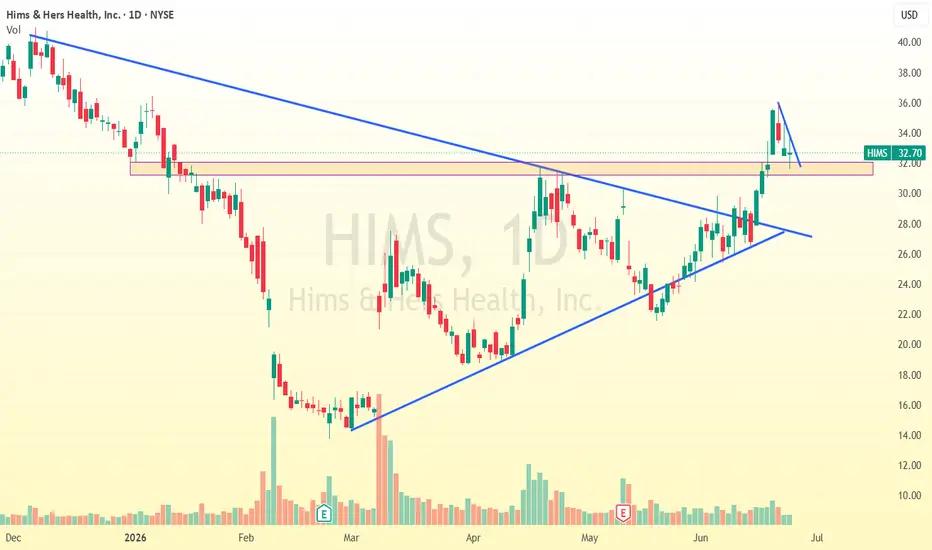
Reloading before the next jump. $HIMSA classic bullish structure: the price broke through a long-term downtrend (large triangle/wedge) with a powerful upward impulse, after which it moved above a strong horizontal resistance level (purple zone). The current local decline (a short, orphaned flag) represents a perfect mirror retest of the broken horizontal level, which now acts as support.
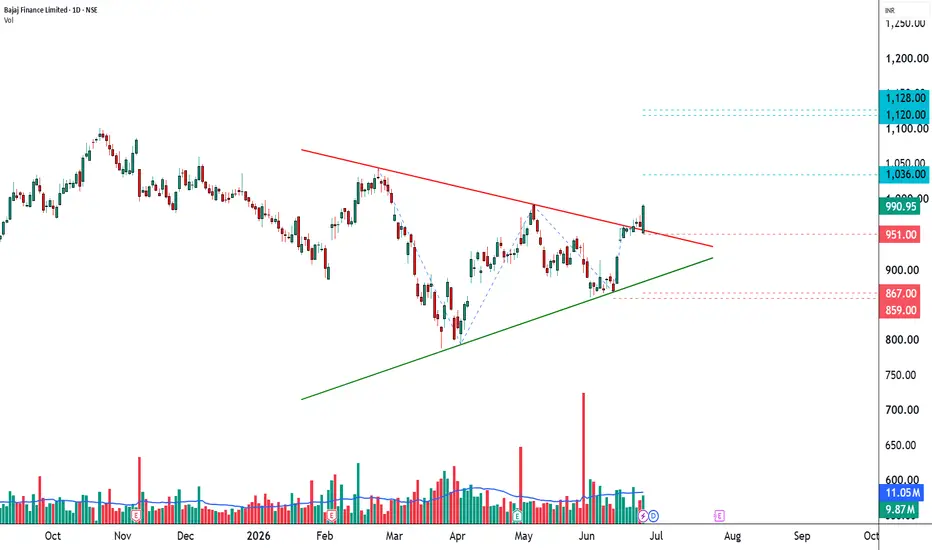
BAJFINANCE Emerging From 4-Month Compression────────────────────────
📊 STWP BREAKOUT ANALYSIS
Stock: Bajaj Finance Limited (BAJFINANCE)
Trend: Bullish
Pattern: Symmetrical Triangle Breakout
Range High/Low: 1046 - 792.45
Range Duration: 4 Month
Breakout Probability: Strong (89%)
Volume Participation: High | Volume Expansion: 0.89x
Breakout Level: 993
Retest Level/Levels: 960.00
Invalidation Level/Levels: 951 | 867.00 | 859.00
Reference Level/Levels: 1,036.00 | 1,120.00 | 1,128.00
Next Level: Watch Reference Levels
───────────────────────
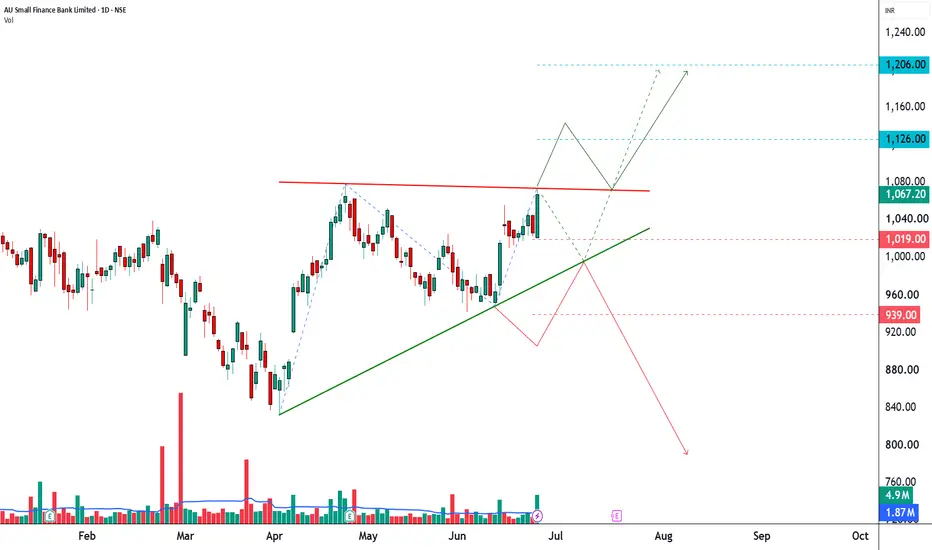
AUBANK Elite Breakout: 2.62x Volume Surge Confirmed!────────────────────────
📊 STWP BREAKOUT ANALYSIS
Stock: AU Small Finance Bank Limited (AUBANK)
Trend: Bullish
Range High/Low: 1062.90-941.40
Range Duration: 1 Month 10 Day
Breakout Probability: Elite (94%)
Volume Participation: Exceptional | Volume Expansion: 2.62x
Breakout Level: 1073.00
Retest Level/Levels: 1062.90 | 1060.25-1062.90
Invalidation Level/Levels: 1019.55 | 945.80 | 939.95
Reference Level/Levels: 1126.45 | 1200.20 | 1206.05
Next Level: Watch Ref Levels
────────────────────────
D
TCIEXP Ascending Triangle Breakout With Exceptional Volume────────────────────────
📊 STWP BREAKOUT ANALYSIS
Stock: TCI Express Ltd. (TCIEXP)
Trend: Bullish
Range High/Low: 593.55-452.00
Range Duration: 1 Month 27 Day
Breakout Probability: Elite (89%)
Volume Participation: Exceptional | Volume Expansion: 18.68x
Breakout Level: 625.00
Retest Level/Levels: 593.55 | 592.05-593.55
Invalidation Level/Levels: 523.90 | 499.15 | 450.75
Reference Level/Levels: 726.10 | 750.85 | 799.25
Next Level: Watch Ref Levels
────────────────────────
Disclaimer:
This analy
Gold Holds Rising Support Line, Eyes Retest of 4,270$ ResistanceHello traders! Here’s my technical outlook based on the current XAUUSD (4H) chart structure. XAUUSD has been trading below a long-term descending trendline after breaking down from a consolidation range. Several recovery attempts were rejected near trendline resistance, confirming that sellers remained in control of the broader trend. Currently, XAUUSD is trading above the 4,120 Buyer Zone while remaining below the 4,270 Seller Zone. After finding support near the recent low, price formed a risi
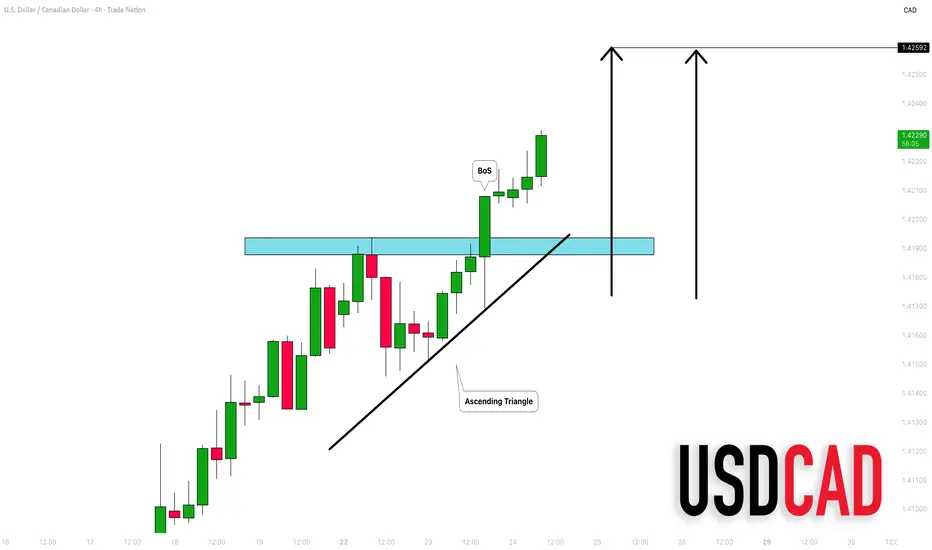
USDCAD: Bullish Continuation 🇺🇸🇨🇦
As I predicted earlier this week, USDCAD continues rising.
I see a strong intraday bullish signal with a breakout of a horizontal neckline
of the ascending triangle pattern on a 4H time frame.
The price will likely reach 1.426 level soon.
❤️Please, support my work with like, thank you!❤️
I am part of Trade Nation's Influencer program and receive a monthly fee for using their TradingView charts in my analysis.
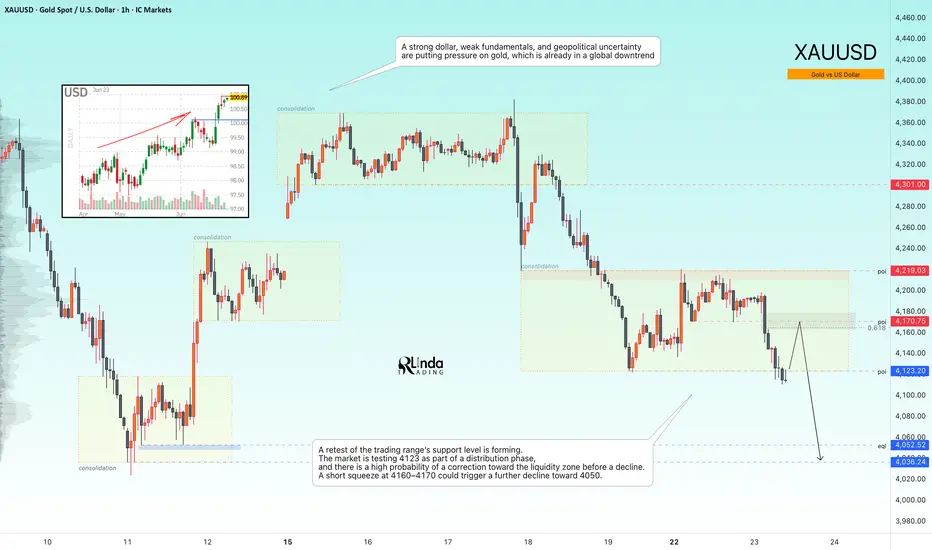
GOLD - A correction before the decline continues toward 4000ICMARKETS:XAUUSD continues to decline and print new lows under pressure from three key factors: a strong U.S. dollar, a weak fundamental backdrop, and ongoing geopolitical uncertainty. In the medium term, the market may remain under bearish control.
Sellers continue to dominate. The dollar remains strong, while expectations of a Federal Reserve rate hike continue to pressure gold as a non-yielding asset. Any rebound is likely to be viewed as an opportunity for fresh selling. Key catalysts
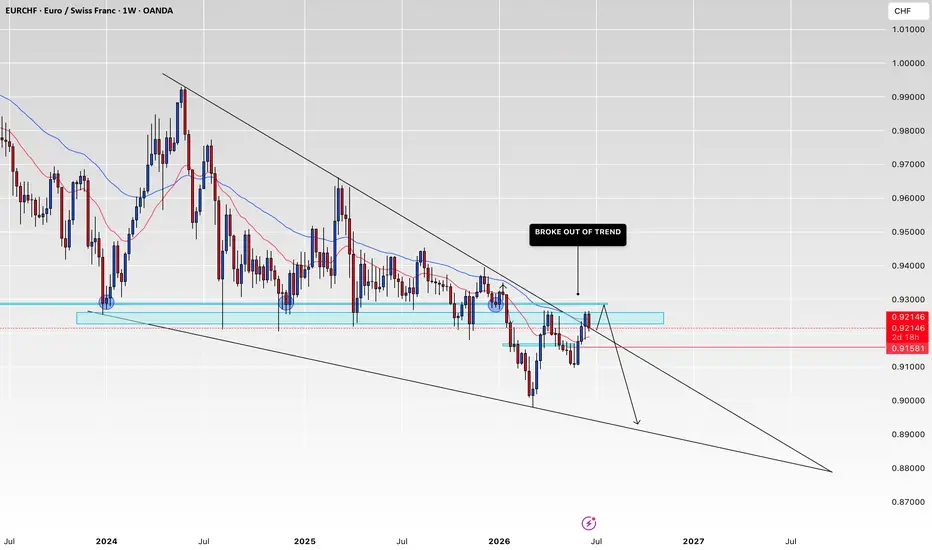
EURCHF (NETURAL)EURCHF - Has broken out of a trend like always we follow the trend but this case everyone is looking to sell anyways, since price did break the tend my prediction is that price will go down but not all the way down and then go back up and reach another key area before actaully dropping and contuining with the down trend @Think like market makers 📈📉
UNITDSPR: 221-Point Price Squeeze Near Decision Zone🔥 UNITDSPR: 221-Point Price Squeeze Near Decision Zone — What Happens Next? 📊
United Spirits Limited (UNITDSPR) is currently trading inside a well-defined Symmetrical Triangle pattern. The price range has been getting smaller over the last few weeks, suggesting that the stock is moving towards an important decision point.
________________________________________
📐 Chart Structure
The current pattern is formed by lower highs and higher lows.
Key Levels
Pivot A (Base High): 1,431.00
Pivot B (Base
CIPLA: 278-Point Compression Near a Major Resistance Zone🔥 CIPLA: 278-Point Compression Near a Major Resistance Zone — Expansion Ahead? 📊
Cipla Limited (CIPLA) is currently trading within a tight price structure just below a key resistance area at 1,444.50. As price continues to compress beneath this supply zone, the chart is approaching a point where a larger directional move may begin to develop.
________________________________________
📐 Understanding the Current Structure
What makes this setup particularly interesting is that it can be viewed
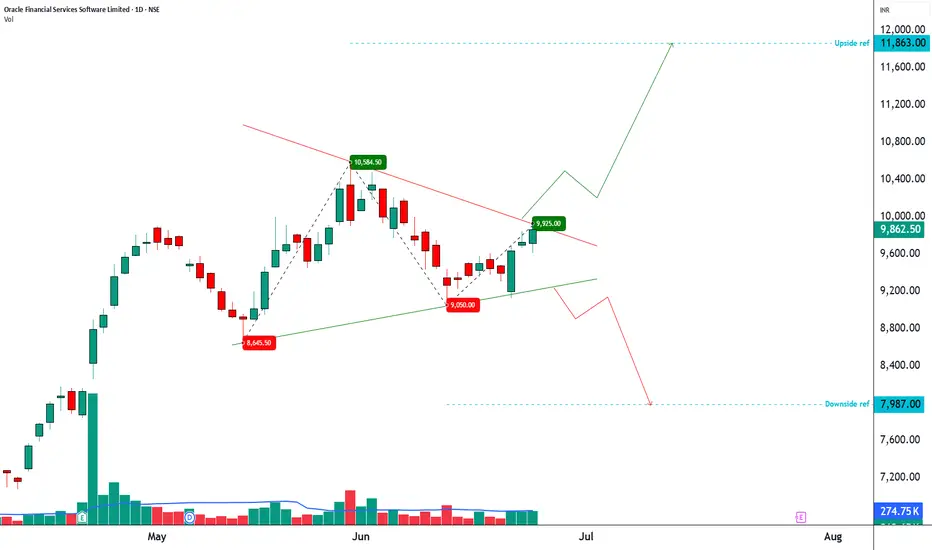
OFSS: Volatility Coiling for an Imminent 1,938-Point Move!🔥 OFSS: Volatility Coiling for an Imminent 1,938-Point Move! 🚀
Oracle Financial Services Software Limited (OFSS) is currently trading at a critical decision point as price compresses into the apex of a well-defined Symmetrical Triangle. With volatility steadily contracting and structure tightening around Pivot D, the market appears to be storing energy for a directional move that could exceed 1,900 points.
________________________________________
📐 Pattern Structure: Symmetrical Triangle
The