GOLD - Retest of consolidation resistance. Ready for a rally?FX:XAUUSD resumed attempts to consolidate above $5,200 amid global relief and a pullback in oil prices. The reason: Trump's signals about a possible end to the war in Iran (manipulation?)
Geopolitical easing: Trump said the war is “almost over” (we all know Trump's maneuvers...), adding that sanctions against Russian energy could be eased.
Reaction: Oil fell sharply after rising to 3-year highs. The dollar is being sold, US stock indices are rising. The market is recovering, money is flowing into gold due to the weakening of the dollar.
However, Iran's rhetoric and production cuts in the Persian Gulf maintain the threat of a new round of oil shock. Tomorrow's CPI will be the next key trigger. Focus on key levels...
Resistance levels: 5190, 5226, 5270
Support levels: 5154, 5121, 5086
The market is holding resistance at 5190 due to uncertainty. A correction to the zones of interest 5154 - 5121 is possible before another attempt to break through the trigger and expectations of distribution due to the inflow of funds into gold (the reasons are described above). The structure will break down if the market closes below 5121 (the fundamental background changes quite often, and the market will react).
Best regards, R. Linda!  Long
Long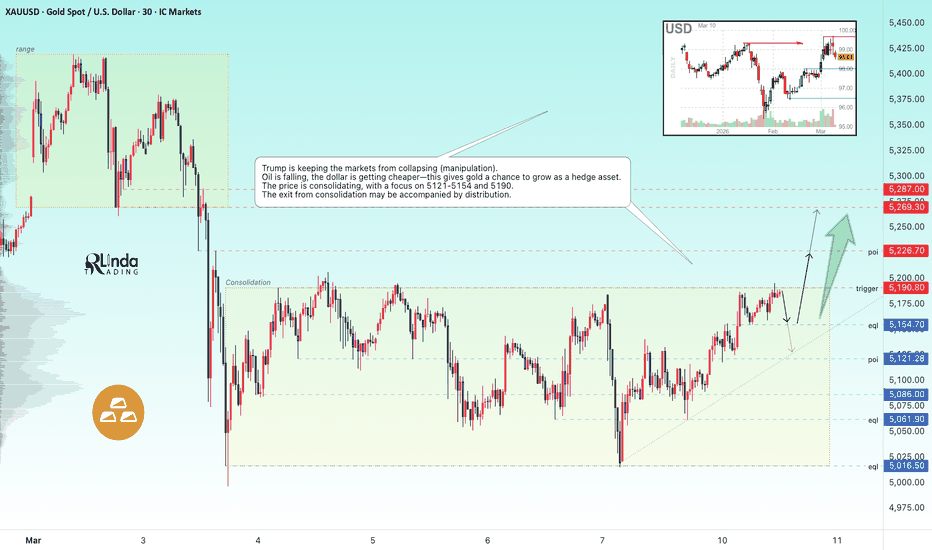
BTCUSDT: Structure Suggests Possible Recovery Toward 68.8KHello everyone, here is my breakdown of the current BTCUSDT setup.
Market Analysis
BTCUSDT previously moved inside a clearly defined downward channel, where sellers remained in control and price consistently formed lower highs and lower lows. This bearish structure reflected steady selling pressure as the market respected both the upper resistance boundary and the lower support of the channel. During this phase, recovery attempts were repeatedly rejected near the descending resistance line, confirming that sellers were actively defending the trend. After the decline reached a lower price region, the market formed a fake breakout below the broader triangle support line, which briefly pushed price lower before buyers stepped in and triggered a strong rebound. This reaction signaled the presence of demand and led to a recovery phase that brought price back above the support line and toward a previously established support zone around 66,600. Eventually, price broke out of this range to the upside, producing a strong bullish impulse that pushed the market toward a higher range formation near the local highs.
Currently, after reaching this upper consolidation area, BTC began to lose momentum and shifted into another corrective phase. The market then formed a new downward channel, where price gradually drifted lower while respecting the descending resistance line. This decline brought BTC back toward the support zone near 66,600, which now aligns with the rising triangle support line, creating a key confluence area where buyers could potentially step in again.
My Scenario & Strategy
As long as BTCUSDT continues to hold above the 66,600 support zone and respects the ascending triangle support line, the broader bias remains bullish. This area represents a strong demand region where buyers previously reacted, and another bounce from this level could trigger a recovery move back toward the 68,800 resistance zone, which also aligns with the former resistance area and the upper boundary of the recent structure. A successful rebound from support could push price out of the current downward channel and initiate a new bullish leg toward the 68,800 resistance level, which represents the primary upside target for this scenario. A confirmed breakout and consolidation above this level would indicate strengthening bullish momentum and could open the path for a broader recovery.
However, if price fails to hold the 66,600 support zone and breaks below both the horizontal support and the triangle trend line, the bullish outlook would weaken. Such a breakdown could trigger further downside continuation and expose lower demand levels. For now, the structure favors long opportunities near support, while the market approaches an important decision zone between demand and the descending channel resistance. As always, wait for confirmation and manage your risk properly.
That’s the setup I’m tracking. Thank you for your attention, and always manage your risk.  Long
Long
HYPEUSDT - Correction before continuing the rally to 40.0BINANCE:HYPEUSDT.P is testing the resistance of the trading range within the local bullish trend and is preparing to continue growing, but after a correction...
Bitcoin is stagnating (consolidating against the backdrop of a global bearish trend), but HYPE looks stronger than the market and the flagship in general. The altcoin is forming a local uptrend and a bullish structure, which is generally confirmed by the growth of bullish volumes.
HYPE has formed a false breakout of the trading range resistance, and while the market is stagnating, the altcoin may enter a correction phase (to 33.0 - 32.300) before continuing its growth.
Resistance levels: 34.85, 36.27, 38.24
Support levels: 32.35, 31.275
A false breakout could trigger a pullback (correction) with the aim of accumulating potential for continued growth. The zone of interest, which could play an important role as support at 33.0 - 32.35 for continued growth towards the intermediate high of 38.24.
Best regards, R. Linda!
 Long
Long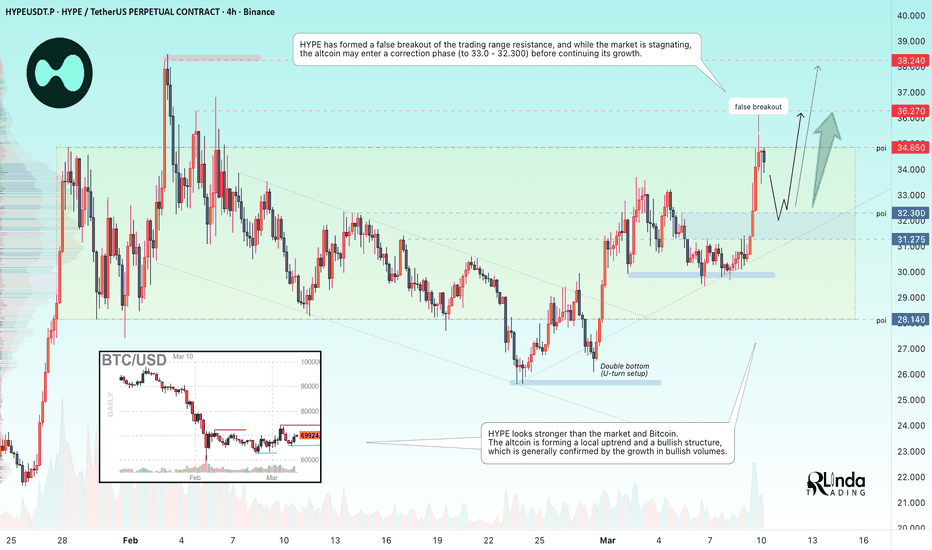
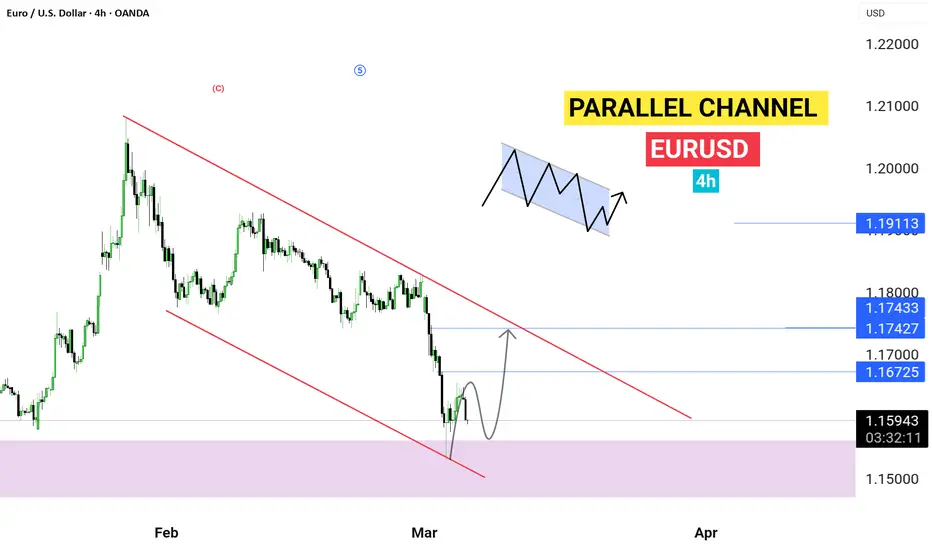
EURUSD: Descending Structure Favors Further Decline To 1.1530Hello everyone, here is my breakdown of the current EURUSD setup.
Market Analysis
EURUSD previously traded inside a clearly defined downward channel, where sellers maintained control and price consistently formed lower highs and lower lows. This structure reflected sustained bearish pressure as the market respected both the upper resistance boundary and the lower support of the channel. During this phase, every recovery attempt was limited, and price continued drifting lower within the descending structure. After this decline, the market transitioned into a horizontal range consolidation, where price moved sideways between clearly established boundaries. This range represented a temporary equilibrium between buyers and sellers, with multiple tests of both the upper and lower edges confirming the importance of these levels. Price repeatedly reacted to these boundaries, showing that liquidity was building inside the range before the next directional move.
Currently, price is trading below the former range structure and is approaching a descending triangle resistance line, which is compressing the market from above. At the same time, the horizontal resistance zone around 1.1620 continues to act as a barrier where sellers remain active. This combination of horizontal resistance and dynamic trendline resistance creates a confluence area where bearish continuation could develop.
My Scenario & Strategy
As long as EURUSD remains below the 1.1620 resistance zone and continues to respect the descending triangle resistance line, the short-term bias remains bearish. This area is likely to attract selling pressure, especially if price forms another rejection from the trendline and fails to reclaim the previous breakout level. A confirmed rejection from this resistance confluence could trigger another leg lower toward the 1.1530 support zone, which represents the next key demand area on the chart. This level previously acted as a reaction zone where buyers stepped in, making it the primary downside target for the current bearish scenario.
However, if buyers manage to push price above the 1.1620 resistance and break the descending triangle structure, the bearish outlook would weaken. Such a move could signal a deeper corrective rebound and potentially shift the market back toward the prior range area. For now, the structure favors short opportunities near resistance, while the market remains under strong bearish pressure following the range breakdown. As always, wait for confirmation and manage your risk properly.
That’s the setup I’m tracking. Thank you for your attention, and always manage your risk. GOLD - Profit taking and market pressureICMARKETS:XAUUSD started the week with a drop to $5,000, despite its status as a safe-haven asset. The main reasons are the abnormal rise in oil prices and the strong dollar. Focus on key levels within the flat
Markets fear that inflationary pressures will force the Fed to abandon rate cuts (a “hawkish” scenario), which is putting pressure on gold. (Expensive oil and a strong dollar are putting enormous pressure on gold)
Iran has appointed a new leader, signaling a continuation of its hard line, and the conflict is likely to drag on in the medium term
Gold has temporarily lost its correlation with geopolitics due to the oil shock, which has shifted the focus to inflation and Fed rates. A return to growth requires either signs of de-escalation (lower oil prices) or confirmation that the Fed will indeed ease despite inflation. For now, the dollar and oil rule the roost.
Resistance levels: 5143, 5169, 5190
Support levels: 5086, 5054, 5016
A false breakout of the nearest resistance zones and pressure from bears could trigger a decline within the flat, but if gold breaks below the support range, the decline could accelerate.
Best regards, R. Linda! Short 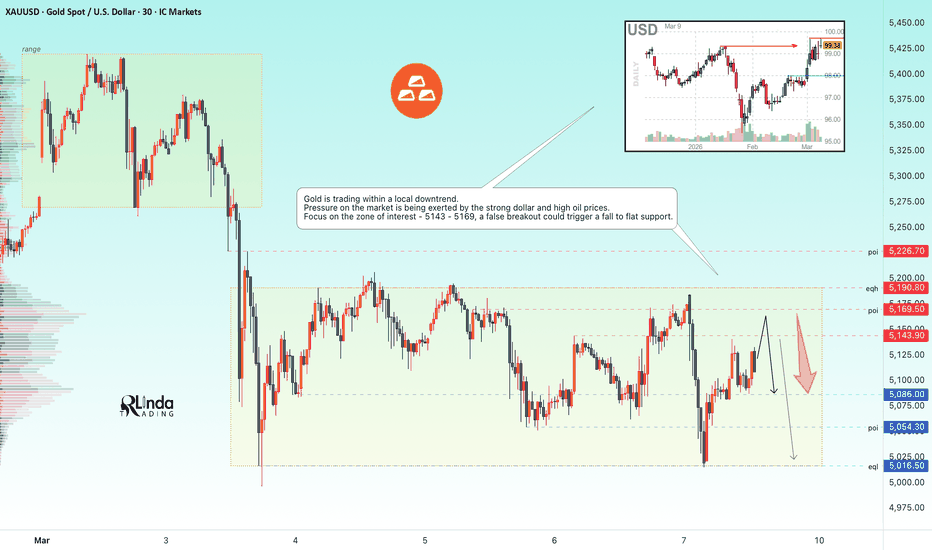
 Short
Short
BTCUSDT Analysis: Rejection at 71,400 Signals Possible PullbackHello traders! Here’s my technical outlook based on the current BTCUSDT (3H) chart structure. Bitcoin previously moved under a broad descending resistance line, where sellers maintained control and the market consistently produced lower highs after each recovery attempt. This structure reflected sustained bearish pressure, with price repeatedly failing to break above the dynamic resistance boundary. During this period, the market experienced several breakout attempts around the mid-range levels, but these moves lacked strong follow-through and quickly returned back inside the broader structure. After the initial decline, price stabilized and began forming a consolidation phase within a clearly defined horizontal range. This range acted as a temporary balance between buyers and sellers, where both sides tested key levels multiple times. The lower boundary of this structure repeatedly attracted buying interest, while the upper boundary near the seller zone consistently triggered selling reactions. Inside this consolidation, the market printed several breakout and retest movements, showing how liquidity was being collected around the key horizontal levels. Bitcoin currently trades near the Seller Zone and descending resistance, where strong selling pressure previously appeared. Price has already shown rejection from the resistance area near 71,400, suggesting that sellers are actively defending this level. At the same time, the market is forming a compression structure between the descending resistance and the ascending support line. My primary short scenario will activate if price fails to break above the resistance zone and starts moving lower. A confirmed rejection from the 71,400 Seller Zone could trigger a pullback toward the 69,000 support level, which also aligns with the horizontal Buyer Zone and the lower boundary of the current structure. If bearish momentum increases and price breaks below 69,000, this would confirm a breakdown of the ascending support line and open the door for a deeper correction toward lower liquidity levels. For now, the key trigger for the short setup remains strong rejection from resistance and a breakdown below support, which would shift short-term momentum back in favor of sellers. Please share this idea with your friends and click Boost 🚀 Short 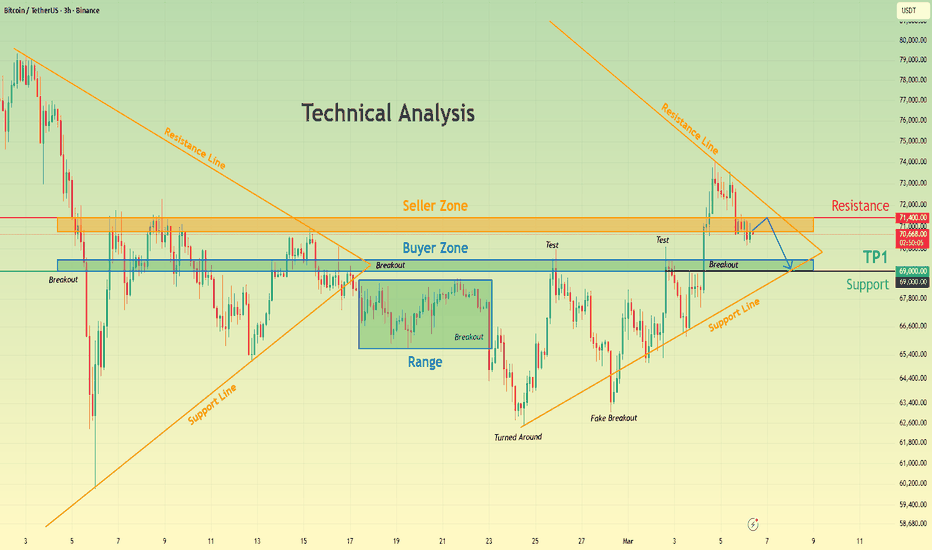
Long 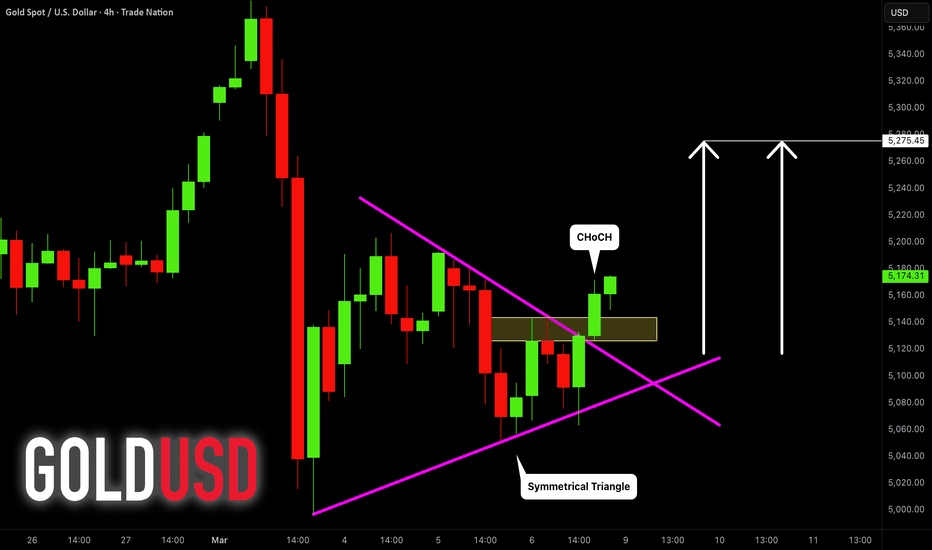
 Short
Short
GOLD - Pressure from bearsICMARKETS:XAUUSD continues to test local lows amid stagnation ahead of the key US employment report (NFP). The rise of the dollar and oil is putting pressure on gold.
The dollar is stagnating ahead of the NFP, with the market awaiting data.
Oil is updating interim highs in a rally phase due to the complete closure of the Strait of Hormuz.
NFP ahead. Expectations are for +58K jobs against 130K last month. Unemployment: expected to remain unchanged
Two scenarios : Weak NFP (<58K) will support gold.
Strong NFP: will strengthen the dollar and put pressure on gold.
The geopolitical background is tense, but against the backdrop of the current crisis, gold is a secondary asset. Further movement depends on unemployment data.
Resistance levels: 5121, 5145, 5190.8
Support levels: 5086, 5054, 5016
Gold remains a hedge asset, with whales preventing the asset from falling sharply. The market is under pressure from a local downtrend. From 5121, gold may head towards the support range, however, a long squeeze of 5054 - 5016 may form a rebound to liquidity zones.
Best regards, R. Linda! Short 
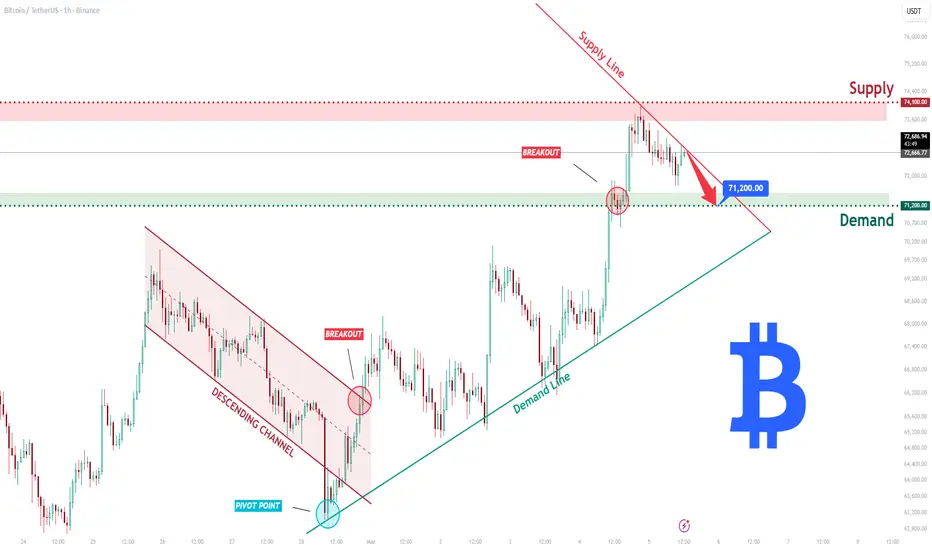
BTCUSDT Short: Pullback Scenario Toward 71,200 Before Next MoveHello traders! Here’s my technical outlook based on the current BTCUSDT (1H) chart structure. Bitcoin previously moved within a clearly defined descending channel, where price consistently printed lower highs and lower lows, confirming sustained bearish pressure during that phase. Sellers controlled the structure as the market repeatedly respected the upper boundary of the channel while gradually pushing price lower. The decline eventually reached a major pivot point where strong buying interest appeared near the lower boundary of the structure. Following this reaction, BTC formed a sharp breakout above the descending channel, signaling the first sign of structural recovery. This breakout shifted short-term market sentiment and allowed price to transition into a new bullish phase, supported by the formation of a rising demand trend line. From that moment, buyers regained momentum and began printing higher highs and higher lows, confirming a developing upward structure.
Currently, price is trading within this compression pattern, where the market is forming lower highs against the descending supply line while still holding above the key demand zone around 71,200. This level now acts as the primary structural support where buyers may attempt to defend the bullish structure.
My primary scenario as long as BTCUSDT holds above the 71,200 demand zone and continues to respect the rising demand trend line, the broader bullish structure remains intact. However, the presence of the descending supply line suggests that short-term pressure from sellers still exists. If price continues to reject from this resistance area, a controlled pullback toward the 71,200 demand zone becomes the most likely scenario. This level represents the key reaction area where buyers could step back in and attempt to resume the upward movement. A strong reaction from this demand zone could trigger another bullish push toward the 74,100 supply region, which remains the next major resistance. A confirmed breakout and acceptance above this level would signal renewed bullish momentum and open the path for further upside expansion. For now, BTC remains in a tightening structure between supply and demand, where patience and confirmation are essential before entering new positions. Manage your risk!
Short 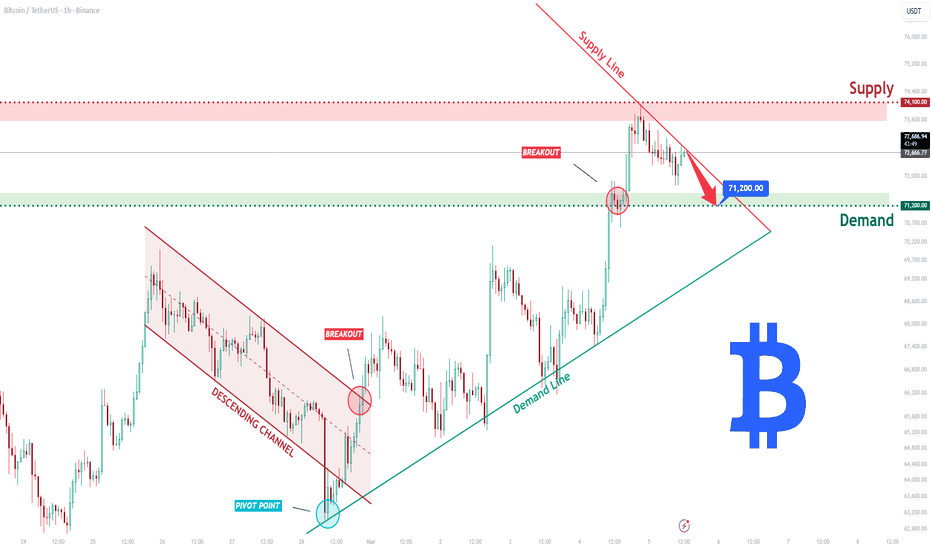
EURUSD Long: Holding Demand Opens Door for Upside CorrectionHello traders! Here’s my technical outlook based on the current EURUSD (2H) chart structure. Price initially traded inside a broad horizontal range, where the market showed balance between buyers and sellers. Within this range, price respected both the upper and lower boundaries, signaling consolidation after the prior move. Eventually, EURUSD broke out to the upside from this range, but bullish continuation failed to develop. Shortly after the breakout, price was rejected and transitioned into a descending channel, where sellers gradually took control. Following this decline, EURUSD entered another horizontal range, reflecting temporary stabilization and reduced volatility. This phase represented short-term equilibrium after the impulsive move lower. However, the range eventually resolved to the downside with a strong bearish breakout, pushing price directly into a key demand zone around 1.1570. At this demand area, price briefly dipped below support, creating a fake breakout. Sellers failed to maintain acceptance below the level, and price quickly reclaimed the zone, signaling a liquidity grab rather than genuine continuation. From this point, buyers stepped in and price began to recover, forming a rising demand line and initiating a corrective rebound toward the broken structure.
Currently, EURUSD is trading between the rising demand trend line and the overhead supply zone near 1.1670, where previous support has flipped into resistance. This creates a compression structure, with price reacting between demand and supply. A recent breakout attempt into supply has stalled, suggesting that sellers are still active at this level.
My primary scenario remains cautiously bullish in the short term while price holds above the demand zone and respects the rising demand line. A successful push and acceptance above the 1.1670 supply area would confirm bullish continuation and open the path toward higher liquidity levels. However, continued rejection from supply could lead to another pullback toward the demand zone, keeping the market in a corrective structure. For now, EURUSD remains in a reaction phase between demand and supply, where confirmation is key. Manage your risk! Symmetrical compression (potentially explosive)Drone warfare is now a reality: those who manufacture drones will certainly win, but those who can take them down are just as essential.
Some info:
DroneShield is an Australian company experiencing extremely rapid growth due to the global surge in demand for anti‑drone technologies. In 2025, it recorded revenue growth of 276–277%, reaching AUD 216.5 million, and returned to stable profitability with AUD 210 million in cash and zero debt. Its order pipeline has reached AUD 2.3 billion, supported by military contracts in Europe, the US, and the Middle East. The company is also expanding production capacity to AUD 2.4 billion per year by 2026 to meet rising demand. The stock has gained over 286% in the past year, boosted by strong growth in its software (SaaS) segment, which increases recurring revenue and margins.
What does DroneShield produce?
DroneShield specializes in C‑UAS (Counter‑Unmanned Aerial Systems) technologies—systems designed to detect, identify, and neutralize hostile drones. It produces:
Portable anti‑drone systems, including handheld devices, accessories, and software updates, such as those involved in recent AUD 49.6 million European contracts.
Advanced sensors, including RF, acoustic, and optical detectors, capable of identifying drones at long distances.
Jamming systems and “drone‑defeat” technologies used by militaries and critical infrastructure in over 70 countries.
Software and SaaS platforms for threat analysis, control, and management—one of the company’s fastest‑growing segments, up more than 300% in a year.
----
Analysis
The price is currently moving within a symmetrical compression triangle that has now reached its apex. A breakout could occur today or, more likely, next week.
The breakout from a compression triangle generally leads to a strong move in the direction of the breakout, making this a good time to start monitoring the setup.
Updates will follow.
If you appreciate my ideas, I’d be grateful for a like.  Long
Long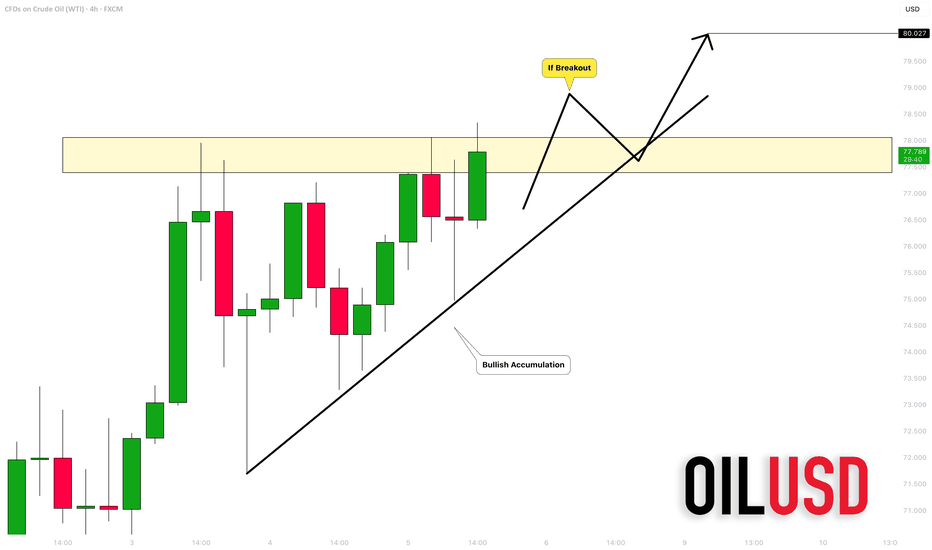
Bitcoin Just Reclaimed $68,000 — Breakout Confirmation Next?After the military tensions in the Middle East began, Bitcoin ( BINANCE:BTCUSDT ) initially moved lower. However, as the situation stabilized, the market regained confidence — and BTC started to recover.
Now, Bitcoin has successfully broken the key $68,000 trading level and is currently attempting to break the upper lines of a symmetrical triangle.
From an Elliott Wave perspective, it appears that BTC is completing microwave C of the main wave Y.
In addition, Bitcoin maintains a strong correlation with the SPX500 index( FX:SPX500 ). Since SPX500 has been pumping strongly in recent hours, this increases the probability of further upside for BTC.
I expect Bitcoin to break the upper lines of the symmetrical triangle and potentially move toward at least $70,881.
Will BTC successfully confirm the breakout and continue higher?
First Target: $70,881
Second Target: $72,273
Third Target: Cumulative Short Liquidation Leverage($74,560-$72,440)
Stop Loss(SL): $66,956
Points may shift as the market evolves
Cumulative Long Liquidation Leverage: $68,480-$67,760
Cumulative Long Liquidation Leverage: $64,440-$63,750
💡 Please respect each other's opinions and express agreement or disagreement politely.
📌Bitcoin Analysis (BTCUSDT), 4-hour time frame.
🛑 Always set a Stop Loss(SL) for every position you open.
✅ This is just my idea; I’d love to see your thoughts too!
🔥 If you find it helpful, please BOOST this post and share it with your friends. Long 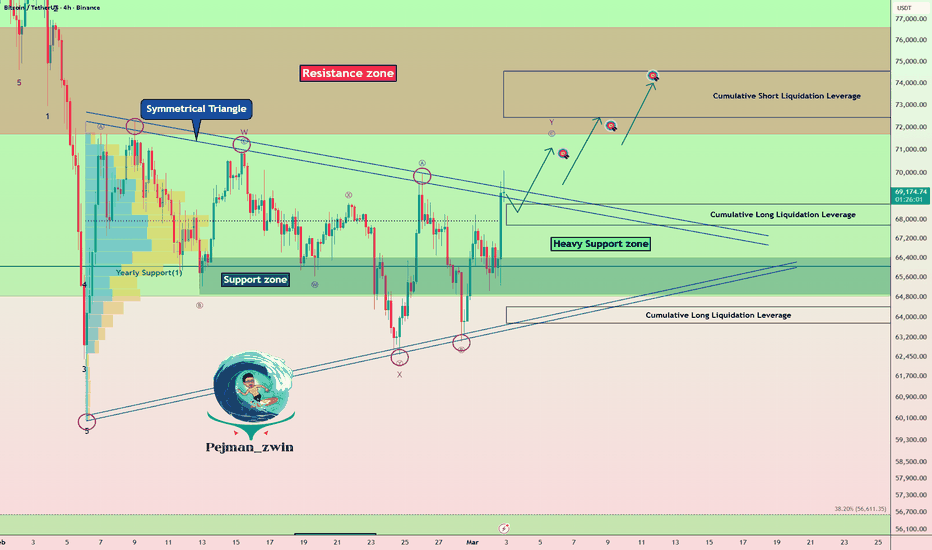
GOLD - Focus on trading range boundaries ICMARKETS:XAUUSD is entering a consolidation phase after a shake-up. The reason is anticipation of economic data and developments in the Middle East. Markets have emerged from panic mode but remain cautious amid ongoing escalation in Iran.
All eyes are on the escalating conflict in the Middle East. The parties are taking fairly tough positions, which generally complicates geopolitical uncertainty.
Trump has officially nominated Kevin Warsh to head the Fed. Warsh is considered a proponent of soft policy, which reinforces expectations of lower rates.
Trump's global tariffs (15%) may come into effect as early as this week.
Gold is supported by the escalating conflict and expectations of a soft Fed policy. Strong US economic data is holding back growth but does not negate the bullish trend. The key trigger on Friday is the NFP, which could adjust rate expectations.
Resistance levels: 5191, 5226, 5281
Support levels: 5145, 5125, 5086
Locally, the market is developing an uptrend, but there are signs of stagnation due to uncertainty. However, since the price is flat, we are prioritizing trading between the boundaries. A retest of support could trigger growth towards resistance.
Best regards, R. Linda!
Long 
 Long
Long
 Long
Long
Is Apple Rolling Over?Apple has done little for a long time, and some traders may think the tech giant is rolling over.
The first pattern on today’s chart is the weekly close of $278.78 on December 5. AAPL tried to cross above that level the following week but failed. It was revisited early last month without breaking. That may suggest resistance is in place.
Second, the 50-day simple moving average (SMA) is falling and prices have struggled to remain above it. The stock is also slipping below its 100-day SMA. Those points may reflect weakening momentum over the intermediate term.
Third, prices dropped below their 21-day exponential moving average last week and have stayed there since. That may reflect short-term bearishness.
Fourth, converging lines form a potential triangle. Could prices start moving after this period of tightening?
Next, AAPL’s last two earnings reports beat expectations. The stock briefly rallied both times, but with little follow-through. That may reflect limited enthusiasm toward the name.
Finally, AAPL is a highly active underlier in the options market. Its daily average volume of 1.1 million contracts ranks third in the S&P 500, according to TradeStation data. That could help traders take positions with calls and puts.
TradeStation has, for decades, advanced the trading industry, providing access to stocks, options and futures. If you're born to trade, we could be for you. See our Overview for more.
Past performance, whether actual or indicated by historical tests of strategies, is no guarantee of future performance or success. There is a possibility that you may sustain a loss equal to or greater than your entire investment regardless of which asset class you trade (equities, options or futures); therefore, you should not invest or risk money that you cannot afford to lose. Online trading is not suitable for all investors. View the document titled Characteristics and Risks of Standardized Options at www.TradeStation.com . Before trading any asset class, customers must read the relevant risk disclosure statements on www.TradeStation.com . System access and trade placement and execution may be delayed or fail due to market volatility and volume, quote delays, system and software errors, Internet traffic, outages and other factors.
Securities and futures trading is offered to self-directed customers by TradeStation Securities, Inc., a broker-dealer registered with the Securities and Exchange Commission and a futures commission merchant licensed with the Commodity Futures Trading Commission). TradeStation Securities is a member of the Financial Industry Regulatory Authority, the National Futures Association, and a number of exchanges.
Options trading is not suitable for all investors. Your TradeStation Securities’ account application to trade options will be considered and approved or disapproved based on all relevant factors, including your trading experience. See www.TradeStation.com . Visit www.TradeStation.com for full details on the costs and fees associated with options.
Margin trading involves risks, and it is important that you fully understand those risks before trading on margin. The Margin Disclosure Statement outlines many of those risks, including that you can lose more funds than you deposit in your margin account; your brokerage firm can force the sale of securities in your account; your brokerage firm can sell your securities without contacting you; and you are not entitled to an extension of time on a margin call. Review the Margin Disclosure Statement at www.TradeStation.com .
TradeStation Securities, Inc. and TradeStation Technologies, Inc. are each wholly owned subsidiaries of TradeStation Group, Inc., both operating, and providing products and services, under the TradeStation brand and trademark. When applying for, or purchasing, accounts, subscriptions, products and services, it is important that you know which company you will be dealing with. Visit www.TradeStation.com for further important information explaining what this means.