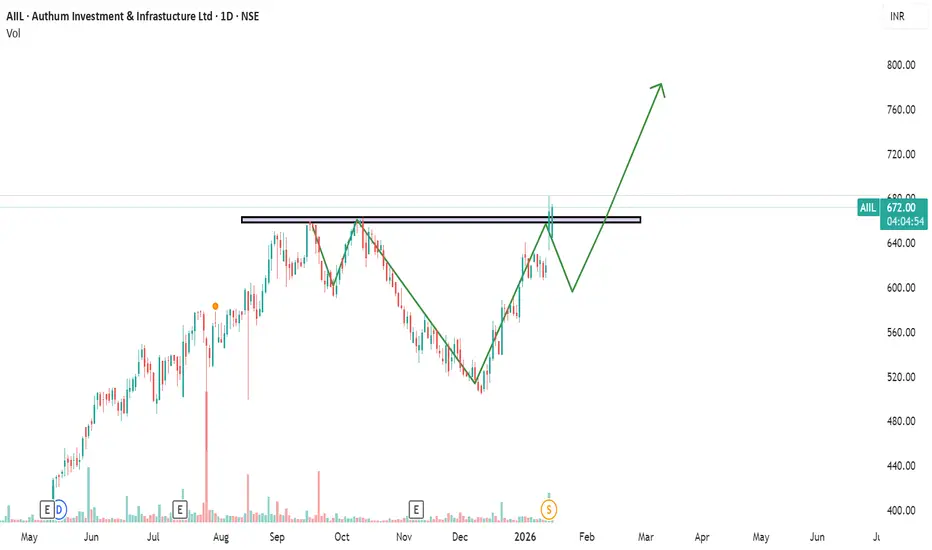
Bitcoin Is Printing a Perfect Teacup – The Handle On the H4 timeframe, Bitcoin is forming a textbook Teacup (Cup & Handle) pattern, a classic bullish continuation structure that often appears before strong expansion phases. What makes this setup high quality is not just the shape, but the context and behavior of price inside the pattern.
The cup was formed through a prolonged corrective phase, where price transitioned from aggressive selling into a rounded base. This rounding is critical: instead of a sharp V-shaped reversal, Bitcoin spent tim
W-pattern
BTC Stalls at Premium After Vertical Rally — Liquidity Below Hi Guys!! On the H1 chart, Bitcoin has just completed a strong impulsive bullish leg, breaking cleanly above the EMA 89 and accelerating straight into a clearly defined resistance zone around 95,700. This type of vertical expansion typically reflects aggressive buy-side execution, but it also leaves the market structurally imbalanced. As price reaches the resistance area, momentum noticeably slows and candles begin to compress, signaling that buyers are no longer willing to chase at premium leve
trading: pattern of the "leaders" (most important graphs)Mark Minervini said You should trade stocks, when the market leaders coincide with the indexes.
It gives you thesis to look for the patterns in the leaders.
I would go step further and say, markets sometimes "coil" into patterns? where all market just agrees on something and key dates? like when VIX goes into longterm pattern, that points to key economic data, key earnings, etc.
You can almost explain or predict whole market using single "most important graph".
You don't have to do XYZ, whe
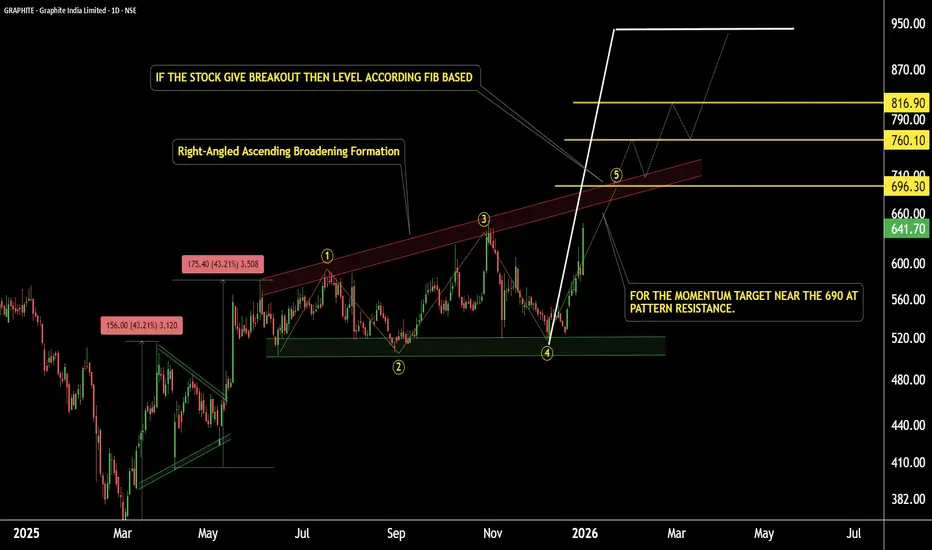
Graphite: Major Pattern Formation | Breakout or Still BuildingGraphite India – Daily Timeframe Technical View
This is the daily timeframe chart of Graphite India.
The stock has formed a Right-Angled Ascending Broadening Formation, with a strong support zone near 500–520. The broadening structure appears to have completed a five-wave formation, while the key resistance zone is placed near 690–700.
A decisive breakout above the resistance zone, preferably with volume confirmation, could trigger a strong upside move. Based on Fibonacci projections, the fin
Bitcoin Has Been Here Before. What Happens Next ??Bitcoin is starting to resemble a structure we’ve seen before.
During the 2021 cycle, price pushed higher inside a rising range, stalled near the upper boundary, and eventually rolled over. That sequence is well-documented and easy to spot in hindsight.
What’s interesting is not the outcome back then, but the shape of the move.
Right now, Bitcoin is once again trading inside a similar broad structure.
This is not a prediction.
This is not a call for a top.
Markets don’t repeat on schedule.
How Price Really Moves: 4 Entry Triggers Driven by LiquidityThis breakdown explains four recurring entry triggers that appear consistently across real market structure.
These are not indicators and not prediction tools. They are observable behaviors driven by liquidity, positioning, and trader psychology.
Each trigger is rooted in why price moves, not what price might do next.
1. Fading breakout traders (Failed Momentum / Trap Model)
When price breaks a key level and open interest jumps, breakout traders rush in expecting continuation. If price qui
Gold – Bearish Retracement Toward Structural SupportGold is currently moving inside a broad rising wedge, and today’s structure adds more clarity to the short-term direction.
A smaller pennant formation developed inside the wedge and has now been broken to the downside — a signal that momentum is shifting and the market may be preparing for a corrective drop toward the wedge’s lower boundary.
The key downside target aligns with 4113 – 4127 , which overlaps:
The lower trendline of the main rising wedge
A previous demand zone
A natur
Will the Sky clear for higher Goldprice? Week 8-12 DecContext: After a quiet week with little impact from economic data, Gold FX_IDC:XAUUSD has been moving sideways within a triangle structure. The US economy looks resilient—better than many expected—shifting all eyes to the FED rate cut decision this Wednesday. 🇺🇸👀
📅 Market Recap:
Mon Dec 1 (Asia Session): Price pumped +$60 up to $4264, only to dump -$101 back down to $4163, sweeping liquidity in the beginning of the US Session. 🧹
Consolidation: Since then, Gold has consolidated in a nar
Massive WALL STREET Short At All Time High Price is testing the all time high while a head and shoulders formation is visible on the Daily, indicating potential distribution at resistance
On H4, momentum is overbought and price has remained range bound for approximately four sessions, signaling reduced follow through on the upside
Sentiment appears fragile amid discussion of an AI driven excess, and risk appetite is moderating into strength
Harmonic confluence is present, with a deep crab on H1 and a crab on H4 aligning near current l
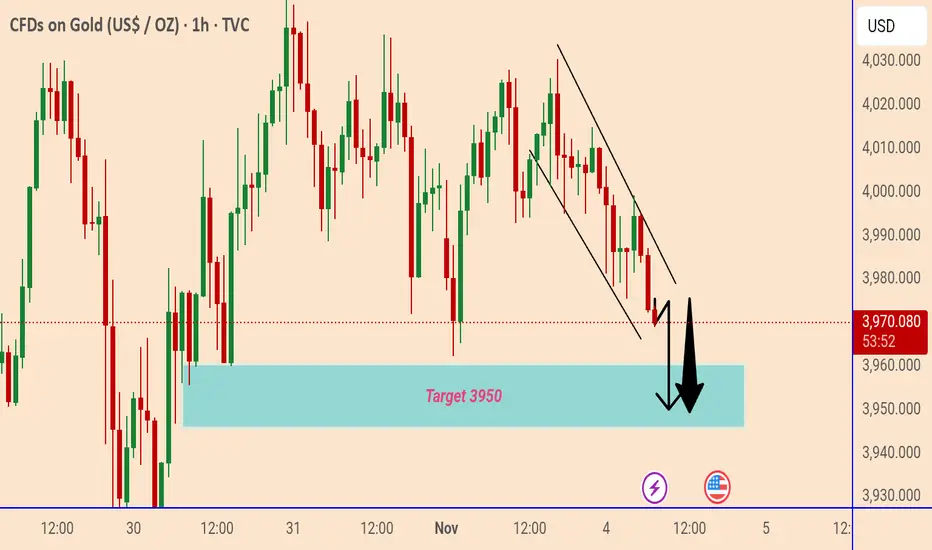
When an Uptrend Breaks..Smart Money Doesn’t Hesitate📉 XAUUSD MARKET OUTLOOK (1H)
- Gold has officially transitioned from its previous rising channel into a clear downtrend structure, marked by lower highs, lower lows, and a decisive break below the rising support line. The bullish momentum has faded, and sellers are gradually taking control.
- Price is now moving inside a descending correction channel, and every rally is being absorbed by supply — a textbook shift from accumulation to distribution.
1️⃣ Uptrend Channel Has Been Broken
Gold trade
Downfall of DXY?!? Bears Flag The Possibility!Here on TVC:DXY we can see that last week it ended in a Bearish Breakout of an Ascending Channel, the perfect Bear Flag scenario!
Now price closed the week on the ascent possibly being the Retest of the Breakout.
If the Channel holds price on a successful retest, TVC:DXY will drop!
Fundamentally, USD has impactful news all week this week. Even so, with limited data from back logged events not available until after next FOMC Meeting, this means the Federal Reserve will continue to make de
Berger Paints: Pattern Formation — Is This the BreakoutThis is the daily timeframe chart of Berger Paint.
The stock is moving within a well-defined channel and has formed a Cup & Handle pattern inside the structure.
If the pattern continues to hold and the price stays above ₹500, the pattern remains valid.
A breakout above the resistance may trigger potential upside targets of ₹766 and ₹866.
However, if the price fails and breaks below this zone, the stock may decline toward the channel support near ₹400.
Thank you.
Sun TV: Critical Levels Setting Up the Next MoveThis is the 1-hour timeframe chart of Sun TV.
The stock is forming a Descending Broadening Wedge pattern with a support zone near ₹515–525 and resistance around ₹565–575.
The trend is currently negative, but if the price breaks above the resistance zone, the stock may move toward the
pattern target near ₹620.
Thank you.
LULU Analysis | Crucial Support & Resistance Before EarningsIn this video, I break down a complete Lululemon (LULU) stock analysis ahead of its upcoming earnings.
You’ll learn the key support & resistance levels, expected volatility zones, and the technical signals that matter most.
🔍 What’s Inside the Video:
Lululemon’s current trend & momentum
Technical breakdown (chart pattern + volume + indicators)
Key support & resistance levels to watch
Earnings expectations & potential price reactions
Upside and downside targets
Risk zones and invalidation lev
SPX500 Short
Deep crab pattern completes on M15, mapping a potential reversal zone.
Multiple tops formed on M15 and M30 at the same area, reinforcing overhead supply from the prior day’s high that price could not break.
RSI reached overbought on M15 and M30, indicating crowded long positioning.
Approximately 20 points of RSI bearish divergence across M15 and M30, consistent with a weakening advance.
H4 has turned down after last week’s rebound and now aligns with a downside continuation view.
Daily slo
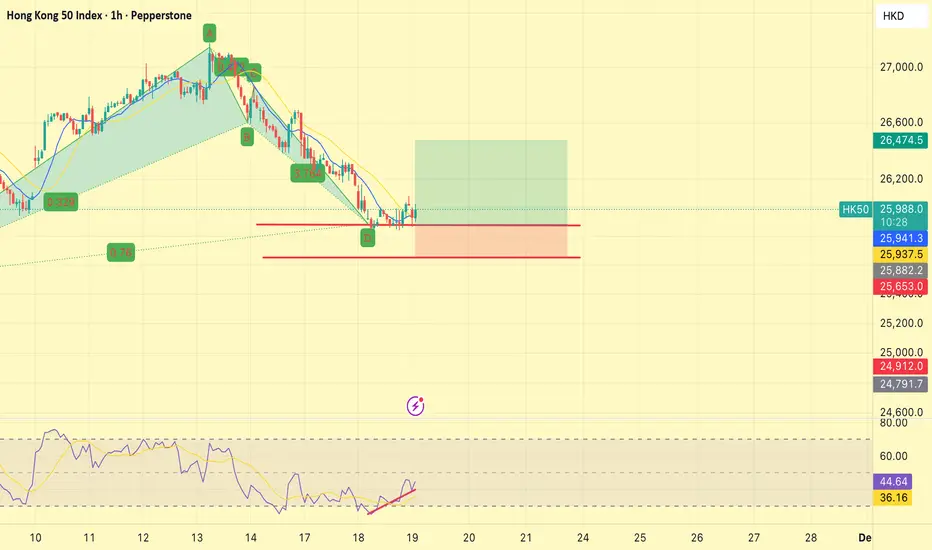
HK50 Long Setup at 25,875Crab pattern completes on M30 and H1, marking a potential reversal zone near current price.
Triple bottom visible on M30 and H1, reinforcing a well defined support shelf.
RSI is rising as the triple bottom forms, which supports the idea of accumulation rather than a weak bounce.
Daily trend remains up, so a rebound aligns with the higher time frame bias.
Timeframes up to H4 are oversold, which suggests short term selling pressure is stretched and vulnerable to mean reversion.
Stay alert to
EURJPY Forms Rare Reversal, Aiming For Price Gap??OANDA:EURJPY has formed a rare Reversal Pattern, the Three Drives Pattern, lets break it down!
The Three Drives Pattern consists of 3 Bullish attempts to continue pushing price higher. The 3rd attempt is a Fibonacci Extension of the DE Leg giving us Point F where Price, encountering Resistance at the 138.2% Extension @ 180.008, should reverse and head lower!
We can see starting the week that OANDA:EURJPY is opening below this level and if Price is unable to move higher, we can expect it to
Short Alphabet (GOOGL) near 290Head and shoulders is visible on H4 and on the Daily. I will look for a firm break and retest of the neckline to confirm a momentum shift.
An ABCD harmonic completed around 288, which marks a potential reversal zone based on measured move symmetry.
RSI shows a 40-point divergence on H1 and H4, from 82 down to 42. This indicates buyers are losing pressure while sellers gain control.
RSI is stretched across multiple intraday timeframes, consistent with mean reversion risk.
The primary Daily tr
JPN225 Long• Trend context: This setup aligns with the H4 uptrend, supported by a strong upward impulse.
• Momentum: M15, M30, and H1 are oversold, suggesting a potential rebound from current levels.
• Structure: A clear double bottom has formed on both M15 and M30, with RSI divergence of 9 points confirming bullish momentum.
• Support zone: Price is holding above strong support at the previous week’s high, a key level that continues to attract buyers.
• Pattern signal: A bullish shark pattern is forming,