Long
Long
 Long
Long
 Short
Short
INOX India: Cryogenic King Breaking Out!Bullish Drivers for Stock price gains:
Infrastructure Super-Cycle:
As a leader in cryogenic equipment, INOX is the primary beneficiary of India’s massive push toward Green Hydrogen and LNG adoption.
Massive Breakout:
The daily chart shows a clean exit from a long-term Consolidation phase, signalling the start of a new impulsive leg upward.
Technical Targets: The setup suggests strong upside momentum with immediate targets at ₹1,264 (T1), ₹1,388 (T2), and an ambitious long-term target of ₹1,788 (T3).
Clean Risk/Reward: With a solid support base established around the ₹1,100–₹1,150 zone, the risk-to-reward ratio for this swing trade is exceptionally attractive for medium-to-long-term portfolios.  Long
Long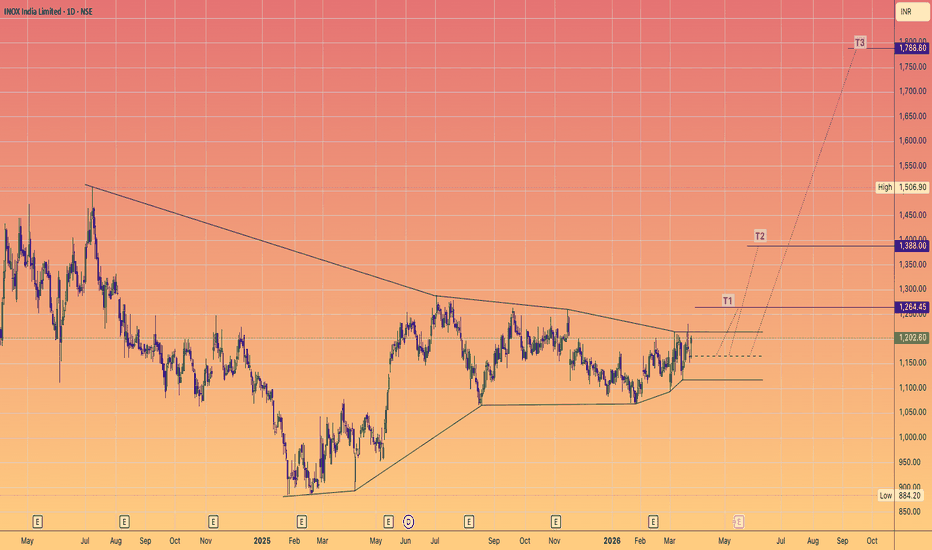
EURUSD: Rejection at Key Resistance Zone, Eyes 1.15100 SupportHello everyone, here is my breakdown of the current EURUSD setup.
Market Analysis
EURUSD previously traded inside a narrowing wedge structure after reversing from local highs. Following a sharp bearish breakout below the wedge support line, price accelerated lower and broke through major horizontal zones, confirming strong seller dominance.
Currently, EURUSD is trading between the 1.15800 resistance zone and the 1.15100 support zone. After printing a brief breakout below the support area, price formed a local recovery structure back up to retest the overhead resistance, where it is now facing a bearish rejection.
My Scenario & Strategy
As long as EURUSD remains below the 1.15800 resistance zone and continues to reject this horizontal ceiling, the bearish short scenario remains valid. A continuation lower should push price back toward the 1.15100 support zone (TP1).
However, if EURUSD breaks above the 1.15800 resistance zone, the bearish outlook would weaken and a stronger upward correction could follow.
That’s the setup I’m tracking. Thank you for your attention, and always manage your risk.  Short
Short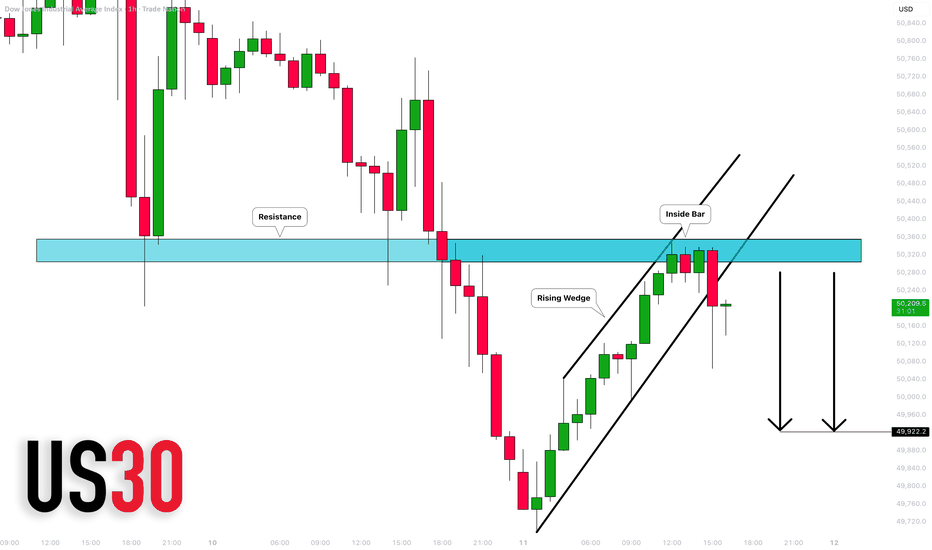
MESM June 11: Liquidity sweep at 7248, but bears in controlMESM analysis for Thursday, June 11
MESM swept liquidity around 7248 and bounced, leaving a wick on the downside. Even with that reaction, I still respect the broader bearish structure for today.
On the 4H chart, the key level for me is 7400. As long as price stays below that level, I remain cautious and still lean bearish. If we get a 4H close above 7400, then the bearish pressure weakens. If we get a 4H close above 7490, then I think the tone may need to shift from bearish to neutral.
On the 1H chart, there is a fair value gap / cluster zone inside the green highlighted area. That is the main reaction zone I’m watching today. If price pushes into that zone and gets rejected, then I think sellers may step back in.
On the 15M chart, the structure remains aligned with the 1H view. If price rejects the green zone, then I’m watching the overnight low around 7233 as the downside target.
Key levels
7248 = liquidity sweep
7400 = key bearish threshold
7490 = larger invalidation / tone-shift level
7233 = overnight low / downside target
Green zone = fair value gap / reaction area
Plan for today
Respect bearish structure while price stays below 7400
Watch for retest into the green zone
If rejection appears, watch for downside toward 7233
Reassess if price starts closing above 7400
Shift tone more seriously if 7490 is reclaimed on 4H
Not financial advice. No confirmation, no trade. CME_MINI:MESM2026  Short
Short
Short 
MESM June 10: Bearish below neckline, gap retest possibleMESM analysis for Wednesday, June 10
MESM already broke the neckline, and that keeps the broader structure bearish for me. Price is trading around 7326, and I think the market may still have downside pressure unless buyers can reclaim key levels.
On the 4H chart, I’m watching the fair value gap inside the green zone as a possible bounce area. Price may retest that zone before deciding whether to continue lower.
The key bearish invalidation level for me is 7492. If we get a 4H close above yesterday’s high, then I think the tone may shift from bearish back to bullish.
On the downside, I’m watching 7247 as the first key downside target, with 7200 as a broader bearish objective later this week if weakness continues.
On the 1H chart, the fair value gap / cluster zone starts around 7406, which makes that a major reaction level for today.
On the 15M chart, I’m still watching 7400 as the key reclaim area and 7247 as the key downside target.
Key levels
7400 / 7406 = reclaim area / gap reaction zone
7247 = downside target / yesterday low
7492 = bearish invalidation on 4H
7200 = broader downside objective
Green zone = fair value gap retest area
Plan for today
Respect bearish structure after neckline break
Watch for bounce into the gap first
If price reclaims 7400–7406, watch for continuation into the green zone
If price stays weak, watch 7247 next
If 4H closes above 7492, reassess bearish bias
Not financial advice. No confirmation, no trade. CME_MINI:MESM2026 Short 
Long 
DPRO: When Canadian drones storm the Pentagon and EuropeDraganfly builds unmanned systems for militaries, border forces and first responders. Its platforms are involved in programs of the US, Canadian and Swedish armies, and the May contract with DEVCOM for a counter‑drone system locks the company into a priority defense direction. The company trades on Nasdaq, and everyone who understands that the global shift to mass‑produced reconnaissance drones gives a small manufacturer a chance to grow into a global military supplier is watching.
Fundamentals
The first quarter of 2026 brought record revenue of 2.31 million dollars, a 49 percent increase. Gross margin came in at 15 percent due to an unfavorable sales mix and one‑time inventory write‑offs. The net loss widened to 5.63 million dollars, with a loss per share of 0.18 dollars. The balance sheet holds 147 million dollars in cash after a February offering at 7 dollars per share.
Key events: on May 20, Draganfly and F4 Defense were selected by the DEVCOM Army Research Laboratory to develop a modular counter‑unmanned aircraft system. In March, the company and Palladyne AI completed the integration of SwarmOS, validating autonomous swarm capabilities. In Sweden, drones have been deployed for search‑and‑rescue operations using Smith Myers ARTEMIS mobile phone detection and geolocation. The company supplies Flex FPV drones for US Air Force Special Operations Command training and became the exclusive integrator and distributor of the Blitz EO/IR payload for the Americas.
Risks
The operating gap between revenue and loss requires either rapid scaling or further equity raises. Insiders have been selling shares with no purchases. Dilution remains a real threat.
Technicals
On the three‑day chart, price broke out of a descending wedge and completed a retest, forming the buy zone at the confluence of the 0.786 Fibonacci level, the fair value gap, and the 100‑day moving average. Yesterday‘s close was 5.98 dollars. Volume is many times above multi‑month averages. ADX and MACD give a buy signal, and the 100‑day and 200‑day moving averages have formed a golden cross.
First target is 10.62 dollars, second target is 14.40 dollars.
The market values Draganfly as a speculative bet on military rearmament and the shift to mass‑produced drones. Losses and dilution remain risks, but the growing defense portfolio and technical breakout create an asymmetric setup.  Long
Long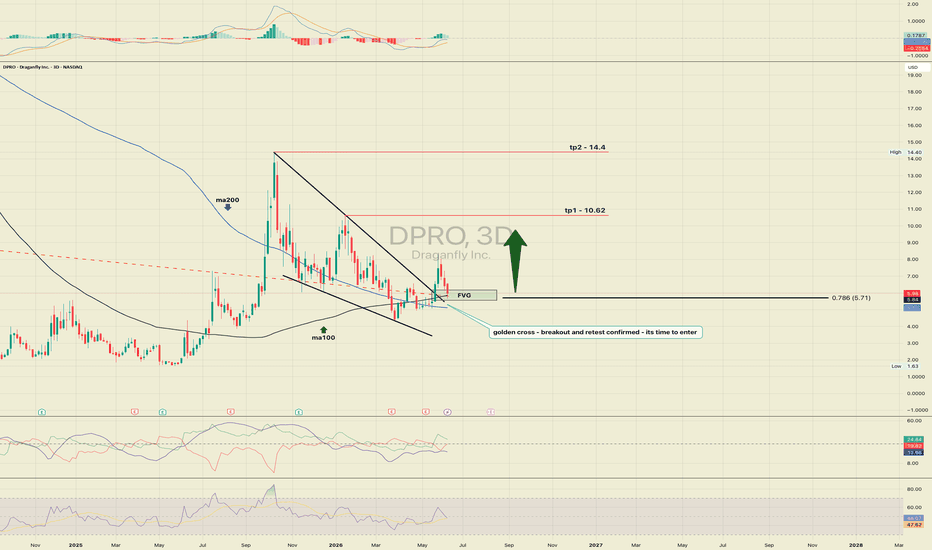
Short 
Why Is HYPE Demand Suddenly Accelerating?Hyperliquid is gaining strong attention as liquidity expands across crypto derivatives markets. Traders now track momentum more closely as btc usd volatility continues shaping overall sentiment. In this environment, HYPE coin is becoming more relevant as buyback activity strengthens ecosystem confidence. Many investors now view HYPE coin as a direct reflection of platform performance.
The rise in activity signals deeper engagement across trading pairs and perpetual markets. This shift positions Hyperliquid as more than a niche DeFi protocol. The consistent movement in btc usd also influences how traders position around HYPE coin exposure. As volatility rises, participation increases across leveraged products and trading strategies. This keeps both btc usd and HYPE coin tightly connected in market behavior.
Why Buybacks Are Drawing Heavy Market Attention
Hyperliquid is reportedly handling a large share of crypto buybacks in 2025, which changes how investors view DeFi revenue models. The growing influence of HYPE coin reflects how buybacks reduce circulating supply and build scarcity. This creates stronger support conditions during high-demand phases. Traders often compare this structure to corporate buybacks in traditional equity markets.
The broader btc usd environment also plays a major role in this cycle. When volatility increases, derivatives trading activity rises sharply. That surge directly supports higher fee generation and stronger buyback capacity. This mechanism continues to strengthen HYPE coin demand across market cycles. As trading intensity increases, buyback pressure becomes more visible and more impactful.
Hyperliquid Revenue And The Strength Behind Buybacks
Hyperliquid revenue growth now sits at the core of its expansion story. Higher trading activity generates stronger fee income, which directly supports buyback programs. This makes HYPE coin closely tied to real usage rather than speculation alone. Investors increasingly track revenue as a leading indicator of token strength.
The rising importance of btc usd trading also fuels platform activity. As traders react to volatility, they engage more with perpetual contracts and liquidity pools. This increases trading depth and strengthens ecosystem efficiency. In turn, HYPE coin benefits from consistent engagement and stronger demand cycles.
The buyback system creates a reinforcing loop between usage and value. Higher activity leads to higher revenue, which supports stronger buybacks. This reduces supply pressure on HYPE coin over time. Meanwhile, btc usd volatility ensures that trading demand remains active across different market conditions.
Why GETTEX:HYPE Is Becoming A Cycle-Focused Token
GETTEX:HYPE is now positioned at the center of Hyperliquid’s economic structure. Its performance depends heavily on HYPE coin buybacks and platform revenue growth. This creates strong alignment between user activity and token value. Many traders now treat it as a cycle-sensitive asset with strong momentum characteristics.
The influence of btc usd remains critical in this structure. Large price swings often trigger liquidity shifts across derivatives markets. This increases trading participation and improves fee generation for the platform. As a result, HYPE coin benefits indirectly from macro volatility cycles.
What Traders Are Watching Next
Market participants are now focused on whether Hyperliquid can maintain its buyback dominance. Continued revenue growth remains essential for long-term HYPE coin strength. If trading activity continues rising, buybacks may expand further across future cycles. This could reinforce stronger demand for HYPE coin over time.
Volatility in btc usd will also remain a key driver of platform activity. Higher volatility usually increases trading volume and boosts fee generation. This directly supports stronger ecosystem fundamentals for HYPE coin. Traders are therefore watching both metrics closely for directional signals. MESM June 9: Bounce watch 7473, then 7533MESM analysis for Tuesday, June 9
MESM is still trying to bounce after last week’s sell-off, and for me today is another station-by-station session.
On the 4H chart, I’m watching 7473 as the first upside target. If bulls can reclaim and hold that level, then the next upside target for me is 7533. If momentum keeps building after that, then 7611 becomes the next bigger upside level to watch.
On the downside, 7386 is the key support level for me. If price starts closing below that level, then I think the downside opens back up toward 7355.
On the 1H chart, the structure remains similar to the 4H. I still want to see price hold 7386 if bulls want to stay in control.
On the 15M chart, the same levels remain in play:
7473 = first upside station
7533 = second upside station
7611 = larger breakout level
7386 = must-hold support
7355 = downside liquidity
Plan for today
Stay patient and trade it level by level
Watch 7473 first
If bulls stay strong, watch 7533 next
If momentum expands, watch 7611
If price loses 7386, watch for downside toward 7355
Not financial advice. No confirmation, no trade. CME_MINI:MESM2026 Long