Can weaker US data help AUDUSD break 0.7070?AUDUSD: RBA support meets weaker US data
AUDUSD is trading near 0.7060 after holding above the SMA 200 and building a short-term recovery structure.
The pair is supported by expectations that the RBA may keep a cautious stance, because Australian inflation pressure is not fully gone. This keeps the Aussie supported on pullbacks.
📰 News:
US data came in weaker than expected.
ADP Employment Change: 44K vs 75K expected
ISM Services PMI: 54.1 vs 54.5 expected
Australia Trade Balance: August 6,
Wedge
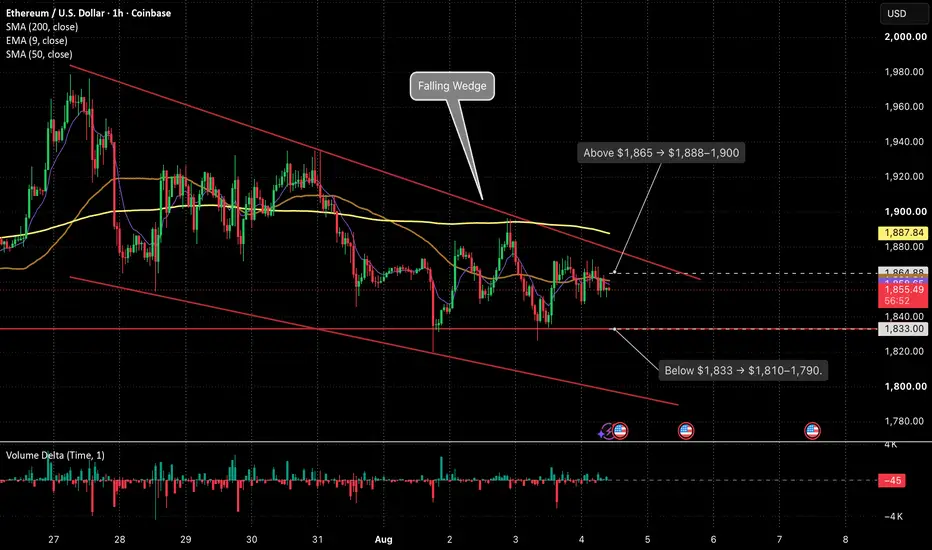
Can Ethereum escape the $1,800–1,900 range today?Can Ethereum escape the $1,800–1,900 range today?
▫️ ETH trades near $1,854, below the EMA 9 at $1,859 and SMA 200 at $1,888. Volume and momentum remain weak.
▫️ Lower oil prices have temporarily eased inflation concerns, but U.S.–Iran negotiations remain unconfirmed. Traders are waiting for action rather than diplomatic promises.
▫️ Prediction-market traders see a 98% probability of ETH remaining above $1,800 by noon ET, but only a 3% probability of it exceeding $1,900. Expectations remain
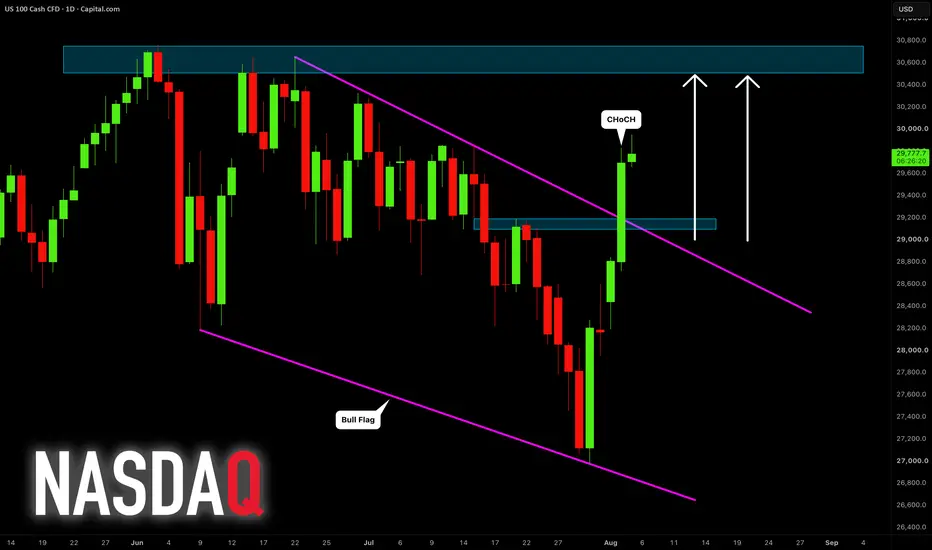
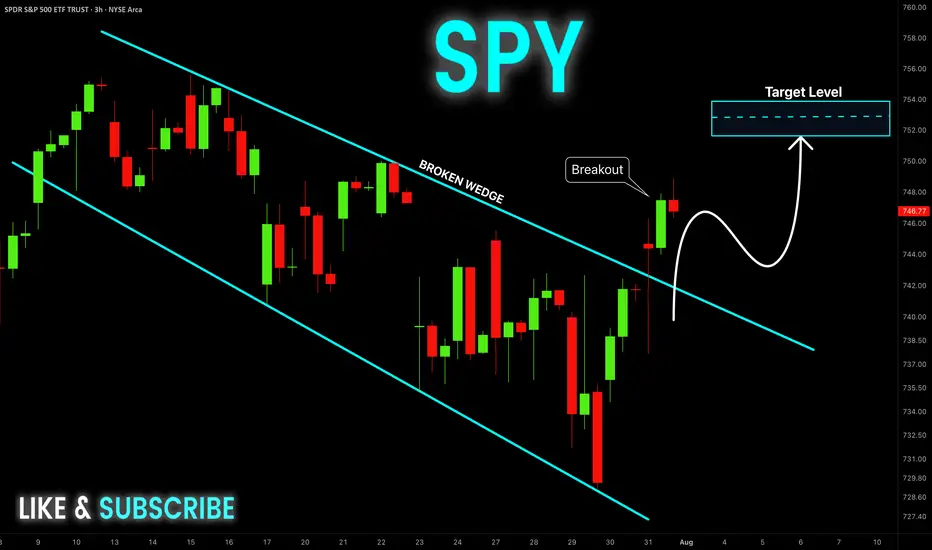
NASDAQ INDEX (US100): Correction is Over
Nasdaq Index completed a corrective movement within a bullish flag pattern,
breaking and closing above its resistance line.
As an extra confirmation, I spotted a valid bullish change of character CHoCH.
We can expect a bullish continuation toward the resistance based on the current ATH.
Goal - 30500.
Look for entries after a pullback.
❤️Please, support my work with like, thank you!❤️
MESU Aug 5: Break 7800 or Pull Back to 7760?MESU has made a strong push higher and is now trading just below 7,800.
The broader intraday structure remains bullish, but several fair value gaps and imbalances remain open beneath the current price. Because of that, I am watching for a possible pullback before another continuation attempt.
A confirmed 15-minute close above 7,800 would support continuation toward the first upside target around 7,820.
If price closes below 7,780, I will watch for a deeper retracement toward the fair value ga
BTC: Trend Reversal Loading!!!Beautiful Technical setups, all confirming the bullish reversal signs.
Falling Wedge bottom
Confluence by a trendline support
Daily Bullish RSI divergence at the same location
Watch for the breakout to reach an old resistance line, which was acting as neckline for HnS pattern.
Enjoy the ride!
Keep accumulating during the side ways move
XAUUSD Long: Rebounds From Demand, Eyes 4,090$ Supply ZoneHello traders! Here’s my technical outlook based on the current XAUUSD (1H) chart structure. XAUUSD recently rebounded from the 4,030 Demand Zone and continues to respect the rising demand line, showing that buyers remain active. However, price is still trading below the 4,090 Supply Zone and the descending supply line.
Currently, XAUUSD is holding above the 4,030 Demand Zone while approaching the 4,090 Supply Zone. The latest bounce suggests buyers may attempt another move higher.
As long as
AUDJPY: Confirmed Bearish Continuation 🇦🇺🇯🇵
This morning I took a short trade on AUDJPY pair.
The price broke and close below a support line of a rising wedge pattern
after a test of a strong daily resistance.
I expect a retracement to 110.85 level.
❤️Please, support my work with like, thank you!❤️
I am part of Trade Nation's Influencer program and receive a monthly fee for using their TradingView charts in my analysis.
WTI: How to read a Falling WedgeWTI: How to read a Falling Wedge
A falling wedge is a pattern where price moves lower, but the range becomes tighter over time.
It usually shows that sellers are still in control, but their pressure may be weakening. Each new low is lower than the previous one, yet price starts compressing instead of accelerating lower.
On this WTI 4H chart, oil is still trading inside a falling wedge after a sharp decline from the previous highs. Price is now testing the lower side of the pattern, which mak
USDJPY: Potential Bearish Continuation 🇺🇸🇯🇵
USDJPY may retrace more after a test of a strong intraday/daily resistance.
A breakout of the support line of a rising wedge pattern on an hourly time frame
confirms the strength of the sellers.
Goal - 157.15
❤️Please, support my work with like, thank you!❤️
I am part of Trade Nation's Influencer program and receive a monthly fee for using their TradingView charts in my analysis.
XAUUSD Short: Resistance Holds — 4,000$ Support in FocusHello traders! Here’s my technical outlook based on the current XAUUSD (4H) chart structure. XAUUSD remains bearish inside a broad descending channel after breaking below the 4,110 Supply Zone. Price continues to respect the channel resistance, keeping sellers in control.
Currently, XAUUSD is trading above the 4,000 Demand Zone while remaining below the 4,110 Supply Zone and channel resistance.
As long as XAUUSD stays below 4,110 and respects the descending channel, the bearish scenario remain
CLX - Bottom Reversal and Wedge Breakout Setup💡 Swing setup idea
Wedge breakout
🔎 Analysis summary:
The price may have reached a bottom and has started to make higher lows. We can also see the price closing a wedge pattern, which makes this setup worth watching.
👀 Levels to watch:
Entry trigger: Break above $100.45
Target: $115.45
Stop: Under the breakout level
💬 What do you think about this setup? Let me know in the comments! 👇
Good luck!
⚠️ Note: This is for educational purposes only and is not financial advice.
Siemens India: Pure-Play Physical AI While software-based Generative AI gets most of the headlines, Physical AI—where AI systems interface with hardware, robotics, edge computing, and industrial digital twins—is where real-world productivity explodes.
Siemens Limited stands as one of the purest structural plays for this macro trend on the NSE.
From a technical perspective, the weekly chart on Siemens demonstrates a classic stair-step consolidation pattern:
Base-Building & Multi-Month Range: The stock spent months digesting its p
LINKUSDT BULLS ARE WALKING INTO A TRAP?Yello Paradisers! Are LINKUSDT bulls about to get trapped before the market makes another aggressive move to the downside?
💎LINKUSDT is currently rejecting from a key daily resistance zone while confirming a bearish Change of Character and Break of Structure on the 4-hour timeframe. More importantly, the weekly, daily, and 4-hour timeframes are all aligned bearishly, significantly increasing the probability of further downside.
💎On the 4-hour chart, the price first swept the range high, taking
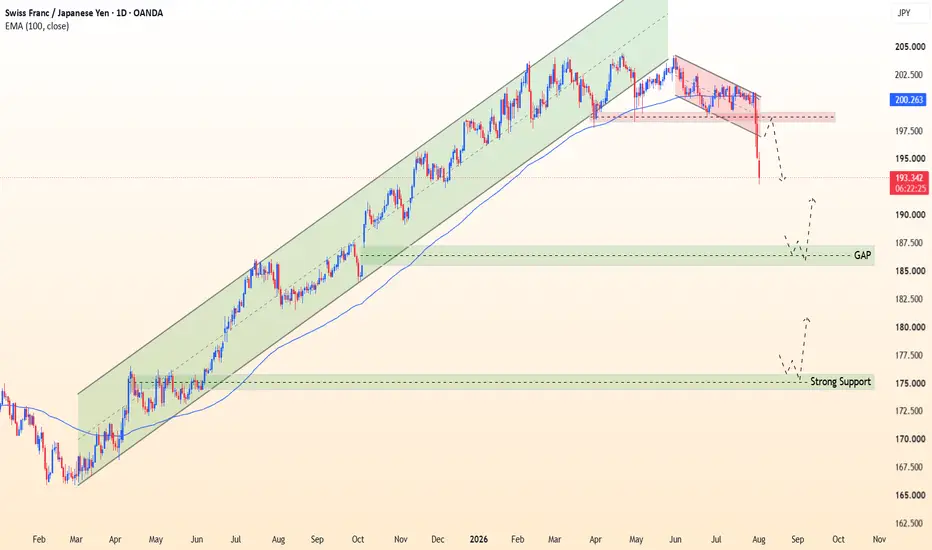
CHF/JPY Comprehensive Analysis: Major Structure Shift 📉 CHF/JPY Comprehensive Breakdown: Structural Shift & Long-Term Roadmap
Executive Market Context
The CHF/JPY (Daily) chart reflects a decisive technical shift following the breakdown from its long-term ascending channel. The violent daily displacement confirms a transition from a multi-month bullish run into a deeper corrective cycle.
___________________________
Technical Confluence & Catalysts
Market Structure Shift (MSS): The daily candle closed decisively below macro channel support, invali
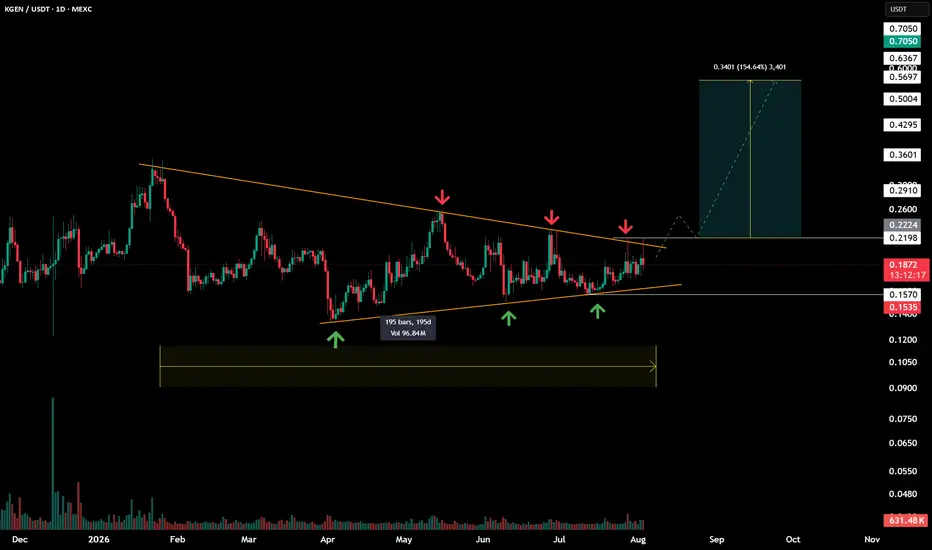
KGEN ' Symmetrical / Falling Wedge '195-Day Wedge Compression: Big Breakout Loading?
Overview
Price has been consolidating inside a massive Symmetrical / Falling Wedge pattern for the past 195 days. We are now approaching the apex of this compression, where a major directional move typically unfolds.
Technical Breakdown
Strong Confluence: The upper resistance (red arrows) and lower support (green arrows) have been tested multiple times over the last six months, validating this market structure.
Key Support Zone: The $0.1535 – $0
CORN 1H: Deep Liquidity Sweep & Support Reclaim (Long Setup)1. Market Context
On the 1H chart, Corn crashed through the ascending trendline after triggering multiple "Buyer Lose" liquidations. Price is currently dropping sharply toward the major bottom support floor between 439.86 and 427.37. We wait for the deep sweep into this support zone before entering long.
2. Casino / House Trap Analysis
• The Panic Sell Trap: The House broke the trendline to flush out early buyers ("Buyer Lose") and trick retail traders into opening late short positions at low p
WHEAT 1H: Late Seller Trap & Support Reclaim (Long Setup)1. Market Context
On the 1H chart, Wheat has completed a full manipulation cycle. After sweeping top liquidity at 695.0 ("Liquidity Sweep") and wiping out early sellers, the price crashed hard to trap weak buyers. The market is now approaching the major support floor around 627.3 (purple box), setting up a high-probability long bounce.
2. Casino / House Trap Analysis
• The Liquidity Sweep Trap: The House previously engineered a fake pump to 695.0 ("Liquidity Sweep") to trigger seller stop-losse
OUST:The Market Cycle in Action:Markdown → Accumulation → MarkupOUST is a textbook example of how the Market Cycle unfolds.
📉 1. Markdown
The first phase was a prolonged decline where sellers remained in control. Lower highs and lower lows defined the trend until downside momentum gradually faded.
📦 2. Accumulation
Instead of immediately reversing, price spent nearly three years moving sideways inside a low-volatility range.
🔹 Notice how volume remained relatively muted throughout this phase.
💡 This is where patient buyers quietly accumulate positions
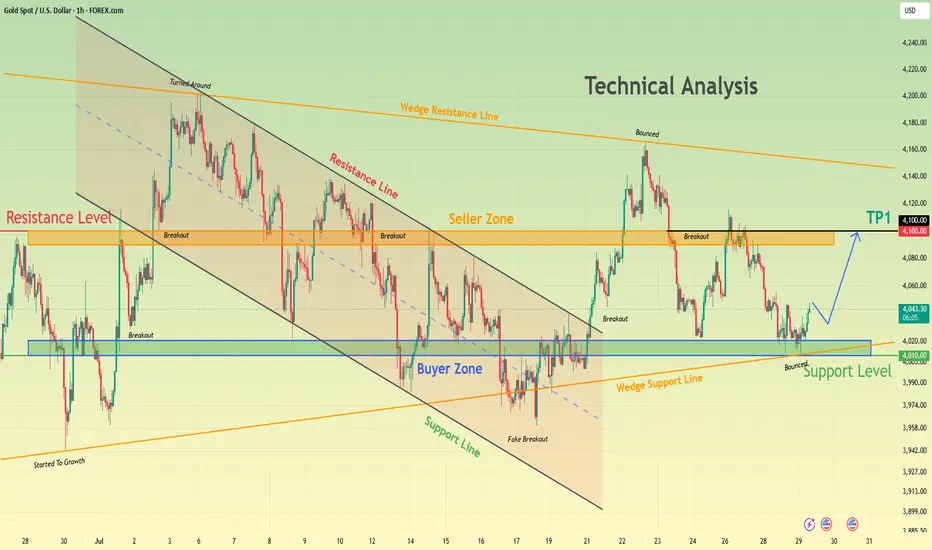
Gold Rebounds From Wedge Support With 4,100 Resistance in FocusHello traders! Here’s my technical outlook based on the current XAUUSD (1H) chart structure. XAUUSD previously traded inside a descending channel before breaking above resistance, signaling a shift in short-term momentum. After the breakout, price entered a broad recovery but is still trading inside a larger rising wedge, where the 4,100 Seller Zone continues to cap upside attempts. Currently, XAUUSD is holding above the 4,010 Buyer Zone and the wedge support line while remaining below the 4,100