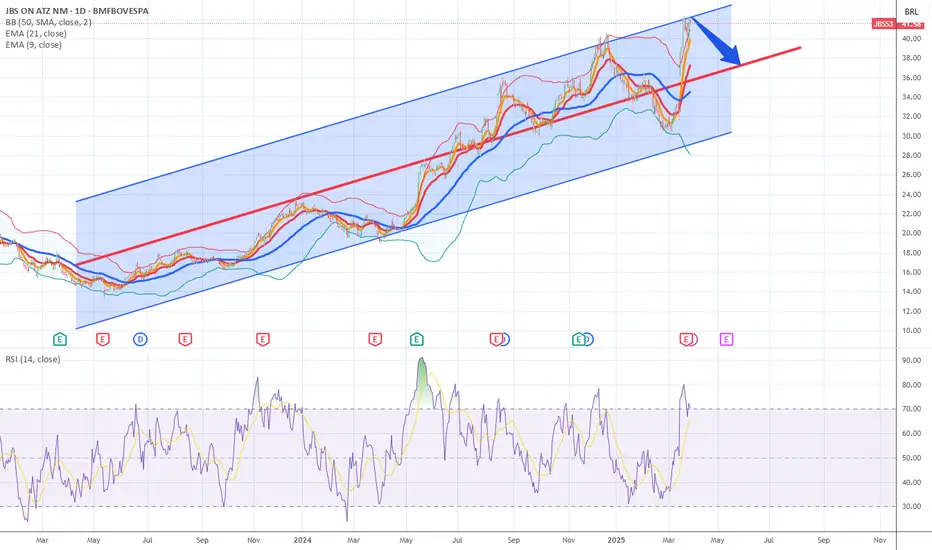
Long
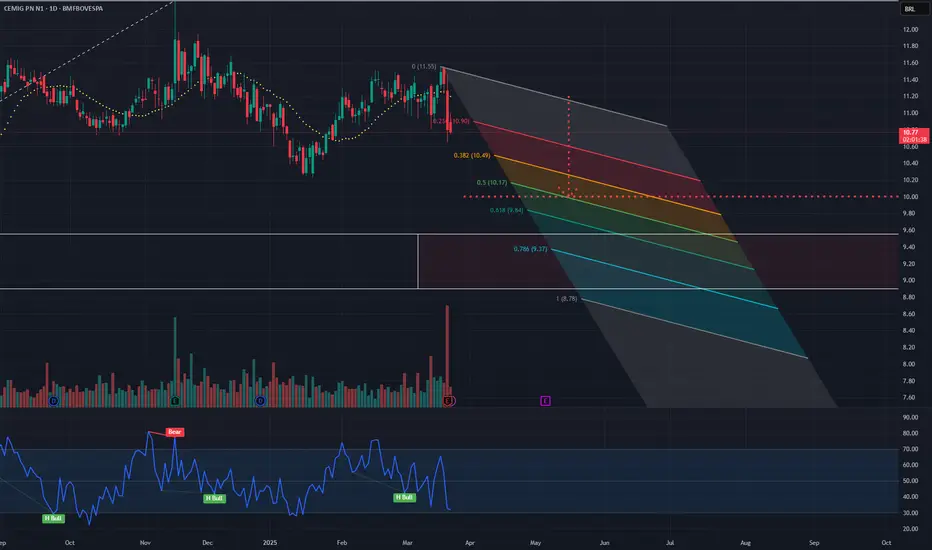
Long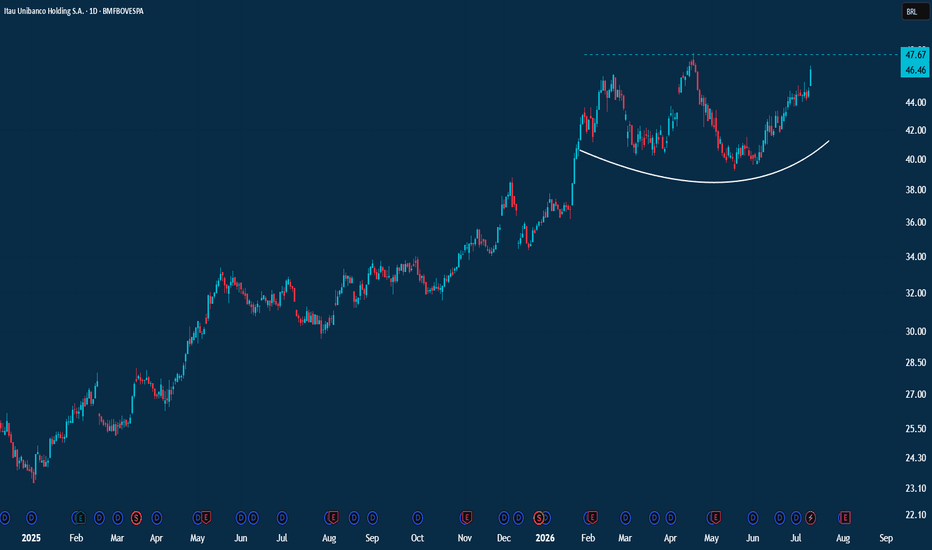
 Long
Long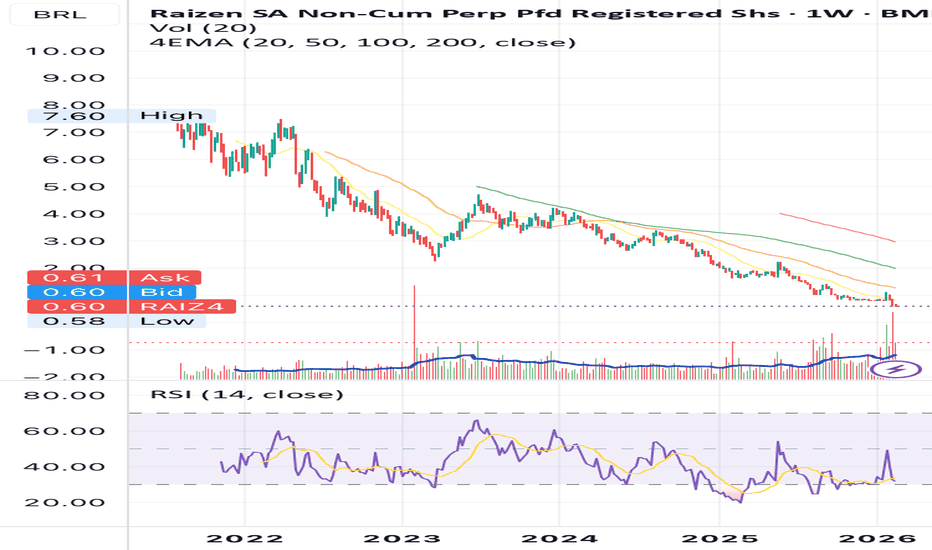
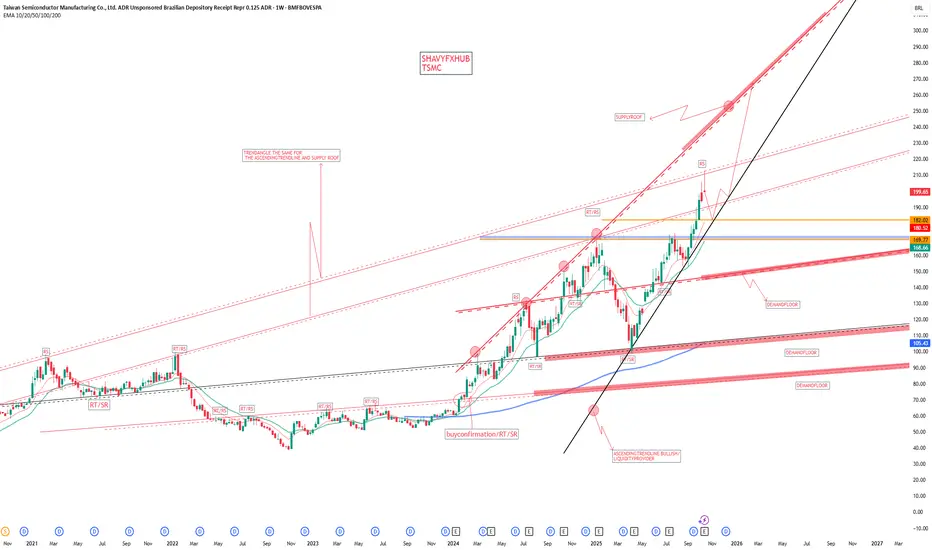
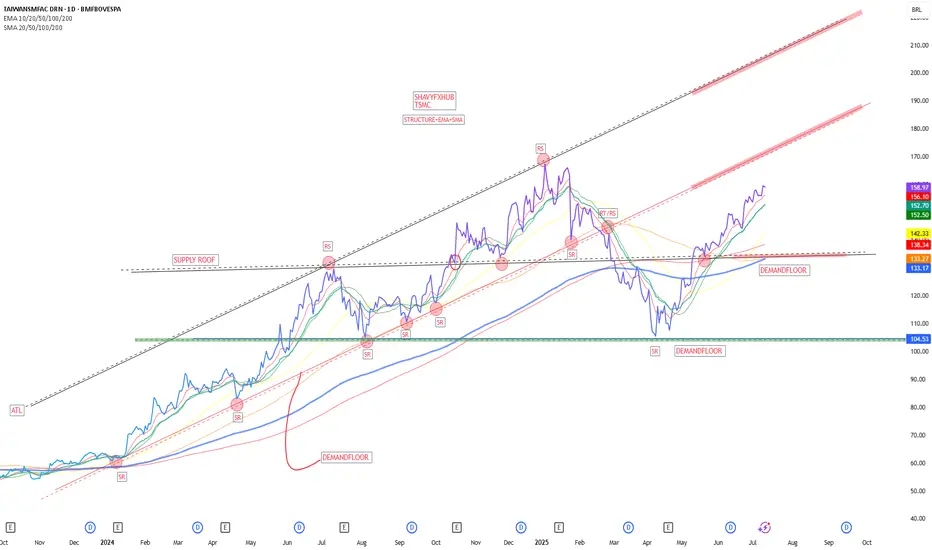
TSMCTSMC is the world's largest semiconductor foundry, headquartered in Taiwan. It leads the global advanced chip manufacturing market, producing cutting-edge chips for diverse applications such as AI, mobile, automotive, and consumer electronics.
Major Shareholders of TSMC (2025)
Shareholder Ownership %
National Development Fund of The Executive Yuan 6.377%
GIC Pte Ltd. (Singapore Sovereign Wealth Fund) 3.149%
Labor Pension Fund Supervisory Committee 1.314%
Fubon Life Insurance Co., Ltd. 0.653%
Fidelity Management & Research Co. LLC 1.184%
Capital Research & Management Co. (World Investors) 0.615%
JPMorgan Investment Management, Inc. 0.548%
Fisher Asset Management LLC 0.341%
State Street Global Advisors Ltd. 0.165%
Nordea Investment Management AB 0.075%
The Taiwanese government through its National Development Fund remains the largest shareholder, reflecting TSMC’s strategic importance to Taiwan’s economy and technology sector.
Recent Developments
TSMC continues to expand its manufacturing capacity globally, notably with a large fabs manufacturing advanced chips near Phoenix, Arizona.
The company raised its 2025 revenue outlook by 30+% fueled by soaring demand for AI chips and advanced semiconductors.
TSMC’s role as a critical supplier to major technology firms like NVIDIA and Apple underscores its market dominance.
Taiwan Semiconductor Manufacturing Company (TSMC) has made substantial investments in the United States, focusing primarily on expanding its manufacturing capacity and advancing semiconductor production technology.
Key Points on TSMC’s US Investments (2025):
Investment Size: TSMC has committed approximately $165 billion to build and expand semiconductor manufacturing facilities in the US. This investment includes funding for multiple chip fabrication plants (fabs), advanced packaging, and research & development centers.
Arizona Megafab Cluster: The company is developing a major "megafab cluster" in Arizona, consisting of multiple wafer fabs. The first Arizona fab began commercial production in 2024, with plans to construct three additional fabs, two IC assembly plants, and a large R&D facility as part of a $100 billion extension over the coming years.
Technology: TSMC plans to deploy sophisticated process technologies such as 2-nanometer node production in its US plants, expected to complement its leading-edge manufacturing in Taiwan.
Strategic Motivation: These investments align with U.S. government goals to reduce dependency on Asian semiconductor supply chains for national security reasons and foster domestic high-tech manufacturing.
Market Demand: High demand for chips used in smartphones, AI, and high-performance computing drives the urgency and scale of TSMC’s US expansion.
Summary:
TSMC is accelerating its US manufacturing footprint significantly by investing $165 billion, primarily in Arizona, to produce cutting-edge chips locally. This expansion enhances US semiconductor self-sufficiency, supports high demand in AI and mobile markets, and reduces geopolitical risks related to regional supply chain concentratio
TSMC holds a dominant position as the premier semiconductor foundry globally, backed by a stable mix of government, institutional, and investment fund shareholders, driving innovation and growth through expansive manufacturing and R&D.
#STOCKS #TSMC  Long
Long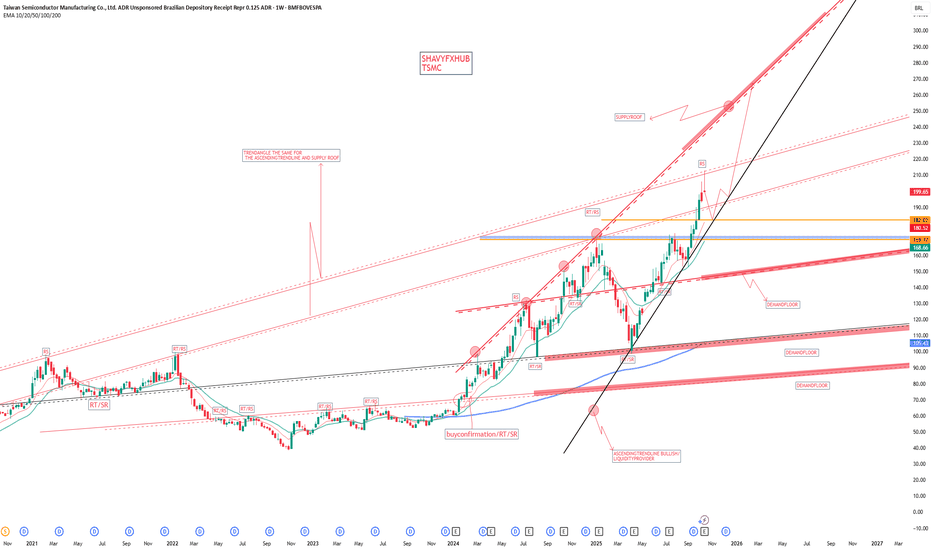
 Short
Short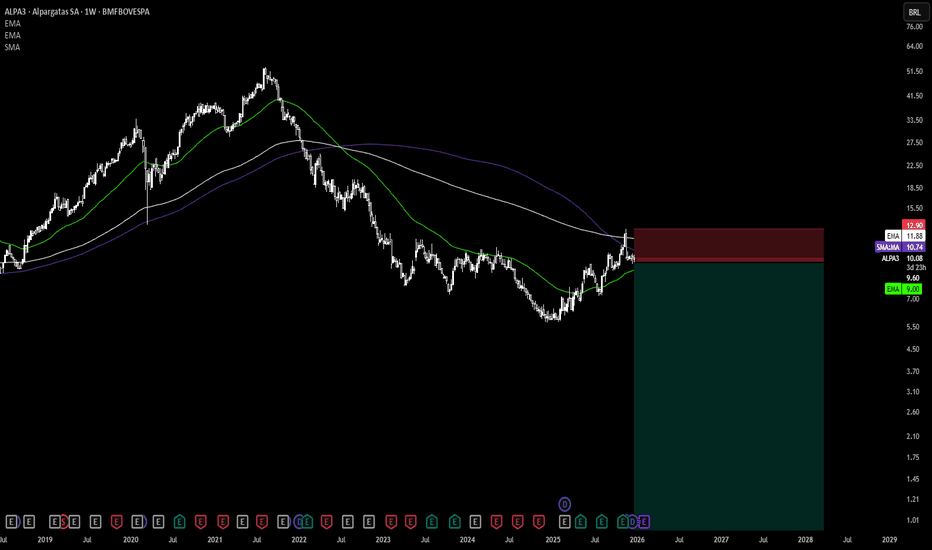
 Long
Long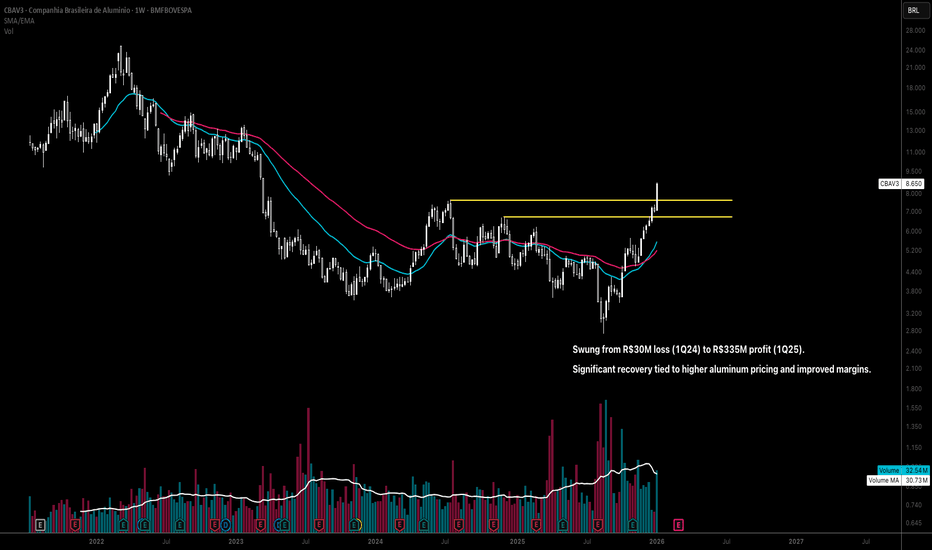
 Long
Long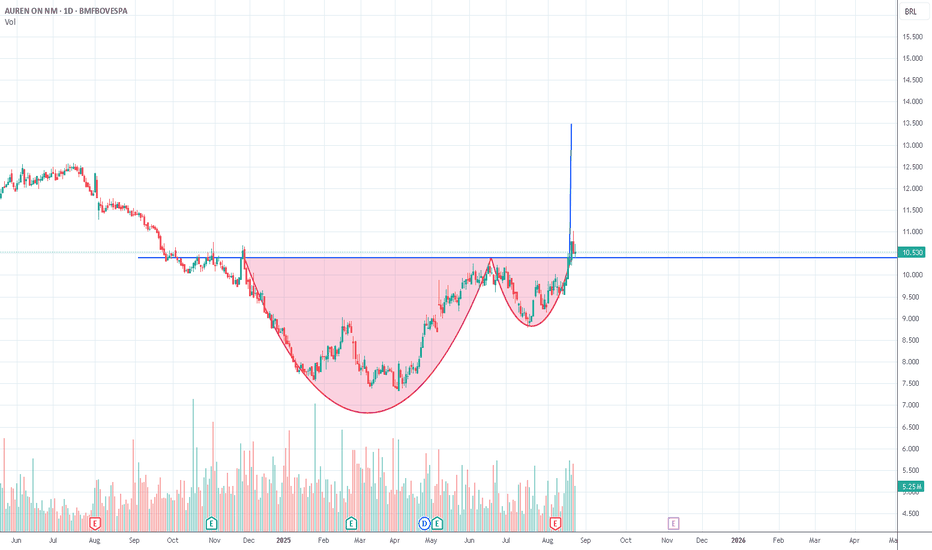
 Long
Long
Pair Trade Strategy with Options Spreads - FLRY3 and ECOR3Date: July 23, 2025 (based on closing data from 07/22 and intraday data from 07/23/2025)
Operation Horizon: Short-Term (ideally, to be closed before ECOR3's earnings report on 07/30/2025).
1. General Financial Market Overview:
To begin, it's crucial to understand the broader market environment in which we are operating.
Bullish Stock Market (IBOVESPA): The main Brazilian stock market index, IBOVESPA, stands at 135,656.64 points, registering a 1.62% gain for the day. This rise is not isolated; major companies like VALE3, ITUB4, ABEV3, BBDC4, and SANB11 are also in positive territory. This indicates a generally optimistic market sentiment at this moment.
Declining Volatility (VIX): The VIX, often called the "fear index" or a measure of implied volatility (the market's expectation for future price swings) for the US market, is at 15.4, with a 6.61% drop. A decline in the VIX generally suggests that uncertainty is decreasing and that the market anticipates less abrupt movements. For strategies involving "selling volatility" (like the credit spreads I intend to set up), a falling VIX is a favorable sign, as it means options might become "cheaper," or the premium received from selling them has a better chance of being retained.
Crucial Events (Earnings Reports): Keep an eye on the calendar! Ecorodovias (ECOR3) is scheduled to release its earnings report on July 30, 2025, and Fleury (FLRY3) on August 7, 2025. These events are volatility catalysts. This means that on the day of the release, stock prices can experience significant gaps (sudden jumps or drops). My short-term strategy of 6 days is smart, as it aims to close the ECOR3 operation before this risk materializes.
2. Individual Asset Analysis (ECOR3 and FLRY3)
2.1. Ecorodovias (ECOR3)
Current Price: R$ 6.79
Technical Analysis:
Dominant Trend: The hourly chart for ECOR3 shows a strong and clear downtrend that has been developing since early July.
Moving Averages: Both the price bars and the 8 and 20-period Simple Moving Averages (SMAs) are consistently red. This indicates that current prices are below the short-term averages, and the averages are sloping downwards. The SMAs (8 and 20 periods) are acting as "dynamic resistances," meaning the price attempts to rise but finds difficulty as it approaches these lines.
200-Period SMA (Long-Term): The 200-period SMA (cyan line) is well above the current price, reinforcing the long-term downtrend.
Stop ATR (Risk Management): The Stop ATR line (a tool that the "Junior Schewinsky Setup" indicator uses to suggest a dynamic stop point based on volatility) is positioned above the current price. This confirms the bearish view, as the Stop ATR, in this case, functions as a resistance and an exit point for those who are long, or a reversal point for those seeking selling opportunities.
Volatility Analysis (Options): The Implied Volatility (IV) for ECOR3 options is around 50.97%. This is considered extremely high, indicating that the market expects large future price movements for ECOR3. This high IV is a key point for my strategy of selling spreads.
2.2. Fleury (FLRY3)
Current Price: R$ 14.44.
Technical Analysis:
Recent Event: On July 21, FLRY3 experienced a sharp and significant price increase. This was driven by merger news, a "fundamental catalyst" that altered the perception of the asset's value.
Post-News: Since this surge, FLRY3's price has been lateralizing (consolidating) at elevated levels, around R$ 14.40.
Moving Averages: Although the 8 and 20-period SMAs are still green (indicating an uptrend), they are losing their slope and converging. This suggests that the strength of the short-term uptrend has diminished, and the asset is in a state of balance between buyers and sellers.
Stop ATR: The Stop ATR line is below the current price, acting as a dynamic support and indicating that the recent uptrend is still holding, despite the lateralization.
Volatility Analysis (Options):
FLRY3 options have Implied Volatility (IV) of 36.75% for FLRYH170 and 20.41% for FLRYH155. The FLRYT120 put option has an IV of 51.87%. The difference in IV between calls and puts and between strikes (the "volatility skew") is important and can be an opportunity. IVs are generally high for puts, and a bit lower for more distant calls.
3. Statistical Analysis: The FLRY3/ECOR3 Ratio (Pair Trade)
The Concept: "Pair Trade" is a strategy that aims to profit from the relative performance difference between two assets that have historically moved in a correlated fashion. The idea is that if the ratio between their prices deviates significantly from its average, it tends to "revert" back to the mean.
The Current Ratio: The chart of the FLRY3/ECOR3 ratio shows it is currently at 2.14.
Opportunity Identification: We observe that the ratio has reached the lower Bollinger Band on the daily chart. Statistically, this is a strong indication that the ratio is "oversold."
Expectation (Mean Reversion): When an asset (or a ratio of assets) reaches the lower Bollinger Band, the expectation is that it will tend to revert to its mean, meaning the FLRY3/ECOR3 ratio is expected to rise again.
Implication of a Rising Ratio: For the FLRY3/ECOR3 ratio to rise, one of the following scenarios (or a combination) could occur:
Ideal Scenarios: FLRY3 rises while ECOR3 falls, or FLRY3 rises more than ECOR3, or FLRY3 falls less than ECOR3, or even FLRY3 remains stable while ECOR3 falls.
4. The Proposed Options Strategy:
My strategy involves setting up two options credit spreads.
4.1. In ECOR3: Bear Call Spread (Credit Spread)
Objective: To profit from the decline or sideways movement of ECOR3 while time passes.
How it Works: I will Sell an OTM Call (ECORH720) with a strike of R$ 7.20 (premium R$ 0.18) and Buy a further OTM Call (ECORH800) with a strike of R$ 8.00 (premium R$ 0.04).
Net Credit Received: R$ 0.18 (Sell) - R$ 0.04 (Buy) = R$ 0.14 per unit.
Maximum Profit: R$ 0.14 per unit (occurs if ECOR3 closes below R$ 7.20 at expiration).
Maximum Loss: (Long Strike - Short Strike) - Net Credit Received = (8.00−7.20)−0.14=R 0.80 - R$ 0.14 = R$ 0.66 per unit. (occurs if ECOR3 closes above R$ 8.00 at expiration).
Break-Even Point: Short Call Strike + Net Credit Received = R$ 7.20 + R$ 0.14 = R$ 7.34. Above this value, I start incurring losses.
Alignment with Analysis: This leg of the strategy is very well aligned with the downtrend we observe in ECOR3 and with the idea that ECOR3's decline would contribute to the rise of the FLRY3/ECOR3 ratio.
4.2. In FLRY3: Bear Call Spread (Credit Spread)
Objective: To profit from the decline or sideways movement of FLRY3 (specifically, if it stays below R$ 15.53).
How it Works: I will Sell Call FLRYH155 (Strike R$ 15.53, last offer price R$ 0.21) and Buy Call FLRYH170 (Strike R$ 17.03, last offer price R$ 0.03).
Net Credit Received: R$ 0.21 (Sell) - R$ 0.03 (Buy) = R$ 0.18 per unit.
Maximum Profit: R$ 0.18 per unit (occurs if FLRY3 closes below R$ 15.53 at expiration).
Maximum Loss: (Long Strike - Short Strike) - Net Credit Received = (17.03−15.53)−0.18=R 1.50 - R$ 0.18 = R$ 1.32 per unit. (occurs if FLRY3 closes above R$ 17.03 at expiration).
Break-Even Point: Short Call Strike + Net Credit Received = R$ 15.53 + R$ 0.18 = R$ 15.71. Above this value, I start incurring losses.
Alignment with Analysis: This leg of the strategy profits if FLRY3 stays below R$ 15.53 or falls. This is not the ideal scenario for the FLRY3/ECOR3 ratio to rise, which would typically expect FLRY3 to perform strongly. If FLRY3 does rise significantly and breaks above R$ 17.03, this leg could incur a substantial loss or offset gains from the ECOR3 leg.
Combined Strategy Net Credit/Debit:
Net Credit Received from ECOR3 Spread: R$ 0.14
Net Credit Received from FLRY3 Spread: R$ 0.18
Net Result of the Combined Operation (before brokerage): R$ 0.14 (received) + R$ 0.18 (received) = I RECEIVE R$ 0.32 per pair of units when I open the trade.
Total Brokerage Cost: R$ 18.00. This is an additional cost that will reduce my net profit.
5. The Role of Greeks (Theta and Vega) in this Strategy
"Greeks" are measures that help me understand how the price of an option or an options strategy reacts to different market factors.
Theta (Time Decay):
ECOR3 (Bear Call Spread): Theta is positive for selling spreads. This means that with each passing day, if ECOR3's price remains within my profit range (falling or consolidating below R$ 7.20), my position gains value. Time is "working in my favor".
FLRY3 (Bear Call Spread): Theta is positive for selling credit spreads. This means that with each passing day, if FLRY3's price remains below R$ 15.53, my position gains value. Time is "working in my favor" on this leg as well.
Combined Impact: Both legs of my strategy now have positive Theta, which is very favorable. This means time decay is "working in my favor" on both ends, contributing to the operation's profit as time passes, provided the asset prices remain within the spreads' profit ranges.
Vega (Sensitivity to Implied Volatility):
ECOR3 (Bear Call Spread): Vega is negative for selling spreads. This means that if the Implied Volatility (IV) of ECOR3 options decreases, the value of my position increases (I profit).
FLRY3 (Bear Call Spread): Vega is negative for selling credit spreads. This means that if the Implied Volatility (IV) of FLRY3 options decreases, the value of my position increases (I profit).
Combined Impact: Both legs of the strategy now have negative Vega. This is highly favorable in a declining VIX environment, as I benefit doubly from the reduction in implied volatility in the options market.
6. Risks and Management
Cost of the Operation: I'm receiving a net credit of R$ 0.32 per pair of units, but I also have a flat R$ 18.00 brokerage cost. This needs to be factored into the overall profitability. This means I don't need favorable asset movement to turn a profit.
Earnings Events (ECOR3: 07/30): Earnings reports are times of high uncertainty. They can cause huge gaps that can lead me to maximum loss very quickly.
Action: I'm strongly considering unwinding this operation (closing the position) on the last trading day before ECOR3's earnings report (July 29, 2025). This eliminates the gap risk.
Hedge: Since both assets are correlated to Ibovespa Index, I've use their Bheta to estimate a 1:1.25 ratio in the assets needed to be as close as possible to delta zero.
7. Final Conclusion:
"This pair trade strategy, utilizing a Bear Call Spread on ECOR3 (betting on a decline/sideways movement) and a Bear Call Spread (sold) on FLRY3 (betting on sideways movement/decline below R$ 15.53), aims to capitalize on positive time decay (Theta) and decreasing implied volatility (negative Vega) in both assets . Although the statistical analysis of the FLRY3/ECOR3 ratio suggests a relative rise in FLRY3, my setup on FLRY3 benefits more from stability or a decline in that asset, that's the reason I've choose strikes far from the price.
Strengths: Both legs are credit spreads, generating an initial premium receipt. Both benefit from positive Theta (time decay working in my favor) and negative Vega (decreasing volatility working in my favor). The declining VIX environment is favorable.
Weaknesses: There's a potential misalignment between the directional thesis of the FLRY3/ECOR3 ratio (which suggests FLRY3 rising) and the sold FLRY3 leg (which profits from FLRY3's stability/decline), that's the reason I've choose strikes far from the price.
Most Critical Point: The proximity of ECOR3's earnings report on 07/30/2025 is the primary risk. I will be closing the operation before this event to avoid gaps.  Long
Long
TSMCThe Taiwan Semiconductor Manufacturing Company Limited (TSMC) is the world’s largest and most advanced semiconductor foundry, headquartered in Hsinchu Science Park, Taiwan. Founded in 1987 by Morris Chang, TSMC pioneered the pure-play foundry model, focusing exclusively on manufacturing chips designed by other companies, enabling fabless semiconductor firms like NVIDIA, AMD, and MediaTek to thrive.
Key Facts about TSMC (July 2025):
Market Position:
The dominant global semiconductor contract manufacturer, with a market capitalization exceeding $1.19 trillion (over $1 trillion USD), making it one of the most valuable tech companies worldwide.
Technology Leadership:
TSMC leads in advanced process technologies, producing chips at cutting-edge nodes including 3nm and moving toward sub-2nm by 2028. It was the first to commercialize extreme ultraviolet lithography (EUV) at scale.
Recent Growth:
In Q1 2025, TSMC reported a remarkable 42% year-over-year revenue increase, driven by surging demand for AI server chips, smartphones, and stockpiling ahead of US tariffs. Revenue for Q1 2025 was around NT$839 billion (~$25.5 billion USD).
Expansion Plans:
TSMC is aggressively expanding capacity with nine new facilities planned in 2025, including eight fabs and one packaging plant across Taiwan and overseas locations such as the US, Germany, and Japan. Fab 25 in Taichung is set to begin construction by year-end 2025, supporting the company’s roadmap toward sub-2nm chip production by 2028.
Global Importance:
TSMC is central to the global semiconductor supply chain, producing chips used in high-performance computing, smartphones, automotive electronics, AI applications, and more. It plays a strategic role amid US-China trade tensions and global tech competition.
Leadership:
The CEO is C. C. Wei, who has overseen TSMC’s continued technological innovation and expansion.
TSMC remains a cornerstone of the global semiconductor industry, driving innovation and capacity expansion to meet the growing demand for advanced chips powering AI, 5G, automotive, and consumer electronics worldwide.
#AI #STOCKS Long 
 Long
Long
 Long
Long
 Long
Long
 Long
Long
 Long
Long
 Short
Short
J

J
Long