Adyen (ADYEN) – Technical Analysis and 1W OutlookTechnical Analysis
Adyen's stock is forming a symmetrical triangle, indicating a potential breakout. The recent price surge confirmed the pattern's breakout, but a correction toward the 0.618 Fibonacci level (1457.2 EUR) is possible, acting as a key buying zone.
Key Levels:
Resistance: 1720.8 EUR (0.5 Fibonacci), 2311 EUR (0.236 Fibonacci)
Support: 1457.2 EUR (0.618 Fibonacci), 1081.8 EUR (0.786 Fibonacci)
Target: 2838 EUR
Indicators suggest a potential continuation of the uptrend:
MACD
Atos Reverse Stock Split – Another Round of Price Manipulation?Atos Confirms Bullish Continuation, Invalidating Consolidation and Bearish Retest
Atos has officially invalidated neutral consolidation and a bearish retest, choosing a bullish continuation as it currently trades at $0.0046.
Atos Needs a Pullback to $0.0028–$0.0034 After 84% Surge
Following a massive 84% rally from $0.0030 to $0.0055, Atos now requires a technical pullback to retest and confirm support.
Target Pullback Zone: $0.0028–$0.0034
A retracement into this range would provide a health
Long on MICHELIN (EURONEXT)EURONEXT:ML will close two of it's factories in France, which means less expenses and more profits.
The stock is oversold on RSI, broke mulitple support levels and has now stopped on a major support level. Bearish the next few days/weeks as many "low profile" investors will sell their shares, the oversold state and the major support level should give the right signals for high level investors to go bullish.
NN GROUP ($NN) Q4—INSURANCE CASH SHINES IN EUROPENN GROUP ( EURONEXT:NN ) Q4—INSURANCE CASH SHINES IN EUROPE
(1/9)
Good evening, TradingView! NN Group ( EURONEXT:NN ) is humming—H2 revenue hit $ 7.94B, topping estimates 📈🔥. Q4 earnings and a cash boost spark buzz—let’s unpack this Dutch dynamo! 🚀
(2/9) – REVENUE RUSH
• H2 Haul: $ 7.94B—beats $ 7.41B est. 💥
• Full ‘24: $ 12.36B—up 12% from $ 11.03B 📊
• OCG: $ 1.9B—hits ‘25 goal early
EURONEXT:NN ’s cash flow’s sizzling—steady wins!
(3/9) – BIG MOVES
• Buyback: $ 300M—shares get a lift
HAL NV: Unlocking Hidden Value in a Discounted InvestmentCurrent Price: Approximately €117.40 per share
Target Price: €150 per share
HAL NV (traded via HAL Trust) has long been recognized as a unique investment vehicle, thanks to its diversified portfolio of high-quality assets. Despite a current trading level around €117.40, a closer look at the underlying holdings and operational performance reveals a significant value gap—one that suggests the stock should be priced nearer to €150.
Key Holdings and Their Strengths
Boskalis – A Fully Owned
Atos : Post-Split Recovery and Key Market ScenariosFollowing the massive share split (13,497 new shares for every 24 old shares), Atos experienced a significant price drop from $1 to $0.0024. The stock reached its lowest point at $0.0015 on December 17, marking a critical bottom.
From January 9 to February 11, Atos entered a consolidation phase, ranging between $0.0024 and $0.0019, indicating a period of accumulation. However, on February 18, the price broke above its post-split all-time high, reaching $0.0035, with an intraday high of $0.0039.
Why Hermès’ margins shame the competitionThis analysis is provided by Eden Bradfeld at BlackBull Research—sign up for their Substack to receive the latest market insights straight to your inbox.
You know my favourite stocks are luxury stocks, and they’ve had a hard last year. Richemont and Moncler were the clear standouts from the most recent season (both grew sales), while Brunello did well too. Obviously, Kering did not do well. Here’s Hermes, which pretty much smashed everyone out of the park:
Revenue amounted to €15.2 billi
Randstad: A Value Caution in a Shifting LandscapeRandstad NV (AEX: RAND) currently trades around €41.55 with a market cap of approximately €7.62 billion. While many investors may be drawn to its strong dividend history and solid reputation in staffing, a closer look at the fundamentals and macroeconomic outlook suggests that the market may be overestimating its near‐term growth prospects.
Declining Profitability
A review of Randstad’s recent financials is cause for caution. The company’s net income has shown a marked deterioration over rec
Livestock and Poultry Sector On February 3, 2025The global livestock and poultry sector is grappling with challenges due to escalating feed costs and supply constraints. Key commodities such as corn ACTIVTRADES:CORNH2025 and soybeans CBOT:ZS1! , which constitute a major portion of animal feed, have seen substantial price increases driven by adverse weather conditions, reduced crop yields, and heightened demand for biofuels. These factors are putting pressure on producers, particularly in the U.S., where red meat and poultry production is e
Alfen longAlfen, a Dutch company with a lot of potential. When it crashed 90% it got my attention again. It is back to where it was in 2018/2019. Although the price falls, the RSI rises. I also see a price cap on the daily timeframe, approximately between 21-32 euros. I wouldn't be surprised if Alfen starts to skyrocket now.
I keep graphs, but more on a macro level (timeframes of decades). I noticed this by chance and it seems interesting, also because I think that car charging stations and energy stora
ASML HOLDING N.V - BUY APPROVEDASML Buy Recommendation is Certified.
1. The major trendline since 2009 has been tested and remains solid.
2. The Fibonacci retracement is currently at the 0.618 level, the ultimate prime level.
3. The Fibonacci extension consistently proves accurate.
4. The presidential election year is historically the best time to invest, plus the stock is currently discounted.
5. ASML holds a global monopoly in EUV (Extreme Ultraviolet) lithography technology.
6. Earnings have consistently been excelle
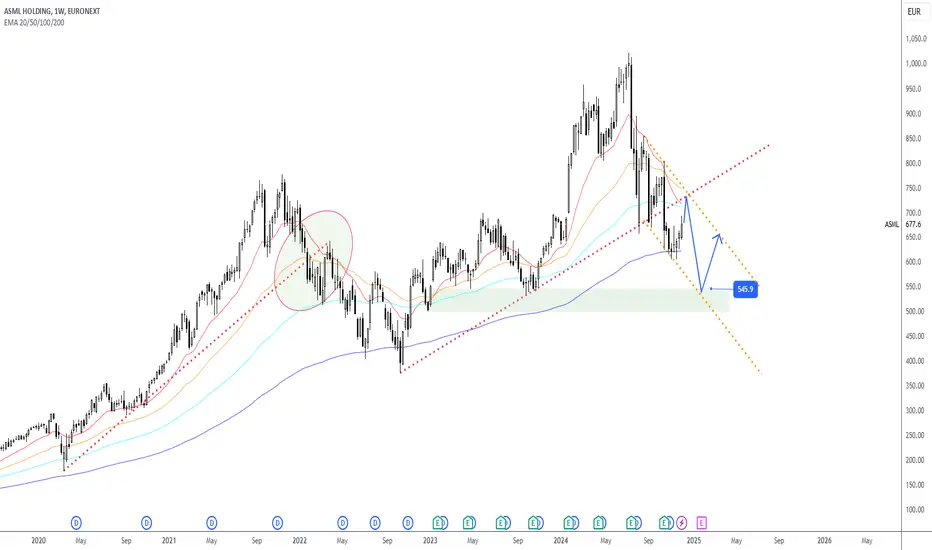
ASML - Downtrend & Push backTREND
According to the current wave structure, it is in the downtrend.
Characteristically, it is used to create pull and push backs after support/resistance breakout.
So we can expect similar behavior now.
It has not formed a channel yet, but a probable channel can be estimated as on the chart.
Moving Averages
The current price is under 100-day (Turquoise) (so supports downtrend)
50-day (Orange) will most likely cross 100-day (Turquoise) from up to down (powerful indicator supporting downtre