Is Sanofi Undervalue by 22% ?I wanted to share an analysis I've conducted on Sanofi over the past five years using both comparable methods and a 2-Stage DCF approach. According to my findings, the market value appears to be at least 22% undervalued in comparison with its fair value. Moreover, considering the post-COVID effects on pharmaceutical companies, I believe Sanofi presents a compelling opportunity to purchase its stock with potentially lower risk.
I would be glad to share my detailed analysis for any one interested
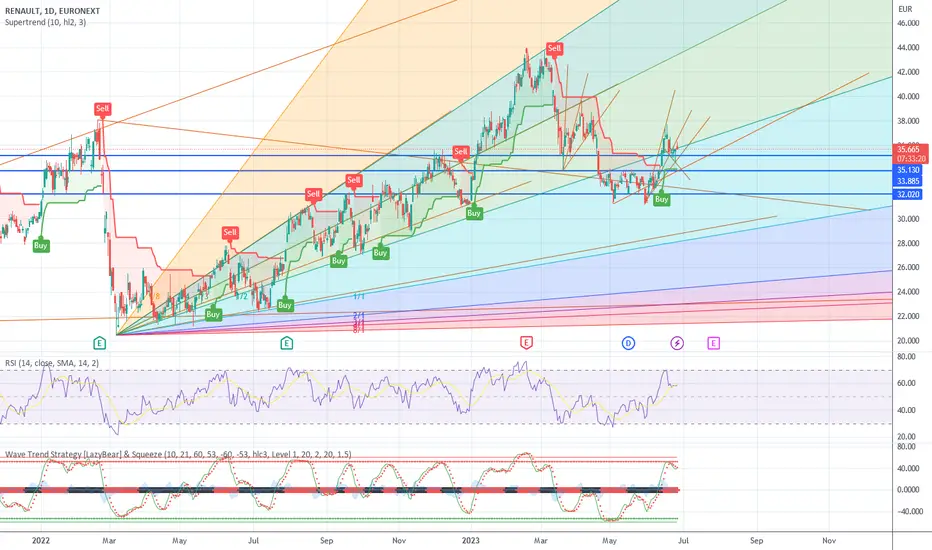
Renault - waiting for a signal Action - Renault is quite difficult to play. They play HH and LL. You need to look at the upper and lower limits of the channel. You can see that they are using the fibo fan. It seems to me that they will go back to the price - EUR 32, and then it may go down to EUR 30 again and quickly bounce back up. As you can see, they have time and they are in no rush to reach the price of EUR 40. SMA - MACD indicator nicely shows the average price. For now, the price remains at the average price and does n
Why Boiron Stock Deserves Attention. Stock to buyAre you a believer in the power of natural remedies and alternative medicine? If so, get ready to discover a hidden gem in healthcare stock investments – Boiron stock. Homeopathy has been gaining traction as an effective and holistic approach to healing for centuries, and now it’s time to uncover its potential from an investor’s perspective. Join me as I delve into why Boiron stock deserves your attention, unravelling the mysteries behind this ancient practice and exploring the promising future.
SGO: Bearish-Shark+ Wolfe Wave+ GartleySAINT GOBAIN: Shark+ Wolfe Wave+ Gartley detected
A harmonic SHARK and GARTLEY pattern have been detected
furthermore A Bearish Wolfe wave.
you need to monitor the EMA.50 and EMA.200, as well as your Fibonacci and Bollinger levels.
Also note that Compagnie de Saint-Gobain is among the world leaders in the manufacturing and marketing of construction materials for the construction, mobility, health and industry sectors. The activity is organized around 4 poles:
- manufacturing of high-perform
Kering SA - H&S Pattern looking for deeper correctionOn the monthly chart, Kering's outlook isn't looking great at all. Trading below ichimoku cloud and RSI below 50. There is a major bearish divergence spotted on RSI that isn't improving the outlook. Once EUR 400 - EUR 380 support is lost, expect some heavy selling towards EUR 240 - EUR 230 area. Could take weeks/months to unfold. This goes well with my fundamental view for the stock. Not FA.
BCP (Commercial Bank of Portugal), way upYesterday morning, my indicators informed me that a very good trade was coming - buying shares of the Commercial Bank of Portugal. These indicators are framed in blue at the bottom of the chart. I placed a limit order to buy shares at a price of 0.2751. The market price at that moment was exactly the same. But I was unlucky. Due to a delay in data on my chart, the price was no longer relevant at that moment. That's why I didn't have time to buy this tool at that price. The stock took off in just
LVMH - Bearish Wolve Wave in the D+1 Chart?Since the ATH LVMH has been decreased round about 20%. From the Fibonacci point of view, we have a classical 50% consolidation. The consolidation pattern is includes a Wolve pattern where the 5 is made and we now have to observed the activation of the pattern. If active, 10% potential is possible. The APEX is in the middle of October.
A movement to the top is possible, the RSI is close to oversold.
$Adyen Triangle target reachedFrom false moves come fast moves. Symmetrical triangle had everyone fooled when it broke out and up only to reverse and break down with target of 610 reached. Could see an automatic rally B C move next to attempt to close upper gap. Any movement into the lower demand band below usually triggers rallies. There is a gap below at 520 but it remains to be seen if this will be filled on this occasion as orders may be waiting above and traders may target complacent shorts. This cash positive share is
Bouygues Telecom PUT opportunityEN reached 23 years resistance line, with 2 ascending triangles.
Monthly 200 SMA as resistance
Monthly 20 SMA acting as Support.
Due to overall negative market conditions, uncertainty, higher yields, I don't think this is the best time for EN to break this resistance and make a move higher.
PUT option are cheap - trade open.
(Not financial advice)
Renault - looking uptrandhi, Renault stock is one very interesting one. It is like a child. It likes to make many funny things. It is full of emotion. It likes to make tricks.
Please look on the gan square - our full of color umbrella like a sun. It has got many light rays.
Please look on the patterns - it look like that bottom was 23 - 24 eur and it was a test. Right now 31 - 33 eur was also the test. Chart have to come back to the point 1/4 and 1/3 (uptrend) ; 1/2 and 1/1 is the test.
Waiting for new waves.
Ple
LVMH (MC) -> Buy The Stock Right Herey name is Philip, I am a German swing-trader with 4+ years of trading experience and I only trade stocks , crypto , options and indices 🖥️
I only focus on the higher timeframes because this allows me to massively capitaliz e on the major market swings and cycles without getting caught up in the short term noise.
This is how you build real long term wealth!
In today's anaylsis I want to take a look at the bigger picture on LVMH.
For the past 7 years LVMH stock has been tradin
[S-016] AirbusTrading idea number S-016 | Airbus stock could raise to 141 area.
Airbus prices have been moving within a bullish channel since the beginning of the year. In recent sessons the latter have bounced ahead of pivot support S1, within the support line of the bullish channel. Following this move we expect a new short bullish phase toward the resistance trend line of the bullish channel once the pivot point at 132.28 is breached.
📈 Long Entry at 130
💰 Take Profit at 141
💸 Stop Loss at 125
KERING Monthly chart outlook negative forming massive H&SOn the monthly chart, Kering's outlook isn't looking great at all. Trading below ichimoku cloud and RSI below 50. There is a major bearish divergence spotted on RSI that isn't improving the outlook. Once EUR 400 - EUR 380 support is lost, expect some heavy selling towards EUR 240 - EUR 230 area. Could take weeks/months to unfold. This goes well with my fundamental view for the stock. Not FA.
Adyen LongAlthough it states long, I'm still somewhat neutral on this one.
However, price has been tanking significant on some bumps on the road.
They recent got a license to expand into the UK.
Price has been trading short for a while now and locally it broke out of this downward channel.
If the coming days or weeks price goes flat or even manage to take out some local levels and shows clear signs of potential accumulation. Then it will be definitely a good stock to put on the watchlist and hunt for for