Indikator

Indikator

Indikator

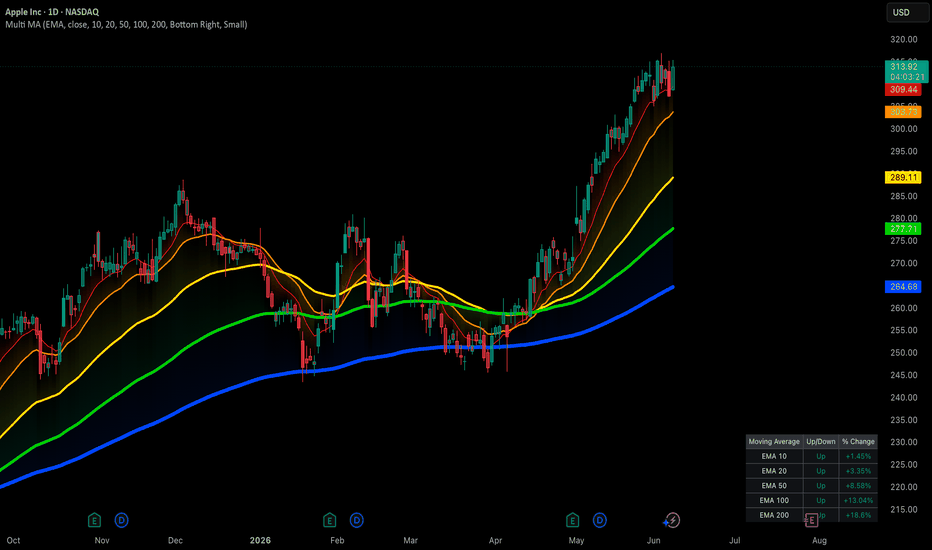
Multiple EMA + SMA (8-in-1, or 4 of each)This combo indicator takes Tradingview's default SMA and EMA Pinescript code and basically duplicates it 8 times. There are 4 EMAs and 4 SMAs, each configurable to their own timeframe, line, color, etc. I did this so I could see several combinations of moving averages on various chart timeframes, such as:
- Daily chart: 200 SMA, 50 SMA, 20 EMA
- 4 hour chart: 200 SMA, 50 EMA, 20 EMA
- 1 hour chart: 50 EMA, 20 EMA, 9 EMA
- 30 minute chart: 50 EMA, 20 EMA, 9 EMA
Moving Averages Are Filters, Not Indikator

Indikator

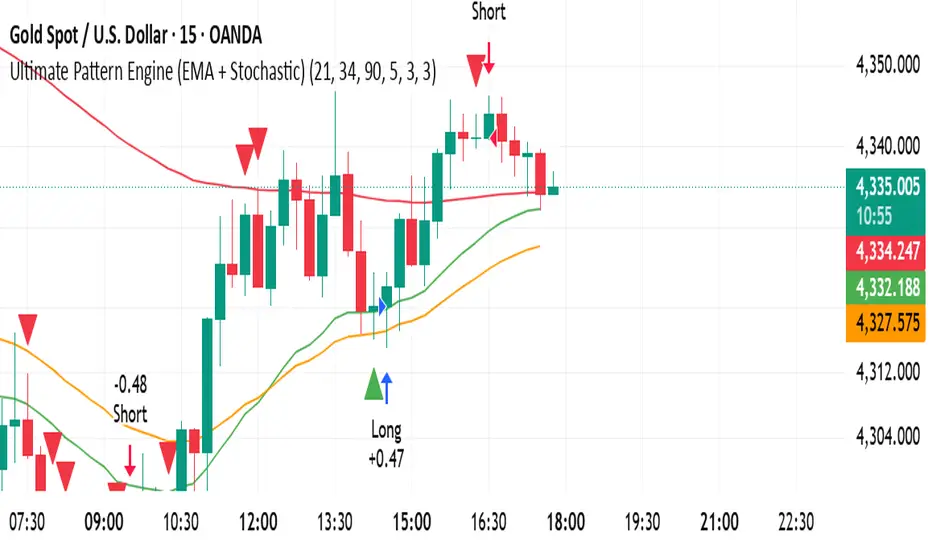
EMA MACD Trend Decision TableEMA MACD Decision Table v6
This Pine Script v6 overlay indicator summarizes trend, momentum, volume, higher-timeframe context, and ATR-based planning levels into one decision table.
The indicator uses EMA 9, EMA 21, EMA 50, EMA 100, EMA 200, MACD, RSI, ADX / DMI, volume confirmation, optional higher-timeframe EMA trend, and ATR risk planning.
It produces a numeric decision score on every bar. Bullish confirmations add points, bearish confirmations subtract points, and the final score is conve Indikator

Strategie

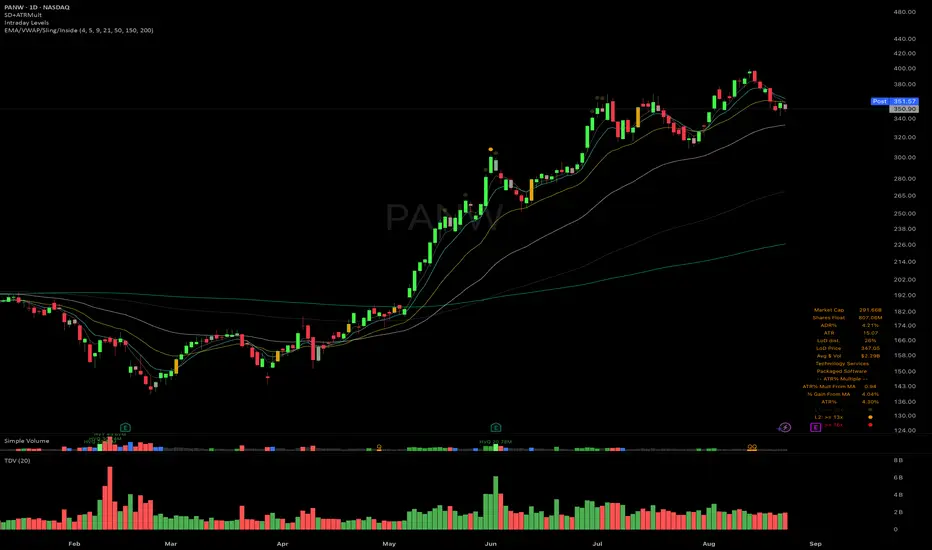
EMA's, VWAP, Inside Day, SlingshotEMA's, VWAP, Slingshot & Inside Day
An all-in-one price action overlay combining four tools:
🔹 4 Customizable EMAs — Default lengths 5, 8, 20 & 50. Adjust lengths in Settings, colors in the Style tab.
🔹 VWAP — Only displays on intraday timeframes. Auto-hides on daily and above.
🔹 Slingshot — Uses an EMA of highs rather than closes, making it a tougher level to break above. When price closes above it after 3 consecutive bars below, it signals a momentum shift — like a slingshot snapping back. Pai Indikator

Indikator

Strategie

Strategie
Indikator

Indikator

Indikator

Indikator

Indikator

Indikator

Indikator

Strategie

Indikator

Indikator

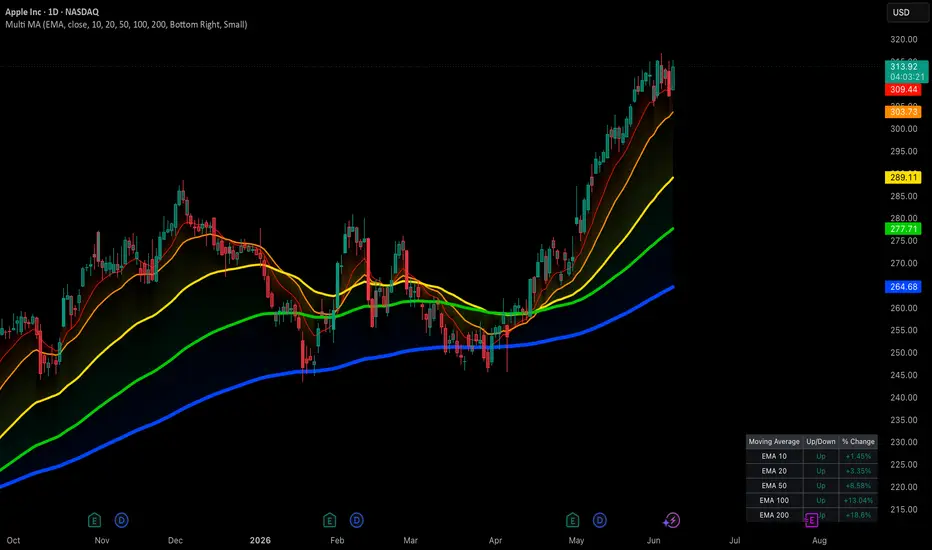
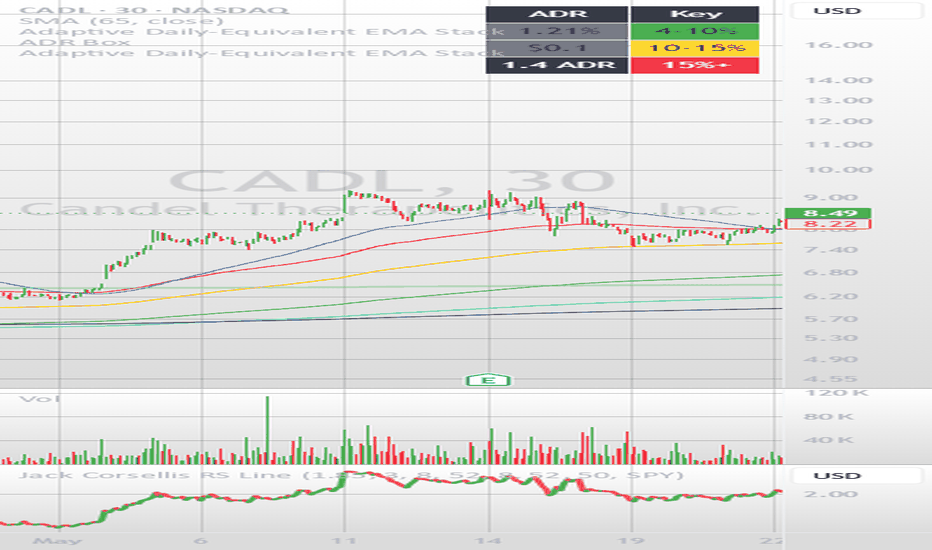
Daily EMA Stack 10/21/50/100/200Daily EMA Stack 10/21/50/100/200
A clean multi-timeframe EMA overlay that displays the 10, 21, 50, 100, and 200 Daily EMAs on any chart timeframe.
Unlike standard moving averages that recalculate based on the current chart interval, this indicator anchors all calculations to the Daily timeframe. Whether you're viewing a 1-minute, 5-minute, hourly, daily, or weekly chart, the displayed EMAs remain the true Daily EMAs.
Features:
• 10, 21, 50, 100, and 200 Daily EMAs
• One-click visibility inste Indikator
Strategie

Indikator