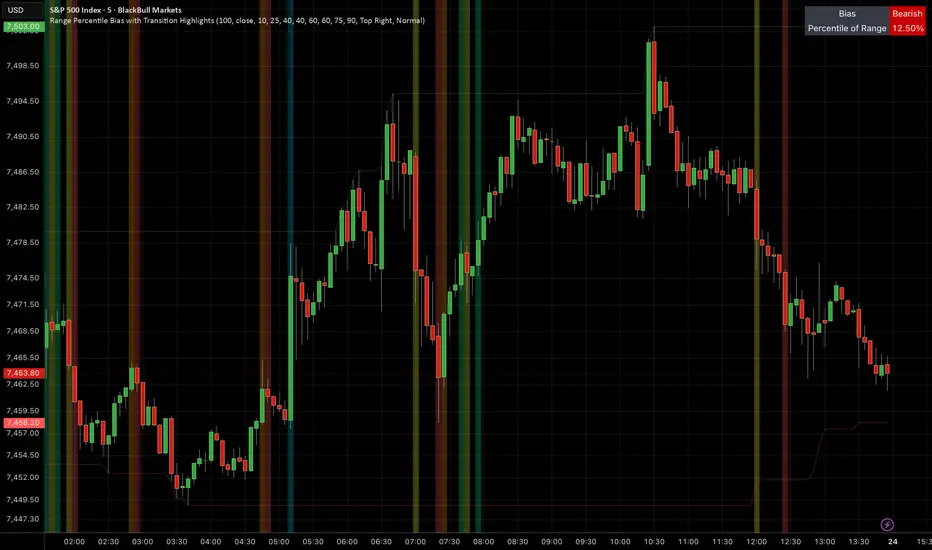
PrimeWave AI [AuraNex]PrimeWave AI is an advanced adaptive trading indicator built around the core principles of Ichimoku Cloud analysis, enhanced with intelligent filtering and trade management systems. Unlike traditional fixed-parameter Ichimoku indicators, it dynamically adjusts key periods based on market volatility using an adaptive ATR-driven engine, allowing faster reactions during volatile conditions and smoother behavior in quiet markets.
The indicator combines multiple market factors including price position relative to the cloud, Tenkan–Kijun relationships, Chikou confirmation, cloud structure, volume activity, and a custom Momentum Pulse Engine to measure trend strength and acceleration. These factors are processed through a Confluence Scoring Engine that assigns a score from 0–100, helping identify higher-probability trading opportunities and filter weaker setups.
PrimeWave AI also includes a Kumo Breakout system for detecting cloud breakouts and retests, along with a Smart TP/SL engine that automatically calculates stop-loss and multiple take-profit levels using cloud boundaries, Kijun levels, or ATR-based methods.
Additional features include multi-timeframe trend alignment, automatic support/resistance zone detection, visual dashboards, customizable signal labels, and webhook-ready alerts, creating a complete trading framework for trend identification, signal confirmation, and risk management. Indikator

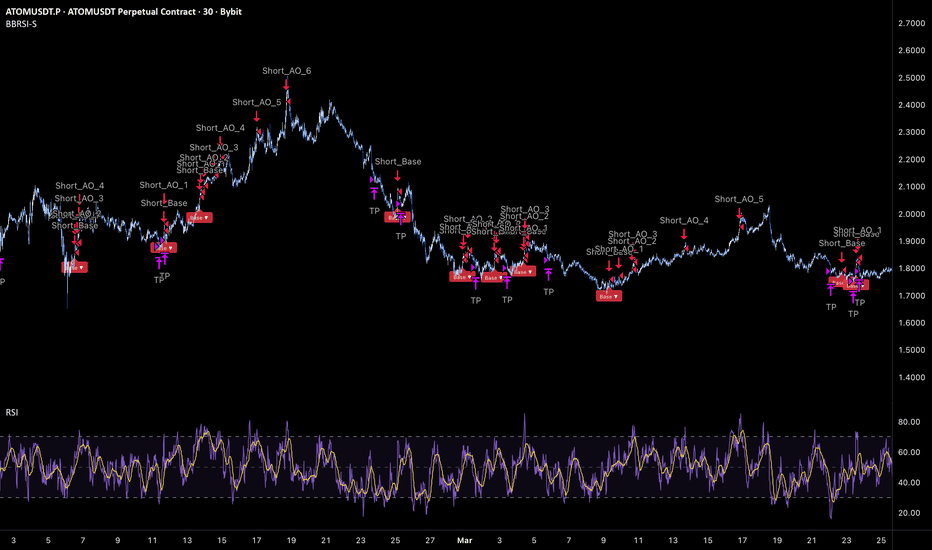
BB-RSI Overbought DCA - Short StrategyBB-RSI Overbought DCA — Short Strategy
🔷 What it does:
This is a short-only DCA strategy that fades overbought thrusts confirmed by two independent volatility-and-momentum filters on a lower timeframe. A short entry opens only when Bollinger Bands %B crosses up the upper band AND RSI crosses up an overbought threshold at the same lower-timeframe close — the dual confirmation requires both volatility-expansion and momentum-overheat to align. Nine safety orders form a wide deviation ladder for adverse upward price action. Exit is a fixed percentage Take Profit below the running average entry. No trailing, no Stop Loss.
- Single base order with up to nine safety orders, sized at a 1.03× progression for soft compounding.
- Dual-filter entry: BB %B(20, 2.0) crossing up 1.00 AND RSI(7) crossing up 65, both on 30m.
- Wide deviation ladder: 0.72% to first safety order, 1.55× step multiplier — last safety order at ~63% above base entry.
- Take Profit: 2.11% below average entry. No trailing.
- Every entry, safety order, and exit emits a webhook-ready JSON alert payload for direct DCA Bot consumption.
🔷 Who is it for:
- Swing traders looking for high-win-rate short exposure on crypto perpetuals that frequently overshoot resistance.
- Bot operators who want a mechanical fade engine with dual confirmation and bounded position size.
- Risk-conscious operators — at default settings the maximum deployed capital is ~8.93% of equity, and the realized maximum drawdown over a 2.5-year sample stayed at 1.53%.
- Traders building a low-correlation portfolio: a defensive short with very low DD and an exceptional profit factor pairs well with directional long strategies.
🔷 How does it work:
Bollinger Bands %B Filter: A 30-minute Bollinger Bands(20, 2.0) is sampled via request.security and converted to %B = (close − lower) / (upper − lower). When %B crosses up the configured level (default 1.00 — price exiting the upper band), the BB gate is satisfied. The 30-minute timeframe is sampled with lookahead disabled to avoid repaint.
RSI Filter: A 30-minute RSI(7) is sampled in parallel. When RSI crosses up the configured level (default 65 — entering overbought), the RSI gate is satisfied. Both gates must be satisfied at the same host-bar close to arm a base entry.
Entry: When both filters cross up on the same host bar, a short position opens at the base order size. The base order is configurable as Market (default) or Limit at the bar's close.
Safety Order Ladder: After the base fill, the strategy monitors price deviation upward against the position. The k-th safety order fires when close ≥ base entry × (1 + cumulative deviation), where cumulative deviation grows by the step multiplier (default 1.55). At default settings: 0.72%, 1.84%, 3.57%, 6.25%, 10.40%, 16.48%, 25.90%, 40.51%, 63.14%. Each safety order's size grows by the size multiplier (default 1.03) — soft compounding rather than aggressive martingale.
Exit: A fixed Take Profit at 2.11% below the running average entry. The position closes the moment close ≤ TP target. No trailing, no Stop Loss.
🔷 Why it's unique:
- Dual-Filter Confirmation: Two independent signals on the same lower timeframe must align. %B captures volatility expansion (price extension beyond statistical bounds); RSI captures momentum exhaustion. Together they filter out either-or noise that would trigger single-condition strategies.
- Soft Compounding Ladder: The 1.03× size multiplier is much gentler than typical martingale (1.5–2.0×). It still scales position size with adverse drift but doesn't blow up capital deployment if all safety orders fill.
- Bounded Position Cap: With 9 safety orders at 1.03× progression, the maximum deployed capital is exactly base + 80 × 10.159 = 893 USDT per trade ≈ 8.93% of default equity. Inside the conventional 5–10% per-trade band, no surprises.
- DCA Bot Integration: Every event (base, AO 1–9, exit) emits a fully-formed JSON alert payload. Connect one alert to a DCA Bot's webhook URL and the strategy drives the bot end-to-end.
🔷 Considerations Before Using the Strategy:
Market & Timeframe: Defaults are calibrated for BYBIT:ATOMUSDT perpetual on 30m. The dual-filter combination is portable to other liquid crypto perpetuals that mean-revert from overbought stretches, but filter thresholds (BB level, RSI level) should be reviewed before redeployment.
Strong Uptrends: Like any fade-the-strength setup, this strategy is positioned for ranges and rotations, not breakouts. In sustained uptrends the strategy may fill the entire 9-AO ladder and hold the short while price grinds higher. The dual filter limits exposure to confirmed overbought conditions, which historically have higher mean-reversion expectancy, but a regime shift to a strong trend requires manual oversight.
Performance Profile: This is a high-confidence, low-volatility, low-return defensive short. Over the 2.5-year backtest the strategy returned +3.95% with a 1.53% maximum drawdown — annualized return is modest, but the return-to-DD ratio of ~2.6 and profit factor of 6.23 reflect very tight risk control. Size accordingly: this is a portfolio contributor, not a standalone alpha source.
Funding Rates (Perpetuals): Backtests do not account for perpetual funding rates. Sustained positive funding on ATOMUSDT.P (longs pay shorts) would improve live performance; sustained negative funding (shorts pay longs) would degrade it. Review the historical funding pattern before live deployment.
Commission Calibration: The default commission (0.4%) is set high as a conservative assumption. The actual Bybit perpetual taker fee is approximately 0.06%, so live performance with realistic Bybit fees should be meaningfully better than the published numbers. Update the commission input to match your fee tier for accurate forward expectations.
No Stop Loss Justification: There is no exit on adverse moves beyond the 9-AO ladder. Per-trade risk is structurally capped by the bounded position-size ladder — at defaults that is 893 USDT max deployed = 8.93% of equity, inside the conventional 5–10% per-trade band. If a hard stop is required at the exchange level, layer it on the bot side.
🔷 STRATEGY PROPERTIES
Symbol: BYBIT:ATOMUSDT.P (Perpetual)
Timeframe: 30M
Test Period: Mar 1, 2025 — Apr 1, 2026 (~1.1 years).
Initial Capital: 10,000 USDT.
Order Size per Trade: 0.8% of Capital base + 9 safety orders at 1.03× progression.
Max Capital Deployed: ~893 USDT per trade (~8.93% of equity).
Commission: 0.4% per trade (conservative — Bybit perpetual taker is ~0.06%).
Slippage: 3 ticks.
Margin for Short Positions: 100%.
Indicator Settings: Default Configuration.
Base Order: 80 USDT, Market by default (Limit toggle available).
Take Profit: 2.11% below average entry (no trailing).
Stop Loss: None — bounded position size is the structural risk cap.
BB %B Filter: 30m BB(20, 2.0), Crossing Up 1.00.
RSI Filter: 30m RSI(7), Crossing Up 65.
Averaging Orders: 9, Deviation 0.72%, Deviation Step 1.55×, Size Multiplier 1.03×.
Strategy: Short Only.
🔷 STRATEGY RESULTS
⚠️ Remember, past results do not guarantee future performance.
Net Profit: +395.18 USDT (+3.95%)
Max Equity Drawdown: 154.46 USDT (1.53%)
Total Closed Trades: 267
Percent Profitable: 79.78% (213 / 267)
Profit Factor: 6.23
🔷 How to Use It:
🔸 Adjust Settings: Open the strategy inputs and review the Base Order Size, BB filter (period / deviation / level), RSI filter (length / level), the 9-AO ladder, and the Take Profit percentage. Defaults are calibrated for ATOMUSDT.P 30m — recalibrate per asset before deploying.
🔸 Results Review: Run a full-period backtest and confirm Max Drawdown stays inside your personal risk band. Validate that the closed-trade count is statistically meaningful (≥ 100 is a reasonable floor). Update commission to match your exchange's actual fees.
🔸 Create alerts to trigger the DCA Bot: Add one alert on the strategy using "Any alert() function call". Paste the DCA Bot's webhook URL into the alert's Webhook field, and fill the Bot ID, Email Token, and Pair inputs on the script. The strategy will emit JSON payloads for short entry, each safety order, and exit — formatted for direct DCA Bot consumption.
🔷 INDICATOR SETTINGS
Base Order Size (USDT): USDT amount opened on the short entry.
Use LIMIT for Base: Toggle between Market (default) and Limit at bar close.
Averaging Orders per Trade: Maximum number of safety orders per deal (default 9).
First AO Size (USDT): USDT size of the first safety order; subsequent AOs scale by the Size Multiplier.
Deviation to First AO (%): Distance from base entry at which AO1 becomes eligible.
Deviation Step Multiplier: Ladder factor that widens each subsequent deviation step.
Order Size Multiplier: Factor that grows each subsequent safety order's USDT size.
BB Timeframe / Period / Deviation / Level: 30-minute Bollinger Bands %B filter on the host symbol.
RSI Timeframe / Length / Level: 30-minute RSI filter on the host symbol.
Take Profit (%): Fixed distance from average entry where the short closes for profit.
DCA Bot Webhook: Bot ID, Email Token, and Pair fields injected into every alert payload.
Visualization: Toggle DCA Ladder, fill labels, status table.
Brand Watermark: Configurable text, position, size, and transparency.
👨🏻💻💭 We hope this tool helps enhance your trading. Your feedback is invaluable, so feel free to share any suggestions for improvements or new features you'd like to see implemented.
__
The information and publications within the 3Commas TradingView account are not meant to be and do not constitute financial, investment, trading, or other types of advice or recommendations supplied or endorsed by 3Commas and any of the parties acting on behalf of 3Commas, including its employees, contractors, ambassadors, etc. Strategie
PrimeWave AI [AuraNex]PrimeWave AI is an advanced adaptive trading indicator built around the core principles of Ichimoku Cloud analysis, enhanced with intelligent filtering and trade management systems. Unlike traditional fixed-parameter Ichimoku indicators, it dynamically adjusts key periods based on market volatility using an adaptive ATR-driven engine, allowing faster reactions during volatile conditions and smoother behavior in quiet markets.
The indicator combines multiple market factors including price position relative to the cloud, Tenkan–Kijun relationships, Chikou confirmation, cloud structure, volume activity, and a custom Momentum Pulse Engine to measure trend strength and acceleration. These factors are processed through a Confluence Scoring Engine that assigns a score from 0–100, helping identify higher-probability trading opportunities and filter weaker setups.
PrimeWave AI also includes a Kumo Breakout system for detecting cloud breakouts and retests, along with a Smart TP/SL engine that automatically calculates stop-loss and multiple take-profit levels using cloud boundaries, Kijun levels, or ATR-based methods.
Additional features include multi-timeframe trend alignment, automatic support/resistance zone detection, visual dashboards, customizable signal labels, and webhook-ready alerts, creating a complete trading framework for trend identification, signal confirmation, and risk management. Indikator

Liquidity Sweep Reversal [forexobroker]Liquidity Sweep Reversal detects stop-hunt sweeps: price wicks past a confirmed swing extreme to grab resting liquidity but the bar closes back inside, trapping breakout traders. The unique angle is ATR-scaled depth bounds (a minimum to filter noise and a maximum to reject genuine breaks) plus a persistent reversal bias armed by the sweep, with entries timed on an EMA reclaim instead of only the rarer classic sweep bar.
🔶 ALGORITHM
1. Confirm swing structure with symmetric pivots (ta.pivothigh / ta.pivotlow), tracking the latest confirmed swing high and swing low.
2. Detect a bullish sweep: low pierces the swing low by at least Min Sweep Depth x ATR but no more than Max Sweep Depth x ATR, and close finishes back above the swing low (optionally requiring a bullish reversal body). Bearish sweep is the mirror.
3. The maximum-depth bound rejects runaway moves that are real breaks rather than stop hunts.
4. Persistent reversal bias: a bullish sweep arms bias +1, a bearish sweep arms bias -1, holding until the opposite side sweeps.
5. Entry timing: within an active sweep bias, an EMA reclaim (ta.crossover / ta.crossunder of close vs the Entry Reclaim EMA) fires the trade. Sweep-Only Mode swaps this for the strict sweep+reclaim bar.
🔶 SIGNAL LOGIC
- Buy: bullish sweep bias active (swing low swept and reclaimed) and close crosses over the Entry Reclaim EMA (or, in Sweep-Only Mode, the sweep bar itself), in session, position not already long, after the cooldown window, only on barstate.isconfirmed; position-lock flips to LONG.
- Sell: bearish sweep bias active (swing high swept and reclaimed) and close crosses under the Entry Reclaim EMA (or the sweep bar itself), in session, position not already short, cooldown elapsed, on barstate.isconfirmed; position-lock flips to SHORT.
Only fires when a confirmed sweep has armed the matching reversal bias.
🔶 INPUTS
- Liquidity: pivot length for swing confirmation (default 6) and ATR length.
- Sweep depth: minimum sweep depth in ATR multiples (default 0.20x ATR) and maximum sweep depth to reject real breaks (default 3.0x ATR).
- Reclaim validity: reclaim-within-bars window and require-reversal-body toggle (default on).
- Signal Logic: Entry Reclaim EMA length (default 9) and Sweep-Only Mode toggle (default off).
- Cooldown: minimum bars between signals (default 5).
- Filters: optional session restriction with a session window.
- Visual: swept-level lines, dashboard, 3-layer glow, buy/sell colors, dashboard background.
🔶 ALERTS
LSR Buy, LSR Sell, LSR Any Signal, LSR Low Swept, LSR High Swept, LSR New Swing High, LSR New Swing Low, LSR Low Pierce, LSR High Pierce, LSR Any Sweep, LSR Sweep Tick, LSR Strong Bull, LSR Webhook JSON.
🔶 LIMITATIONS
- Requires warm-up: pivots confirm only after Pivot Length bars on each side, so early history produces no sweep targets.
- Defaults (ATR 14, min 0.20x, max 3.0x) are tuned for liquid instruments; volatile or thin symbols may need wider depth bounds.
- Sweep-Only Mode is intentionally rare; the default EMA-reclaim regime mode trades more frequently.
- Non-repainting by design (pivots confirmed, signal on bar close); the swing being swept appears Pivot Length bars after it formed.
- A sweep is a probabilistic trap, not a guaranteed reversal; in strong trends a level can be swept and continue rather than reverse.
Indikator

Inversion FVG Tracker [forexobroker]Inversion FVG Tracker detects 3-candle Fair Value Gaps, watches for them to be fully mitigated, and then trades the inversion: a filled bullish FVG flips into resistance and a filled bearish FVG flips into support. Signals fire on the retest of an inverted gap. The unique angle is the full lifecycle state machine (fresh, inverted, retested) combined with an ATR-scaled minimum gap so micro-gaps are ignored.
🔶 ALGORITHM
1. ATR (default 14) is computed for gap-size scaling.
2. A bullish FVG forms when the current low is above the high two bars back and the gap spans at least the minimum (default 0.10 x ATR). A bearish FVG mirrors this with the current high below the low two bars back.
3. The most recent bull and bear FVG are tracked with a state value: fresh, mitigated/inverted, or retested.
4. Unmitigated FVGs older than the max age (default 60 bars) are discarded.
5. Mitigation uses close by default: a bull FVG closing fully below its bottom inverts to resistance; a bear FVG closing fully above its top inverts to support.
6. A retest buffer (default 0.10 x ATR) defines the inverted-zone test; an inverted bull FVG retested from below is bearish, an inverted bear FVG retested is bullish.
7. An inversion arms a persistent bias (bear FVG to support is bullish, bull FVG to resistance is bearish) that holds until the opposite inversion; entries then time off a reclaim EMA (default 9).
🔶 SIGNAL LOGIC
- Buy: in retest-only mode, an inverted bear-FVG retest (support); otherwise active inversion bias is bullish AND close crosses over the reclaim EMA, AND session filter passes AND position is not already long AND cooldown bars elapsed AND barstate.isconfirmed.
- Sell: in retest-only mode, an inverted bull-FVG retest (resistance); otherwise active inversion bias is bearish AND close crosses under the reclaim EMA, AND session filter passes AND position is not already short AND cooldown bars elapsed AND barstate.isconfirmed.
Only fires once an FVG has actually inverted to arm the bias.
🔶 INPUTS
- FVG group: minimum gap size as a multiple of ATR; default 0.10.
- ATR Length: volatility reference for gap and buffer scaling; default 14.
- Mitigate on Close: when on, an FVG inverts only when close passes fully through it; default on.
- Retest Buffer x ATR: tolerance around the inverted zone; default 0.10.
- FVG Max Age (bars): unmitigated gaps older than this are dropped; default 60.
- Signal Logic group: entry reclaim EMA default 9, retest-only mode default off, cooldown bars default 5.
- Filters group: optional session restriction; window default 0000-2400.
- Visual group: FVG zone boxes, dashboard, 3-layer glow, buy/sell colors, dashboard background.
🔶 ALERTS
IFT Buy, IFT Sell, IFT Any Signal, IFT Bull FVG, IFT Bear FVG, IFT Bull Inverted, IFT Bear Inverted, IFT Inv Bull Test, IFT Inv Bear Test, IFT Any FVG, IFT Inversion Live, IFT Webhook JSON.
🔶 LIMITATIONS
- A 3-candle FVG needs the two trailing bars, so the earliest chart bars produce no gaps.
- Only the most recent bull and bear FVG are tracked; older overlapping gaps are not retained.
- Defaults are tuned for liquid instruments; wide-spread or gappy symbols may need a larger minimum gap.
- Unmitigated gaps expire by age, so a very slow return to a valid gap can miss the inversion window.
- The non-retest-only path uses a fast EMA cross and can fire extra entries inside one inversion bias.
Indikator

Indikator

Strategie

Veyra Delta Lens [JOAT]Veyra Delta Lens
Introduction
Veyra Delta Lens estimates delta pressure from OHLCV data and converts it into auction pressure, CVD z-score, participation entropy, absorption, and pressure-shift events.
This open-source indicator is designed as a context tool, not a standalone trading system. It focuses on explaining the current market state with restrained visuals and confirmed-bar logic where signals are used.
Core Concepts
1. Signed Volume Pressure
Candle close location and body impact estimate directional volume pressure.
2. CVD Normalization
Cumulative pressure is normalized so current pressure can be compared with recent history.
3. Participation Entropy
Volume concentration and close location distinguish balanced absorption from directional release.
4. Pressure Envelope
An auction mean and delta rails display pressure on the price chart.
delta = signedVolume * 0.65 + impactVolume * 0.35
Features
Estimated signed volume pressure
CVD z-score and impulse scoring
Absorption and divergence context
Auction mean and pressure rails
Sparse VX+ and VX- labels
Input Parameters
Delta smoothing and impulse memory
CVD normalization window
Participation entropy window
Event score and cooldown
Rails, trace, and candle toggles
How to Use This Script
Use VX+ and VX- labels as confirmed pressure shifts. Gold circles show absorption or divergence conditions aligned with the current regime.
Limitations
The script uses historical OHLCV data and cannot know future prices.
Signals and states can be late during fast reversals because confirmed-bar logic is used to reduce repainting.
Model outputs should be interpreted with market context, risk controls, and independent analysis.
No visual state should be treated as a certain trade outcome.
Originality Statement
Veyra is original in combining estimated delta, CVD normalization, entropy, auction rails, absorption, and divergence in one restrained overlay.
Disclaimer
This indicator is provided for educational and informational purposes only. It is not financial advice, investment advice, or a recommendation to buy or sell any financial instrument. All calculations are derived from historical market data and may produce inaccurate readings in some market conditions. No indicator can predict future market behavior. Use proper risk management and independent judgment.
-Made with passion by jackofalltrades
Indikator

[ A L P H A X ] VOIDAlphaX VOID — Fair Value Gap Confluence System: FVG Detection, 5-Layer Retest Entries, CE Rejection Filter & ATR Trailing Exit Engine
AlphaX VOID is a professional-grade smart money confluence system built around the single most powerful concept in institutional price action: the Fair Value Gap. Where price moves so aggressively that it leaves an unmitigated imbalance in the order book — a void — institutions return to fill orders at those levels. VOID detects every qualifying gap in real time, tracks its state, and waits. When price returns to retest that void, a 5-layer confluence engine evaluates the quality of that retest across EMA structure, squeeze momentum, volume delta pressure, VWAP bias, and ADX directional strength. Only when enough layers agree does a signal fire — not on the gap formation, not on the first touch, but on a confirmed, high-quality institutional retest with the trend and momentum behind it. Designed for active traders on crypto, forex, gold, and indices across the 1-minute to 15-minute timeframes.
━━━━━━━━━━━━━━━━━━━━━━━━━━━━━━━━━━━━━━━━
🕳 What Is a Fair Value Gap?
A Fair Value Gap (FVG) is a three-candle price structure where the middle candle moves with such force that it creates a gap between the wick of the first candle and the wick of the third candle — a zone where no two-sided trading occurred. Price moved through that area too fast for the market to establish fair value.
Bull FVG: The low of candle 3 is above the high of candle 1. Price left a gap to the upside — an unmitigated bullish imbalance. When price returns to this zone, institutions are likely resting buy orders there.
Bear FVG: The high of candle 3 is below the low of candle 1. Price left a gap to the downside — an unmitigated bearish imbalance. When price returns to this zone, institutions are likely resting sell orders there.
Why FVGs matter to institutional traders: Market makers and large institutions cannot fill their full order size in a single fast move. When price revisits the FVG zone, they use the retest to complete their position. This is why FVG retests so frequently produce high-velocity continuation moves — they are not random support/resistance, they are unfilled institutional order clusters.
AlphaX VOID does not simply draw FVG boxes. It tracks the lifecycle of every gap — from formation through active, retest, and filled — and only presents entry signals when the retest coincides with genuine multi-layer confluence.
━━━━━━━━━━━━━━━━━━━━━━━━━━━━━━━━━━━━━━━━
🔬 FVG Detection Engine — Quality Filters
Not every gap is worth trading. Gaps formed during weak, choppy price action are noise. VOID applies two mandatory quality filters to every detected gap before registering it as valid.
Displacement Filter:
The middle candle of the three-candle structure must show genuine displacement — its body must exceed the average body size over the last 14 bars by a configurable multiplier (default: 1.15×). This ensures the gap was formed by a real impulsive move, not a slow grind that happened to leave a small gap. A gap without displacement is a weak gap.
Minimum Gap Size Filter:
The physical size of the gap (the distance between the relevant wicks of candle 1 and candle 3) must meet a minimum threshold expressed as a multiple of ATR (default: 0.15×). This eliminates micro-gaps that are too small to be meaningful — gaps so narrow that spread and noise would immediately invalidate any retest entry.
Only gaps passing both filters are registered, stored, and tracked.
FVG Lifecycle Tracking:
Every registered FVG is stored in memory arrays with its top, bottom, direction, formation bar, and fill state. On every bar, VOID updates the state of all active gaps:
Active — gap is unmitigated. Box and CE line extend forward in real time
Filled — price has fully closed through the gap boundary. Box color shifts to neutral gray, CE line fades. Optionally hidden entirely via the Hide Filled FVGs setting
Age cutoff — gaps older than the configured Max FVG Age (default: 120 bars) are excluded from retest scanning. Old gaps lose institutional relevance as market structure evolves
━━━━━━━━━━━━━━━━━━━━━━━━━━━━━━━━━━━━━━━━
📐 The FVG Visual System
Every active FVG is rendered directly on the price chart as a structured visual zone with three components.
FVG Box:
A shaded rectangle spanning the full gap from top to bottom. Bull gaps are shaded in semi-transparent yellow-green; bear gaps in semi-transparent red. The box extends forward by the configured number of bars (default: 30) and updates in real time as price evolves. When a gap fills, the box shifts to neutral gray — or is removed entirely if Hide Filled FVGs is enabled.
CE Line (Consequent Encroachment — 50% Level):
A dashed line at the exact midpoint of the FVG zone. This is the Consequent Encroachment level — the 50% retracement into the gap. This level is critical for entries: the most reliable FVG retests are those where price dips into the gap but closes back above (bull) or below (bear) the CE line, demonstrating that the institutional zone held and rejected price cleanly. The CE Rejection filter is on by default and can be toggled in settings.
FVG Formation Dots:
Small squares appear below (bull FVG) or above (bear FVG) the bar at the moment a new qualifying gap is formed, providing instant chart-level notification of every new gap without requiring dashboard attention.
━━━━━━━━━━━━━━━━━━━━━━━━━━━━━━━━━━━━━━━━
🧠 The Retest Detection Engine
Detecting a gap is the easy part. Detecting a high-quality retest of that gap is the core intellectual challenge VOID is built to solve.
On every bar, VOID scans all active, unfilled FVGs of the appropriate direction for a valid retest condition. A retest requires all of the following to be true simultaneously:
1. Price overlap: The current bar's low must be at or below the FVG top, and the current bar's high must be at or above the FVG bottom. Price is physically inside or touching the zone.
2. Candle rejection: The bar must close in the correct direction — a bullish close (close above open) for a bull FVG retest, a bearish close for a bear FVG retest. Price entered the gap but the candle closed back out, demonstrating rejection.
3. CE rejection (when enabled): For bull retests, the close must be at or above the CE midline — not just any bullish close, but one that reclaims the institutional midpoint. For bear retests, the close must be at or below the CE midline. This is the single most important retest quality filter in the system. A retest that fails to reclaim the 50% level is a weak, indecisive retest.
4. Age validation: The gap must be no older than the configured maximum age. Gaps older than this threshold are excluded even if all other conditions are met.
5. Most recent qualifying gap priority: When multiple gaps qualify simultaneously, VOID selects the most recently formed gap — the freshest institutional imbalance takes precedence.
━━━━━━━━━━━━━━━━━━━━━━━━━━━━━━━━━━━━━━━━
📊 The 5-Layer Confluence Engine
A valid FVG retest alone is not sufficient for a signal. VOID requires that the retest occur within a high-quality confluence environment across five independent layers. Each layer casts a directional vote on every bar. Signals only fire when a configurable minimum number of votes align (default: 3 of 5).
━━━━━━━━━━━━━━━━━━━━━━━━━━━━━━━━━━━━━━━━
Layer 1 — EMA Ribbon (Trend Structure)
A triple EMA ribbon using Fast (default: 8), Slow (default: 21), and Signal (default: 50) EMAs. All three must stack in directional order and price must be on the correct side for a full ribbon vote.
Bull: Fast above Slow above Signal, close above Fast EMA.
Bear: Fast below Slow below Signal, close below Fast EMA.
A separate EMA Trend Alignment setting (default: on) enforces that bull FVG retest signals only fire when the fast EMA is above the slow EMA — the minimum trend structure condition — even if the full ribbon stack is not met. This prevents counter-trend FVG entries that carry the lowest success rate.
The ribbon is plotted on the chart as a gradient fill between the Fast and Slow EMA lines — yellow-green fill during bull structure, red during bear, gray during flat.
━━━━━━━━━━━━━━━━━━━━━━━━━━━━━━━━━━━━━━━━
Layer 2 — Squeeze Momentum (Energy Detection)
The TTM Squeeze momentum engine measures whether energy is building or releasing and in which direction.
Squeeze state: When Bollinger Bands compress inside Keltner Channels, volatility is contracting and a directional breakout is loading. This state is displayed as an orange background tint and flagged on the dashboard as ⚡ SQZ. An FVG retest that coincides with a squeeze release is one of the highest-quality setups the system can detect — the gap provides the structural level, the squeeze provides the breakout energy.
Momentum direction: Calculated via linear regression of price relative to the midpoint of the recent high-low range. Positive and rising = bull momentum. Negative and falling = bear momentum.
━━━━━━━━━━━━━━━━━━━━━━━━━━━━━━━━━━━━━━━━
Layer 3 — Volume Delta (Institutional Pressure)
A proprietary volume pressure model that splits each candle's volume into estimated bullish and bearish components based on the close position within the high-low range, smoothed by EMA. A secondary OBV slope confirms the dominant pressure direction over the configured lookback.
Bull vote: Bull volume EMA exceeds bear, delta EMA is positive, and OBV slope is rising — three independent volume signals all confirming buying pressure.
Bear vote: The full inverse.
An FVG retest with genuine volume delta confirmation means real capital is flowing into the gap zone, not just price drifting back. This is the distinction between a high-probability institutional retest and a low-energy drift that is likely to fail.
━━━━━━━━━━━━━━━━━━━━━━━━━━━━━━━━━━━━━━━━
Layer 4 — VWAP Bias (Institutional Session Reference)
The Volume Weighted Average Price anchored to the session provides the clearest single reference for institutional directional bias. Price above VWAP means institutions are net buyers for the session. Price below means net sellers.
Bull vote: Close above VWAP.
Bear vote: Close below VWAP.
A bull FVG retest that occurs while price is above VWAP is a with-institution trade. A bull FVG retest while price is below VWAP is counter-institutional — the gap exists, the retest is clean, but the session-level bias is working against the entry. This distinction is worth one full confluence point and often determines whether a retest succeeds or fails.
The VWAP filter can be toggled off, and the VWAP line itself can be shown or hidden independently.
━━━━━━━━━━━━━━━━━━━━━━━━━━━━━━━━━━━━━━━━
Layer 5 — ADX Directional Strength (+DI / -DI)
The ADX filter in VOID operates at two levels. First, the ADX value must meet the minimum threshold (default: 18) confirming the market is trending rather than ranging. Second, the directional component is used — +DI versus -DI — to confirm that the ADX strength is aligned with the signal direction.
Bull vote: ADX above threshold and +DI exceeding -DI — the trend strength is directionally bullish.
Bear vote: ADX above threshold and -DI exceeding +DI — the trend strength is directionally bearish.
This is fundamentally different from a simple ADX on/off gate. An ADX reading of 25 with +DI above -DI in a bull FVG setup is confirming. An ADX reading of 25 with -DI above +DI in a bull FVG setup means the trend strength is bearish — directionally opposed to the signal — and this layer will not vote for it.
━━━━━━━━━━━━━━━━━━━━━━━━━━━━━━━━━━━━━━━━
🏷 Signal Firing Logic
A VOID signal fires when all of the following are simultaneously true:
A valid FVG retest is detected (overlap + candle rejection + CE rejection if enabled + age check)
The confluence score meets or exceeds the configured minimum (default: 3 of 5 layers)
ADX confirms a trending market (value above minimum threshold)
Session filter confirms active hours
Signal cooldown has elapsed since the last signal (default: 8 bars) — prevents repeated signals during extended retest zones
EMA trend alignment condition is met if the Require EMA Trend Alignment setting is enabled
Edge triggering: The signal fires only on the bar where all conditions first become true simultaneously — not on every bar they remain true. Each triangle on the chart represents a distinct, fresh confluence event.
Score label: Every signal prints a label (e.g., 4/5 FVG ) showing the live confluence score at signal time. The FVG suffix confirms this is an institutional gap retest entry, not a generic momentum entry.
━━━━━━━━━━━━━━━━━━━━━━━━━━━━━━━━━━━━━━━━
🎯 FVG-Anchored Stop Loss Placement
VOID includes a purpose-built stop loss mode unique to FVG trading: Place SL Beyond FVG Edge (default: on).
When enabled, the stop loss for a bull retest entry is placed at the bottom of the retested FVG minus an ATR buffer — not below the current bar's low. For a bear retest, the stop is placed at the top of the retested FVG plus an ATR buffer.
Why this matters: The FVG boundary is the institutional invalidation level. If price closes beyond the far edge of the gap, the imbalance has been fully absorbed — the institutional thesis for the retest is gone and the trade is structurally invalid. Using the FVG edge as the stop base produces stops that are:
Structurally meaningful — anchored to the actual invalidation level, not an arbitrary ATR distance from entry
Tighter when gaps are narrow — better risk-reward on high-quality, precise gaps
Wider when gaps are large — providing the trade room to breathe within the full institutional zone
When this setting is off, the stop reverts to a standard ATR-based distance from the bar's low or high — consistent with the Pulse Scalper behavior.
━━━━━━━━━━━━━━━━━━━━━━━━━━━━━━━━━━━━━━━━
🛡 Dynamic ATR Exit System
All three exit mechanisms from the VOID exit engine work together on every open trade:
Stop Loss: Placed at the FVG far edge (when enabled) or bar low/high, minus/plus an ATR buffer (default: 1.2×). Your maximum risk boundary. Does not move.
TP1 — Partial Target (50%): 1.8× ATR from entry. Scale out half the position here and move the remainder to breakeven. A small circle marker appears at the TP1 bar.
TP2 — Full Target: 3.5× ATR from entry. Full position exits and the system resets. A labeled TP marker confirms the exit on the chart.
ATR Trailing Stop: A dynamic stop that advances with price every bar — always positioned 1.5× ATR behind the current bar's low (bull) or high (bear). Plotted as a live orange line. In strong institutional continuation moves, the trail captures significantly more than the fixed TP2 target. In weak retests that stall early, the trail cuts the loss before the fixed SL is reached — providing a tighter actual exit than the structural stop.
All exit levels are plotted as live lines on the chart for the duration of the trade and cleared automatically on exit.
━━━━━━━━━━━━━━━━━━━━━━━━━━━━━━━━━━━━━━━━
📊 Live Dashboard
The real-time dashboard displays the complete internal state of the indicator across four sections, updated on every bar.
FVG STATE
Bull FVGs — count of currently active, unfilled bull FVGs being tracked
Bear FVGs — count of currently active, unfilled bear FVGs being tracked
Retest — live retest detection status: ▲ BULL RETEST or ▼ BEAR RETEST when a valid gap touch is occurring, — NONE otherwise. This updates in real time so you can see a retest developing before the full signal fires
MARKET
Session — ✓ ACTIVE or ✗ OFF-HOURS. Confirms whether the session filter gate is open
ADX — live ADX value with ✓ or ✗ pass/fail. Confirms whether market structure is trending strongly enough to support FVG retest entries
CONFLUENCE
L1 EMA — current ribbon state: ▲ BULL, ▼ BEAR, or — FLAT
L2 Momentum — current momentum state: ⚡ SQZ (squeeze building), ▲ BULL, ▼ BEAR, or — FLAT. The squeeze state is the highest pre-signal alert condition
L3 Vol Delta — current volume pressure: ▲ BULL, ▼ BEAR, or — NEUTRAL
L4 VWAP — current VWAP position: ▲ ABOVE (institutional bull bias) or ▼ BELOW (institutional bear bias)
L5 ADX Dir — ADX directional vote: ▲ BULL (+DI dominant), ▼ BEAR (-DI dominant), or — FLAT
Bull Score — live 0–5 score. Background highlights yellow-green when the minimum threshold is met
Bear Score — live 0–5 score. Background highlights red when the minimum threshold is met
POSITION
Position — current tracked position: ▲ LONG, ▼ SHORT, or — FLAT with background color highlight
Stop Loss — the active SL level (FVG-anchored or ATR-based depending on settings), color-coded by direction
TP1 / TP2 — the active first take-profit level; TP2 is tracked internally and triggers the full exit marker
Bars in Trade — bars elapsed since entry, tracking trade duration
━━━━━━━━━━━━━━━━━━━━━━━━━━━━━━━━━━━━━━━━
📈 Chart Visual System
FVG Boxes (yellow-green / red) — active imbalance zones extending forward in real time. Color shifts to gray on fill
CE Dashed Lines — the 50% midpoint of every active FVG. The key level for CE rejection filtering
Formation Dots — small squares marking the exact bar a new qualifying FVG was detected
▲ Triangle (below bar) — bull retest entry signal. All conditions met
▼ Triangle (above bar) — bear retest entry signal. All conditions met
Score Label (e.g. 4/5 FVG) — confluence score at signal time, printed on every entry triangle
EMA Ribbon Fill — yellow-green fill during bull EMA structure, red during bear, gray during flat
VWAP Line (purple) — optional, toggleable session VWAP reference
Orange Squeeze Background — active during Bollinger/Keltner squeeze conditions
Yellow-green background tint — active during open long trades
Red background tint — active during open short trades
SL Line — fixed stop loss level, active while trade is open
TP1 Line — first partial take-profit target
TP2 Line (bright) — full exit target
Trail Line (orange) — dynamic trailing stop, advances with price every bar
TP marker — confirms TP2 hit and full exit
SL marker — confirms stop loss or trail triggered
━━━━━━━━━━━━━━━━━━━━━━━━━━━━━━━━━━━━━━━━
🚀 How to Trade with AlphaX VOID — Step by Step
Step 1 — Read the FVG State
Check the dashboard: how many active bull and bear FVGs are on the chart?
Multiple active FVGs in one direction indicate a well-defined institutional order cluster — a zone with stacked imbalances that price is likely to respect strongly on retest
Zero active FVGs in a direction means no institutional retest opportunity exists yet — wait for a new gap to form
Step 2 — Watch for Retest Alert on the Dashboard
The RETEST row updates in real time. ▲ BULL RETEST or ▼ BEAR RETEST appearing means price is currently inside a valid FVG zone with a rejection candle forming
This is your cue to check the confluence score rows. Watch the bull or bear score building in real time on the current bar — if it is approaching or has crossed the threshold, a signal may be seconds away
Step 3 — Enter on the Signal Triangle
A ▲ triangle below the bar is a confirmed bull FVG retest entry. All conditions — FVG retest quality, confluence score, ADX, session, cooldown, trend alignment — are met simultaneously
A ▼ triangle above the bar is a confirmed bear FVG retest entry
Read the score label. A 5/5 signal is the maximum confluence available — all five layers and the gap retest aligned simultaneously. These are the highest-conviction setups VOID produces
Enter on the close of the signal bar or the open of the next bar
Step 4 — Manage the Trade with Live Exit Lines
The SL line is your structural invalidation. If you used the FVG-anchored SL, price closing beyond this level means the institutional gap has been fully absorbed — the thesis is invalid
Watch the orange Trail Stop advancing with price as the trade moves in your favor
At TP1, scale out 50% of the position. Move your stop to breakeven on the remainder
Let the trailing stop manage the rest — it captures whatever continuation the institutional imbalance produces
Step 5 — Exit and Reset
A TP marker confirms TP2 hit. Full exit and system reset
An SL marker confirms stop or trail triggered. Accept the loss and wait — the FVG that was retested is now filled or invalidated, and a new setup will develop from the next qualifying gap
Never re-enter immediately after a stopped trade. Wait for the confluence score to rebuild and a new qualifying gap to form or a fresh retest of a different active gap
━━━━━━━━━━━━━━━━━━━━━━━━━━━━━━━━━━━━━━━━
⚠ Identifying Low-Quality Conditions — When Not to Trade
Stand aside when:
ADX ✗ on the dashboard — the market is not trending. FVG retests in ranging markets are frequently absorbed rather than rejected, producing whipsaw exits
RETEST shows ▲ or ▼ but no triangle appears — a retest is occurring but the confluence score or other filters are blocking the signal. This is the system explicitly telling you the quality threshold is not met — do not override it manually
Session ✗ OFF-HOURS — thin liquidity environments produce unreliable FVG reactions. The institutional actors who created the gap are not active
Multiple gap fills in quick succession — if several FVGs are filling rapidly without producing entries, the market is in a trending impulse phase eating through old imbalances rather than respecting them. Wait for the new gaps being created by this impulse to age and become valid retest candidates
Score stuck at 1 or 2 of 5 — the confluence environment is fragmented. Too few layers agree for a reliable institutional retest
Orange squeeze background present but score below threshold — energy is coiling but the directional confluence is not established. Wait for the squeeze to release in a clear direction with score confirmation before acting
What to do:
Monitor the dashboard for the RETEST row and confluence scores building simultaneously — the ideal setup shows both developing on the same bar
Prioritize gaps with the CE Rejection filter active — CE-rejected retests are the cleanest institutional entries available
Wait for ADX to confirm — a trending ADX above threshold combined with a directional +DI/-DI alignment is the ideal background for FVG retest entries
The highest-quality VOID setup: active squeeze on the dashboard, price retesting a fresh FVG at the CE level, 5/5 confluence score, ADX ✓, session ✓. These conditions together rarely occur — when they do, they produce the strongest continuation moves the system identifies
━━━━━━━━━━━━━━━━━━━━━━━━━━━━━━━━━━━━━━━━
⚡ Key Features
🕳 Real-time FVG detection engine — identifies all qualifying bull and bear Fair Value Gaps with displacement and minimum gap size filters
📦 Full FVG lifecycle tracking — every gap stored in memory arrays with top, bottom, direction, age, and fill state updated on every bar
📐 CE (Consequent Encroachment) filter — requires price to reclaim the 50% midpoint of the gap on retest, eliminating weak, indecisive touches
🧠 5-layer confluence gate — EMA Ribbon, Squeeze Momentum, Volume Delta, VWAP Bias, and ADX Directional Strength must agree before a retest signal fires
📊 Live confluence scoring — bull and bear scores updated every bar, displayed on the dashboard before the signal appears
🎯 FVG-anchored stop loss — places the SL at the structural invalidation level (the far FVG edge) rather than a generic ATR distance, producing structurally meaningful risk levels
⚡ Squeeze momentum integration — TTM-style Bollinger/Keltner squeeze detection flags pre-breakout energy buildup with orange background tint and dashboard state
📡 VWAP session bias — confirms whether a retest is with or against institutional session direction
🔬 ADX directional filter — uses both the ADX value and +DI/-DI directionality, not just a simple trend/no-trend gate
🛡 Dynamic ATR trailing stop — orange line advances with price every bar, capturing extended institutional continuation moves beyond the fixed TP2 level
📈 EMA ribbon with trend alignment enforcement — prevents counter-trend FVG entries that carry the lowest success rate
🕐 Session filter — restricts entries to active market hours, eliminating thin-liquidity false retest reactions
⏱ Signal cooldown — prevents repeated signals during extended retest zones, ensuring each entry represents a distinct high-quality event
📊 21-row live dashboard — FVG State, Market, Confluence, and Position sections updated in real time
🔔 10 alert conditions — new FVG formation, retest entry, TP1/TP2 hits, stop hits for both bull and bear
🎨 Fully cohesive dual-tone color system — yellow-green for all bullish elements, red for all bearish elements, orange for squeeze and trail, gray for filled gaps and neutral states
⚙ Fully configurable — FVG parameters, confluence layers, EMA periods, squeeze settings, VWAP filter, ADX threshold, exit multipliers, session window, and all colors are independently adjustable
━━━━━━━━━━━━━━━━━━━━━━━━━━━━━━━━━━━━━━━━
⚙ Settings Reference
Fair Value Gaps
Show FVG Zones — toggle FVG boxes on or off
Show CE (50%) Lines — toggle the consequent encroachment midpoint lines
Max Active FVGs — maximum number of FVGs stored in memory simultaneously (default: 40)
Zone Extend (bars) — how many bars forward the FVG box and CE line project (default: 30)
Max FVG Age for Entries — gaps older than this bar count are excluded from retest scanning (default: 120)
Min Gap Size (ATR x) — minimum gap width as a multiple of ATR required for gap registration (default: 0.15)
Min Displacement (body x) — middle candle body must exceed average body by this multiplier (default: 1.15)
Require CE Rejection — close must reclaim the 50% gap midpoint on retest (default: on — strongly recommended)
Hide Filled FVGs — removes boxes and CE lines for gaps that have been fully mitigated (default: off)
EMA Ribbon
Fast EMA — fastest ribbon line (default: 8)
Slow EMA — intermediate ribbon line (default: 21)
Signal EMA — macro trend anchor (default: 50)
Show EMA Ribbon — toggle ribbon fill and lines
Squeeze Momentum
BB Length / BB Mult — Bollinger Band parameters for squeeze detection (defaults: 20 / 2.0)
KC Length / KC Mult — Keltner Channel parameters (defaults: 20 / 1.5)
Momentum Length — linear regression period for momentum direction (default: 12)
Volume Delta
Volume MA Length — EMA smoothing for bull and bear volume estimates (default: 14)
OBV Slope Length — lookback for OBV slope directionality (default: 10)
VWAP
Use VWAP Filter — when on, Layer 4 requires close to be on the correct side of VWAP (default: on)
Show VWAP Line — toggle the VWAP line on the chart (default: off)
Confluence Gate
Min Layers Required — minimum confluence votes needed for a signal (default: 3 of 5)
Session Filter — toggle active hours restriction
Active Session — configurable session window (default: 0700-2000)
Signal Cooldown — minimum bars between consecutive signals (default: 8)
Require EMA Trend Alignment — enforces minimum EMA directional alignment even when full ribbon is not stacked (default: on)
ADX Filter
Use ADX Filter — toggle the trend quality and directional gate
ADX Length — calculation lookback (default: 14)
ADX Minimum — threshold below which all signals are suppressed (default: 18)
Exit Settings
ATR Length — lookback for all ATR exit calculations (default: 10)
SL ATR Mult — stop loss ATR buffer beyond FVG edge or bar low/high (default: 1.2)
TP1 ATR Mult — first take-profit target (default: 1.8)
TP2 ATR Mult — full exit target (default: 3.5)
Use ATR Trailing Stop — toggle dynamic trailing stop
Trail ATR Mult — trailing distance from current bar's extreme (default: 1.5)
Show Exit Levels — toggle SL, TP1, TP2, and trail lines on the chart
Place SL Beyond FVG Edge — anchors stop to the structural gap invalidation level (default: on)
Display
Show Confluence Score Label — prints live score on every signal triangle
Show Dashboard — toggle the full dashboard panel
Dashboard Position — Top Left / Top Right / Bottom Left / Bottom Right
Colors
Bull / Bull Bright — yellow-green family for all bullish signals, fills, ribbons, and labels
Bear / Bear Bright — red family for all bearish signals, fills, ribbons, and labels
Squeeze — orange for squeeze tint and trailing stop line
Bull FVG / Bear FVG — gap box fill and border colors
Filled FVG — neutral gray for mitigated gaps
EMA Fast / Slow / Signal — individual EMA line colors
Ribbon Fill Bull / Bear / Flat — ribbon fill colors for each trend state
VWAP Line — VWAP plot color (default: purple)
SL / TP / TP2 / Trail Lines — individual exit level line colors
Long Zone BG / Short Zone BG — active trade background tints
Bull Label Text / Bear Label Text — text color for score labels on bull and bear signals
Dash Text / Dash BG / Dash Header / Dash Section / Dash Frame — full dashboard color control
━━━━━━━━━━━━━━━━━━━━━━━━━━━━━━━━━━━━━━━━
🔔 Alert Conditions (10 total)
FVG Formation Alerts
New Bull FVG Formed — a qualifying bullish Fair Value Gap has been detected. Watch for retest entry
New Bear FVG Formed — a qualifying bearish Fair Value Gap has been detected. Watch for retest entry
Entry Alerts
Bull FVG Retest Entry — all conditions met: bull FVG retest, CE rejection, confluence score, ADX, session
Bear FVG Retest Entry — all conditions met for a short institutional retest entry
Exit Alerts
Bull TP1 Hit — price reaches the first bull take-profit. Scale out 50%
Bull TP2 Hit — price reaches the full bull exit target. Position closed
Bull Stop Hit — stop loss or trailing stop triggered on a long position
Bear TP1 Hit — price reaches the first bear take-profit. Scale out 50%
Bear TP2 Hit — price reaches the full bear exit target. Position closed
Bear Stop Hit — stop loss or trailing stop triggered on a short position
All alert messages are formatted as const strings for clean webhook and notification platform integration.
━━━━━━━━━━━━━━━━━━━━━━━━━━━━━━━━━━━━━━━━
🎯 Recommended Settings by Instrument & Timeframe
The default configuration is optimized for XAUUSD, major forex pairs, and crypto on M1–M5 :
Min Layers at 3/5 — strong confluence without requiring perfection on every bar
CE Rejection on — the single most important FVG quality filter. Leave this enabled in all configurations
ADX minimum at 18 — slightly more permissive than the Pulse Scalper default, accounting for the structural quality already provided by the FVG retest condition
FVG-anchored SL on — structurally superior stop placement for all FVG-specific entries
Max FVG Age at 120 bars — covers approximately 2 hours on M1, 10 hours on M5. Sufficient for intraday imbalances without trading excessively old gaps
For other instruments or timeframes, adjust:
Higher timeframes (M15, H1, H4) — increase Max FVG Age to 200–300, increase Retest Cooldown to 15–25, increase TP2 to 4.5–5.5× ATR, raise Min Confidence to 4/5
Crypto (BTC, ETH) — increase Min Gap Size to 0.25–0.35× ATR to filter micro-gaps in volatile crypto price action, increase KC Mult to 2.0 for the squeeze layer
Indices (NAS100, US30) — use defaults with session tightened to 09:30–16:00. Increase displacement multiplier to 1.3 for cleaner gap quality on index moves
More signals — lower Min Layers to 2, disable CE Rejection, increase Max FVG Age, reduce Cooldown
Fewer, higher-quality signals — raise Min Layers to 4 or 5, keep CE Rejection on, raise ADX minimum to 22–25, reduce Max FVG Age to 60–80 bars
━━━━━━━━━━━━━━━━━━━━━━━━━━━━━━━━━━━━━━━━
👥 Who This Is For
🏦 Smart money and institutional price action traders — VOID is built on the core concept that institutional order flow creates imbalances and returns to fill them. This is the foundational logic of ICT methodology applied with quantitative confluence filters
🥇 Gold (XAUUSD) and forex scalpers — FVGs are particularly reliable on gold and major forex pairs where institutional order flow is most dominant
📊 Crypto and index traders — the displacement and gap size filters adapt the system to higher-volatility instruments without producing noise
🎯 Precision entry traders — the CE rejection filter and FVG-anchored stop produce tighter, more structurally defined entries than generic momentum systems
🧠 Systematic traders — the 5-layer confluence score provides a quantitative quality metric for every retest event, not just a visual signal
📉 Traders who want to stop chasing breakouts — VOID forces you to wait for price to return to the institutional level, eliminating the discipline failure of entering on extended, overheated moves
⚠ Traders who struggle with stop placement — the FVG-anchored SL system provides structurally meaningful stop levels determined by the market's own imbalance boundaries, not arbitrary ATR multiples
━━━━━━━━━━━━━━━━━━━━━━━━━━━━━━━━━━━━━━━━
📝 Notes
All signals are confirmed on bar close — the indicator is non-repainting by design. FVG boxes and CE lines may extend or update visually on the current bar, but no signal is generated until bar close confirmation
The CE Rejection filter is strongly recommended. Disabling it allows signals on any touch of the FVG box, including weak wicks that are unlikely to produce clean continuation moves
Maximum 500 labels, 500 lines, and 500 boxes are rendered. On very low timeframes with extended chart history, the oldest FVG boxes, CE lines, and signal markers may be automatically removed by TradingView's rendering limits. Reduce Max Active FVGs if this becomes an issue
FVG fill state is based on bar close — a wick through the gap boundary that closes inside or above the zone does not mark the gap as filled. Only a close beyond the boundary constitutes a fill
The VWAP calculation resets at the start of each session. On 24-hour crypto instruments, the VWAP anchors to the chart's visible history. For best VWAP behavior on crypto, consider disabling the VWAP filter (Layer 4) and relying on the remaining four layers
Gap age counting begins from the formation bar. A gap formed 5 bars ago on M5 is 25 minutes old — very fresh. The same gap age on H1 is 5 hours old — potentially stale. Adjust Max FVG Age to your timeframe context
The Trade Status section tracks position direction from signal to exit within a single chart session — it does not connect to your broker or brokerage account
━━━━━━━━━━━━━━━━━━━━━━━━━━━━━━━━━━━━━━━━
⚠ Disclaimer
This indicator is a technical analysis and visualization tool intended for educational and informational purposes only. It does not constitute financial advice or a recommendation to buy or sell any financial instrument. All signals are generated from historical and real-time price data using mathematical calculations — their accuracy or profitability is not guaranteed. Past performance of any signal type does not guarantee future results. Always conduct your own analysis, use proper risk management, and consult a licensed financial advisor before making any trading decisions. The author accepts no responsibility for any losses incurred from the use of this indicator.
━━━━━━━━━━━━━━━━━━━━━━━━━━━━━━━━━━━━━━━━
Built for traders who understand that price always returns to where it left unfinished business — and who want a system precise enough to be there when it does. Indikator

Nexus Kinetic Reactor [JOAT]Nexus Kinetic Reactor
Introduction
Nexus Kinetic Reactor estimates price as a noisy state process. It tracks state, velocity, uncertainty, confidence, and optional projection cones.
This open-source indicator is designed as a context tool, not a standalone trading system. It focuses on explaining the current market state with restrained visuals and confirmed-bar logic where signals are used.
Core Concepts
1. Recursive State Estimate
A smoothing lambda updates the estimated price state bar by bar.
2. Velocity Regime
Changes in the state estimate create velocity and acceleration-style context.
3. Uncertainty Bands
Noise windows and sigma bands show how uncertain the current estimate is.
4. Confidence Gate
Signals require tracking confidence and expectancy thresholds before labels appear.
state := state + lambdaAdjustment * (price - state)
Features
Recursive price-state estimator
Velocity and acceleration regime logic
Uncertainty bands
Projection cone
Blocked signal markers and dashboard
Input Parameters
Smoothing lambda and noise window
ATR length and velocity threshold
Minimum confidence and expectancy
Band sigma and projection bars
Cone, candle, and panel toggles
How to Use This Script
Use the state estimate and uncertainty bands as kinetic context. Labels only appear when the model clears confidence and expectancy gates.
Limitations
The script uses historical OHLCV data and cannot know future prices.
Signals and states can be late during fast reversals because confirmed-bar logic is used to reduce repainting.
Model outputs should be interpreted with market context, risk controls, and independent analysis.
No visual state should be treated as a certain trade outcome.
Originality Statement
Nexus is original in combining state estimation, velocity gating, uncertainty bands, expectancy filtering, and projection visualization.
Disclaimer
This indicator is provided for educational and informational purposes only. It is not financial advice, investment advice, or a recommendation to buy or sell any financial instrument. All calculations are derived from historical market data and may produce inaccurate readings in some market conditions. No indicator can predict future market behavior. Use proper risk management and independent judgment.
-Made with passion by jackofalltrades
Indikator

Indikator

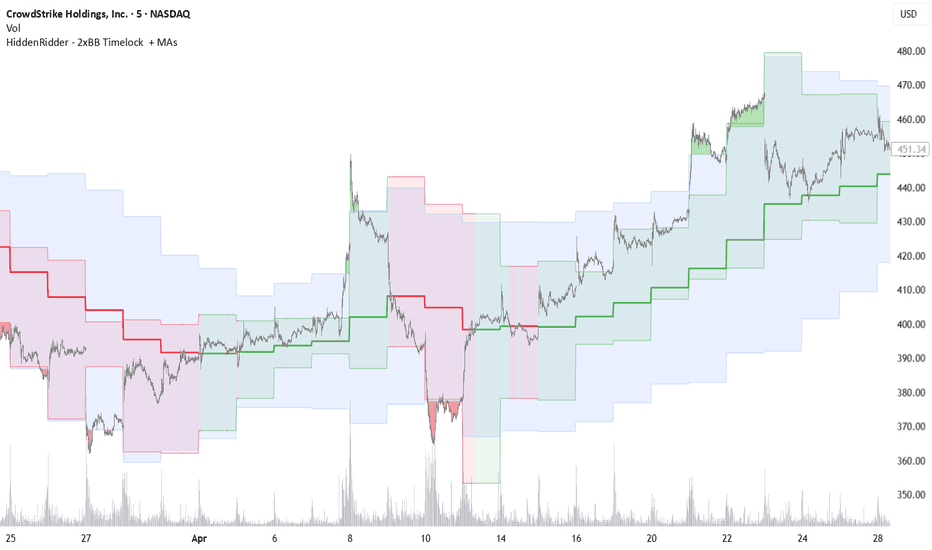
HiddenRidder - 2xBB Timelocked + MAs## HiddenRidder - 2xBB Timelocked + MAs##
⚠️ Disclaimer
This indicator is shared for educational purposes only. It is a technical analysis tool and does not guarantee specific win rates or financial success. Always practice strict risk management.
------------------------------
## 🔍 Overview
HiddenRidder - 2xBB Timelocked + MAs is a multi-timeframe trend architecture overlay. It projects macro volatility zones and institutional trend states directly onto lower execution timeframes.
This setup is highly optimized for 0DTE options, futures trading, and swing trades .
Unlike standard Bollinger Bands that track a single period, this script tracks two separate Higher Timeframe (HTF) bands simultaneously: a Fast Bollinger (Length 3) and a Slow Bollinger (Length 9). This allows you to monitor short-term momentum shifts and long-term structural trends from a single chart without switching timeframes.
------------------------------
## 🛠️ Core Features & Logic
* Timelocked Dual Bollinger Bands: Calculates two separate Bollinger Bands locked to a higher timeframe (e.g., Daily) using a 2x Standard Deviation multiplier.
* Fast Bollinger (Length 3): Captures immediate HTF price expansions.
* Slow Bollinger (Length 9): Establishes the macro structural boundaries.
* Dynamic Trend Basis Line: The central slow basis line changes color dynamically. It turns Green when the price trades above it and Red when the price trades below it.
* Hyper-Extension Breakout Clouds: When enabled (Fill Outside BB), the chart floods with color when the price breaks outside the slow 2SD bands.
* Bright Green Cloud: Triggers when the close price breaks above the upper outer band.
* Bright Red Cloud: Triggers when the close price breaks below the lower outer band.
------------------------------
## ⏱️ Timeframe Setup Guide
* Indicator Input Setting: Keep the Bollinger Band lock Timeframe set to Daily (D).
* Execution Chart: Open your main trading chart on the 5-Minute (5M) timeframe.
* The Interface: The wide macro bands will stretch across your fast 5M candles, acting as major institutional support and resistance maps.
------------------------------
## 🚦 The Baseline Filter ( The Golden Rule )
To stay on the right side of the institutional trend on a fast 5M chart, use the center line color as your directional filter:
* If the center line is Green , focus only on Long setups.
* If the center line is Red , focus only on Short setups.
------------------------------
## 🎯 Trade Setups & Strategy Execution##
Strategy 1 : The Mean Reversion (The Snap-Back)
Best for choppy, sideways, or range-bound macro markets.
* Long Setup:
1. The 5M price drops and touches or pierces the Slow Bollinger Lower Band (Length 9).
2. Wait for a 5M bullish reversal candle (e.g., a hammer, bullish engulfing, or long lower wick).
3. Entry: Open of the next candle.
4. Take Profit (TP): The dynamic central basis line.
5. Stop Loss (SL): Just below the recent 5M swing low.
* Short Setup:
1. The 5M price rallies and touches or pierces the Slow Bollinger Upper Band (Length 9).
2. Wait for a 5M bearish reversal candle (e.g., a shooting star, bearish engulfing, or long upper wick).
3. Entry: Open of the next candle.
4. Take Profit (TP): The dynamic central basis line.
5. Stop Loss (SL): Just above the recent 5M swing high.
## Strategy 2 : The Hyper-Extension Breakout (Riding the Cloud)
Best for aggressive, heavy-volume momentum days.
* Long Setup:
1. A 5M candle closes completely above the Slow Bollinger Upper Band.
2. The Bright Green Breakout Cloud floods your screen.
3. Entry: Enter long immediately on the close of that breakout candle.
4. Take Profit (TP): Trail using 5M swing highs, or exit when a 5M candle closes back inside the Fast Bollinger Upper Band (Length 3).
5. Stop Loss (SL): Below the Fast Bollinger Upper Band line.
* Short Setup:
1. A 5M candle closes completely below the Slow Bollinger Lower Band.
2. The Bright Red Breakout Cloud floods your screen.
3. Entry: Enter short immediately on the close of that breakout candle.
4. Take Profit (TP): Trail using 5M swing lows, or exit when a 5M candle closes back inside the Fast Bollinger Lower Band (Length 3).
5. Stop Loss (SL): Above the Fast Bollinger Lower Band line.
------------------------------
## ⚙️ Input Settings Summary
* Bollinger Band lock Timeframe: Select your target higher timeframe (Default: D).
* Length Short: Sets the period for the Fast Bollinger band (Default: 3).
* Length Long: Sets the period for the Slow Bollinger band (Default: 9).
* Fill Outside BB: Turn this on to display the green/red hyper-extension breakout clouds.
=====================
🎁 Bonus Feature : High-tier institutional EMA Ribbon (20/50/200) with custom trend-cloud formatting. It is currently set to invisible by default , keeping the chart clean while hiding a pro-level momentum engine just for my loyal fans. Indikator
Indikator

Normalized Momentum Trigger SimpleNormalized Momentum Trigger Simple
Normalized Momentum Trigger is a clean momentum and impulse indicator designed to identify directional shifts by measuring how far price is moving away from its average, normalized by recent volatility.
Instead of using raw momentum alone, this indicator standardizes price movement relative to its recent deviation, helping make momentum behavior easier to compare across different symbols and timeframes.
Features:
• Normalized momentum line
• Impulse histogram
• Bullish and bearish trigger levels
• Extreme bull and extreme bear trigger levels
• Multiple moving average basis options:
• SMA
• EMA
• WMA
• RMA
• HMA
• Optional zero-line filter
• Optional momentum slope confirmation
• Optional trend MA filter
• Background bias coloring
• Bull, bear, extreme bull, and extreme bear markers
Alerts Included:
• Bull Trigger
• Bear Trigger
• Extreme Bull Trigger
• Extreme Bear Trigger
• Momentum Crossed Above Zero
• Momentum Crossed Below Zero
Potential use cases:
• Identify momentum shifts
• Spot impulse changes
• Confirm trend continuation
• Filter trade entries
• Detect early changes in directional pressure
• Add confluence to existing systems
Interpretation:
Bull Trigger
Momentum impulse crosses above the bullish threshold.
Bear Trigger
Momentum impulse crosses below the bearish threshold.
Extreme Bull / Bear Trigger
Momentum impulse reaches a stronger threshold, suggesting more aggressive directional movement.
Zero Line
Momentum above zero suggests bullish pressure, while momentum below zero suggests bearish pressure.
Impulse Histogram
Shows the change in normalized momentum and helps visualize acceleration or deceleration.
About TrendGenY Indicator
TrendGenY indicators are built from market experience, creative concepts, and a constant pursuit of unique perspectives. Rather than following conventional ideas, the focus is on uncovering alternative insights and viewing market behavior through different angles to reveal information that traditional tools may overlook and help traders build a more meaningful edge in the market. Indikator

Indikator

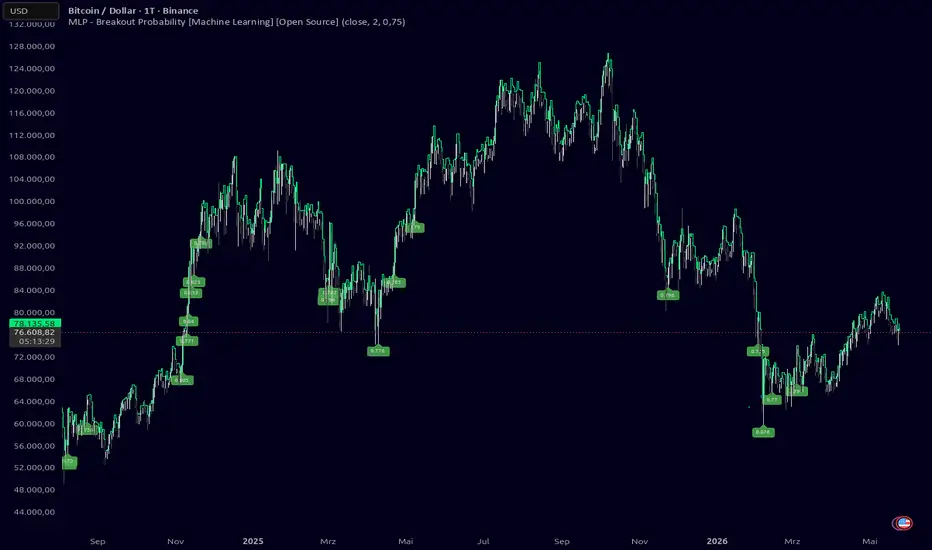
MLP - BTC Breakout Probability [Deep Learning] [Open Source]I trained a single Multilayer Perceptron on 13 years of Bitcoin price history and open-sourced the result. Not because it's perfect, but because the idea is worth sharing.
The concept is simple.
Most breakout strategies are rule-based. Fixed levels, static conditions. This one is different, instead of predicting direction, the model learned the distribution of Bitcoin's daily price moves. You pick a threshold, it gives you the probability. Same model, any level.
How to use it
Pick a percentage threshold , by doing that you're asking the model to evaluate. When price breaks that level and the model is showing meaningful confidence, a label is shown on the chart.. Daily only. BTC only.
Under the hood
A lightweight Multilayer Perceptron (MLP) trained on ~4,700 daily candles of raw OHLC data from May 2009 to May 2022 . The architecture is two hidden layers (16→8), ReLU activations throughout, and a sigmoid output that squashes the result into a clean 0–1 probability score. ReLU keeps the internal representations sparse and non-linear, sigmoid makes the output as a probability.
What makes this interesting is that the model didn't just learn a raw number, it learned the underlying distribution of Bitcoin's daily price moves. That's what allows a single model to answer probability questions across different thresholds rather than being hardcoded to one fixed level.
The output isn't a prediction, it's a calibrated belief about where price is likely to go, derived from 13 years of market structure.
Honest limitations
Fat tails eat this model alive. The features are correlated and the model has no concept of liquidity. It underestimates the extremes.
Daily timeframe only. Bitcoin only. Long only.
This was built as a personal project, mostly for fun and to serve as a working example of how ML concepts can be applied to market data.
Disclaimer
This indicator is provided for educational and informational purposes only. It does not constitute financial advice, trading recommendations, or a guarantee of future results. Past performance does not predict future returns. You alone are responsible for your trading decisions. Always test thoroughly in a simulated environment before trading with real capital. Indikator