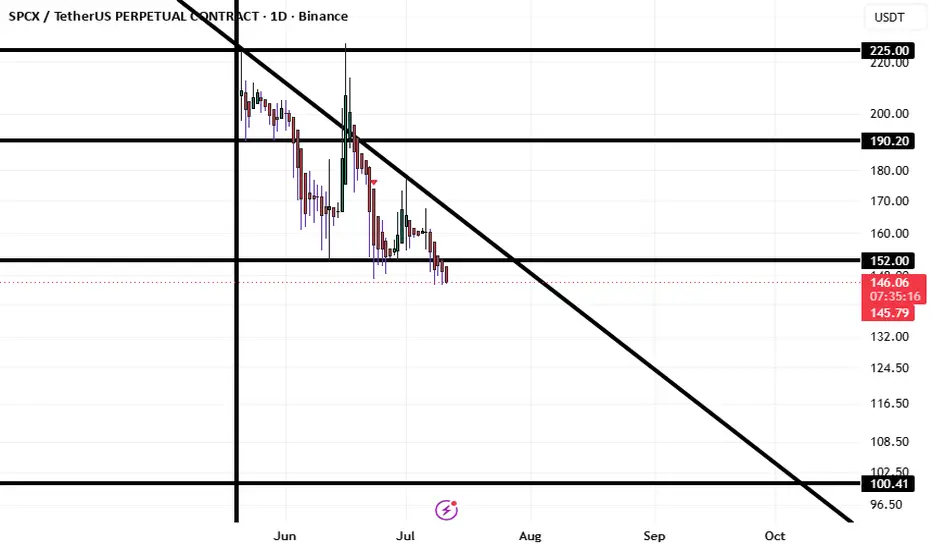
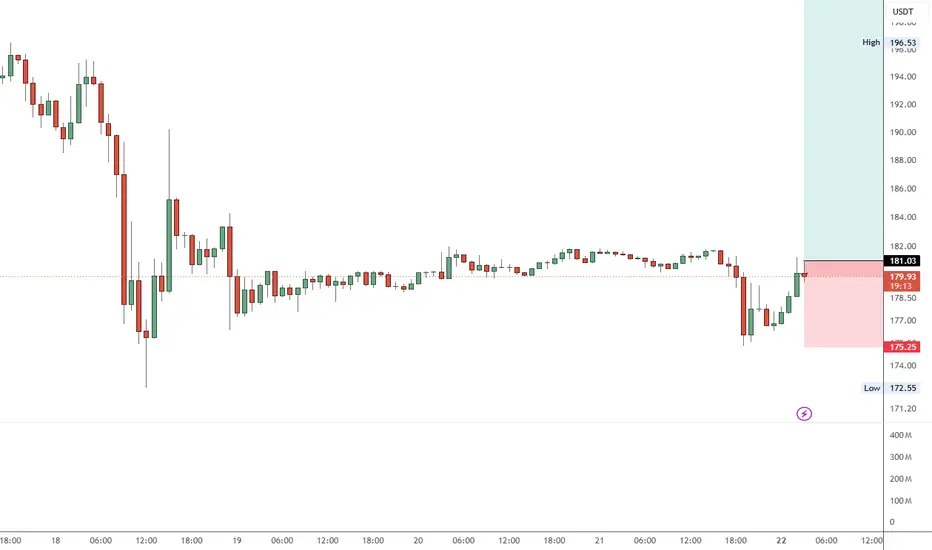
SPCX — Ready for 21% CorrectionSPCX showing signs of exhaustion after its recent run-up, with price extended from key support levels. Expecting a corrective move of around 21% as momentum cools off and profit-taking kicks in. Watching for confirmation before the drop plays out. Not financial advice — DYOR.
SPCX / TetherUS PERPETUAL CONTRACT
No trades
No trades
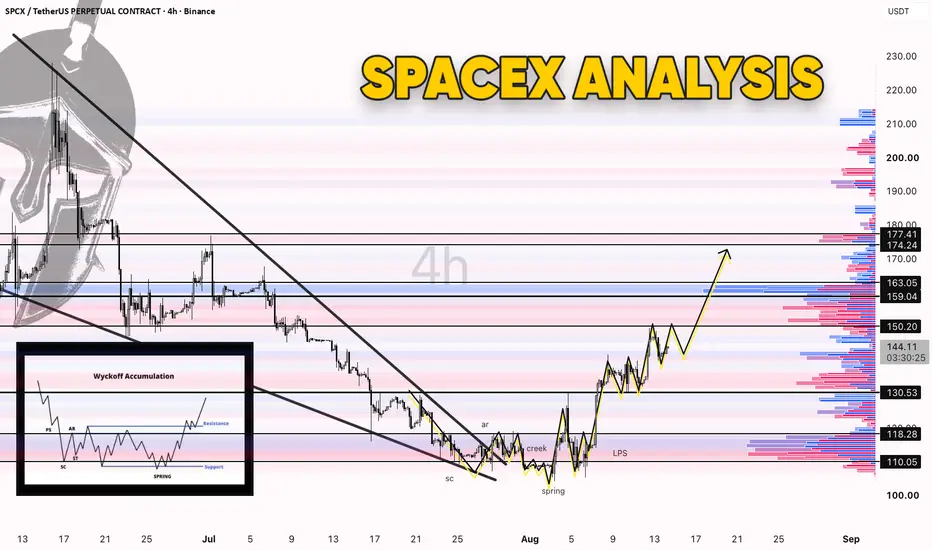
SpaceX carved a bottom. Is the markup real?🚀 The biggest IPO ever, then the hangover
SpaceX went public this June in the largest IPO in history, priced near 135 dollars a share at a valuation close to 1.8 trillion. Then came the hangover. The hype cooled, early buyers cashed out, and the price slid hard over the following weeks down into t
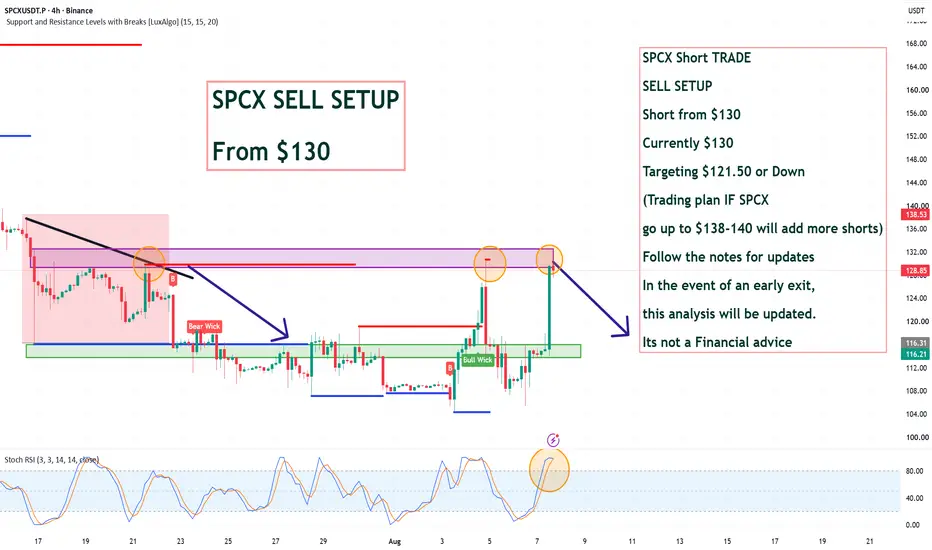
SPCX Short TRADE SELL SETUP Short from $130SPCX Short TRADE
SELL SETUP
Short from $130
Currently $130
Targeting $121.50 or Down
(Trading plan IF SPCX
go up to $138-140 will add more shorts)
Follow the notes for updates
In the event of an early exit,
this analysis will be updated.
Its not a Financial advice
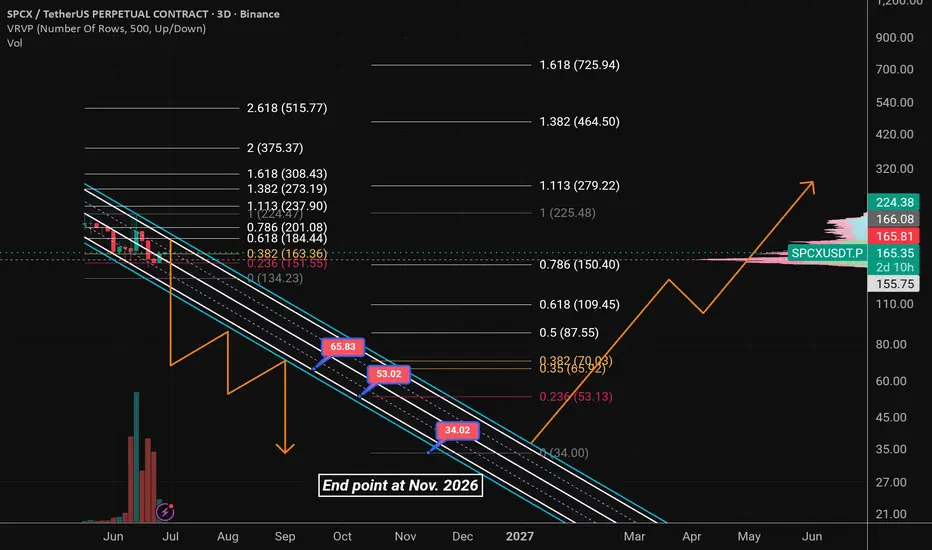
Characterizing SpaceX’s Mid-Term Market Model&Price TrajectoryFirst, we have identified a market-making model for SpaceX characterized by an overlapping descending channel.
The corrective phase likely began recently near the $182 level; while short-term rebounds may occur—triggered by key "hidden" Fibonacci levels—during a multi-month decline; the descending
$SPCX Not a scam. The rip-off of the century.BINANCE:SPCXUSDT.P
Friends, when I called the SPCX IPO a scam of the century a month ago — I was wrong. It's not just a scam. It's the rip-off of the century.
What do we see? Price in downtrend since June. IMA (Integrated Market Analysis) confirms: retail and 🐋WhalePOS (mid/small whale positions)
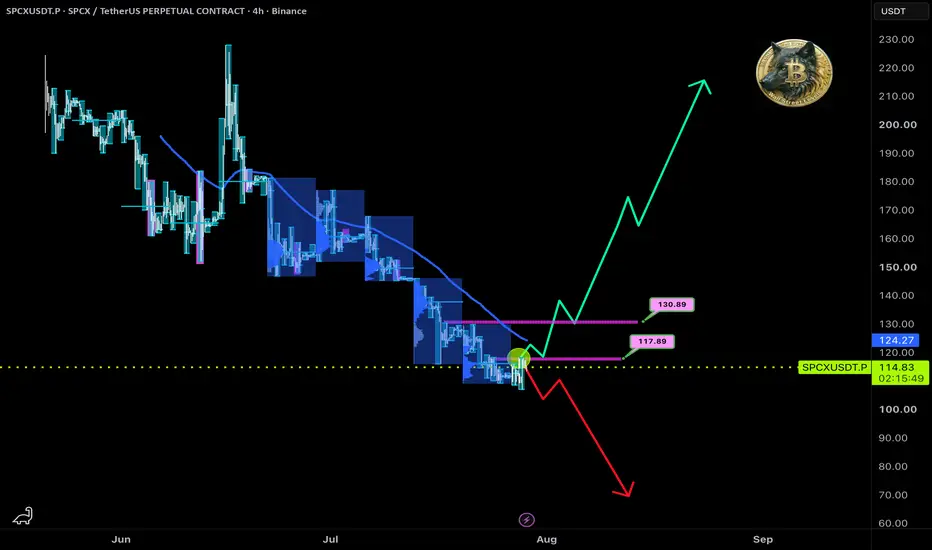
$SPCX Crash or Manipulation of the Century?BINANCE:SPCXUSDT.P
As I noted in the June 26 review: the IPO of the century turned into the manipulation of the century.
NASDAQ:SPCX dropped from $228 to $143 (−38%) after IPO. All support levels broken, no trading history below $135. On the chart — a picture that looks like a collapse.
But if y
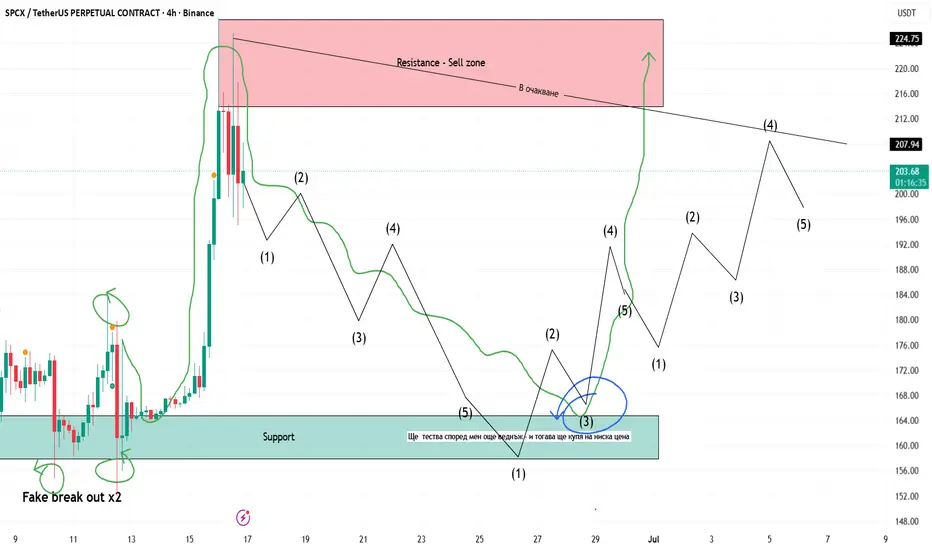
SPCX is heading to the moon (4H)Before anything else, please note that this is a BUY/LONG setup, not a SELL/SHORT setup.
A double combination correction appears to be nearing completion. The second corrective structure looks like a contracting triangle, which is expected to complete soon.
We are looking for BUY/LONG entries with
See all ideas
Summarizing what the indicators are suggesting.
Oscillators
Neutral
SellBuy
Strong sellStrong buy
Strong sellSellNeutralBuyStrong buy
Oscillators
Neutral
SellBuy
Strong sellStrong buy
Strong sellSellNeutralBuyStrong buy
Summary
Neutral
SellBuy
Strong sellStrong buy
Strong sellSellNeutralBuyStrong buy
Summary
Neutral
SellBuy
Strong sellStrong buy
Strong sellSellNeutralBuyStrong buy
Summary
Neutral
SellBuy
Strong sellStrong buy
Strong sellSellNeutralBuyStrong buy
Moving Averages
Neutral
SellBuy
Strong sellStrong buy
Strong sellSellNeutralBuyStrong buy
Moving Averages
Neutral
SellBuy
Strong sellStrong buy
Strong sellSellNeutralBuyStrong buy