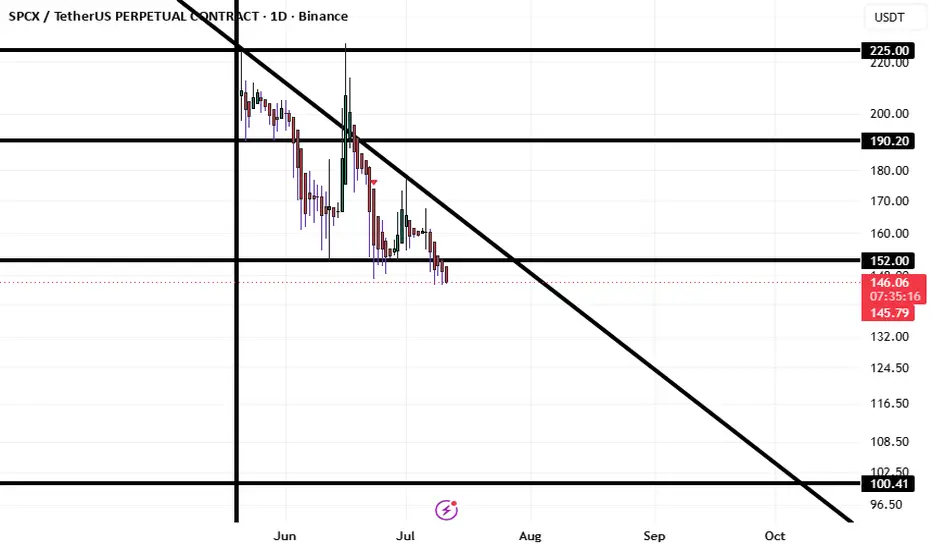
SPCX — Ready for 21% CorrectionSPCX showing signs of exhaustion after its recent run-up, with price extended from key support levels. Expecting a corrective move of around 21% as momentum cools off and profit-taking kicks in. Watching for confirmation before the drop plays out. Not financial advice — DYOR.
SPCX / TetherUS PERPETUAL CONTRACT
No trades
No trades
In-depth trading ideas
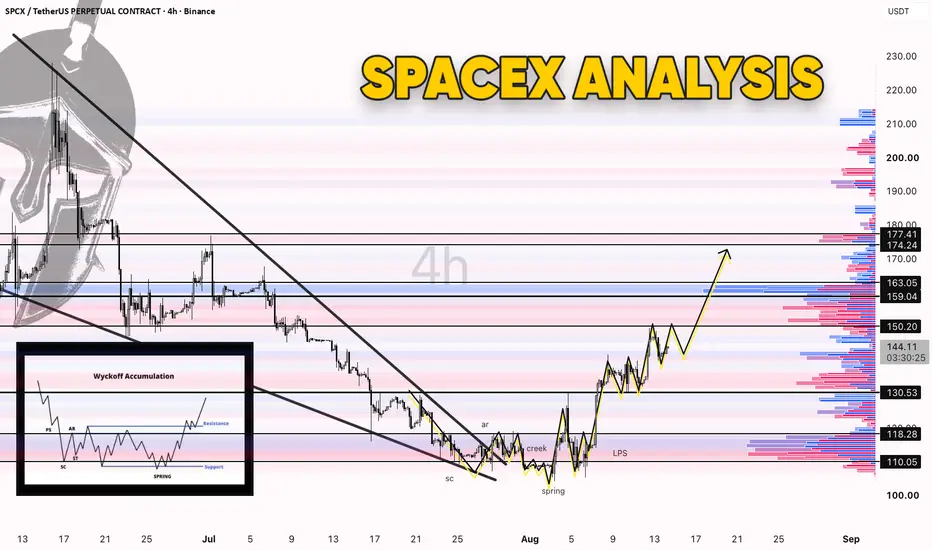
SpaceX carved a bottom. Is the markup real?🚀 The biggest IPO ever, then the hangover
SpaceX went public this June in the largest IPO in history, priced near 135 dollars a share at a valuation close to 1.8 trillion. Then came the hangover. The hype cooled, early buyers cashed out, and the price slid hard over the following weeks down into the low 100s. The contract on this chart, SPCX on Binance, is a perpetual that tracks SpaceX's share price and settles in stablecoin, so you never hold actual equity in the company. What it does give you is a clean view of a textbook pattern.
🛰️ Why buyers came back down low
The selloff did not happen in a vacuum, and neither did the bounce. SpaceX posted its first earnings as a public company in early August, and the business underneath the stock is strong.
Reports put Starlink, its satellite internet arm, near 12 million subscribers, roughly double a year earlier and the bulk of company revenue. The IPO left it holding a cash pile reported around 93 billion dollars. And it signed a deal to supply computing capacity to Google worth a reported 920 million a month. Those are the kind of hard numbers that give large buyers a reason to step in while the price is marked down.
📚 What accumulation looks like
This is a Wyckoff accumulation , a pattern named after the trader who mapped it, where big money quietly builds a position after a crash before the next leg up. It runs in a set sequence, and this chart hit every beat.
First the selling climax near 110, the panic low where heavy selling finally got soaked up. Then a bounce, then the spring , a last stab under support that shakes out the last nervous sellers and traps whoever is shorting the lows. Then a higher low, the last point of support around 118, which becomes the launchpad. Price is now above that range and marking up, which just means trending higher out of the base.
The fundamentals tell you why patient money would accumulate SpaceX down here. Wyckoff shows you the footprints they left doing it.
📊 The levels that matter now
Price is near 143 and climbing. Overhead, the first ceiling is 150, then the heavier band at 159 to 163 where old sellers and a shelf of prior volume sit stacked together, then the highs at 174 to 177 the projection is aimed at. Underneath, the markup stays healthy while 130 holds. Below that sits the 118 to 120 support, and then 110, the spring low.
⚖️ Two ways from here
The structure favors the upside: hold above 130 and grind the markup through 150 into the 159 to 163 band, where I would expect the first real fight, with 174 to 177 as the stretch target. The other side is simple. Lose 130 and price slips back into the range, and a close under 110 says that base was a trap, not accumulation. Between 130 and 150 it is still just doing the work.
Fresh off the biggest IPO ever and printing a classic accumulation. Where does this one run out of room, the 159 to 163 band or the old highs?
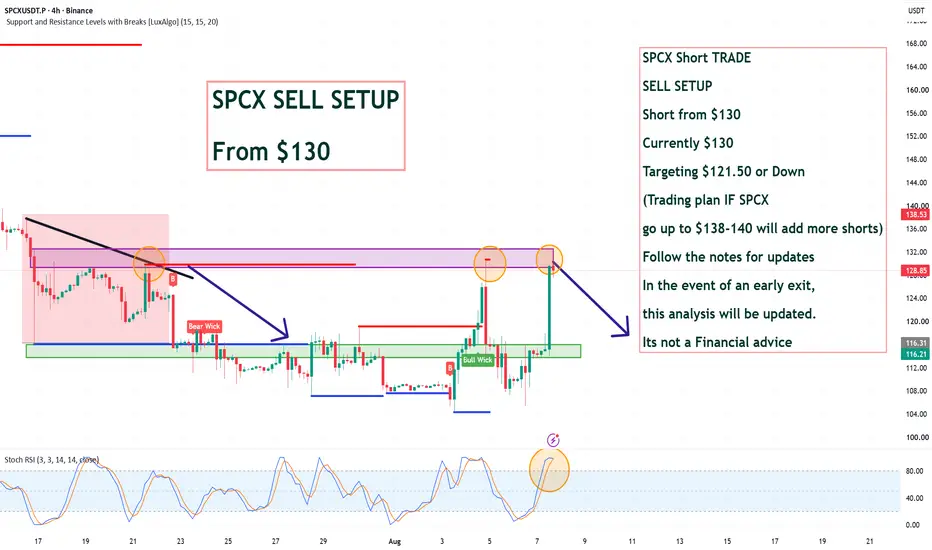
SPCX Short TRADE SELL SETUP Short from $130SPCX Short TRADE
SELL SETUP
Short from $130
Currently $130
Targeting $121.50 or Down
(Trading plan IF SPCX
go up to $138-140 will add more shorts)
Follow the notes for updates
In the event of an early exit,
this analysis will be updated.
Its not a Financial advice
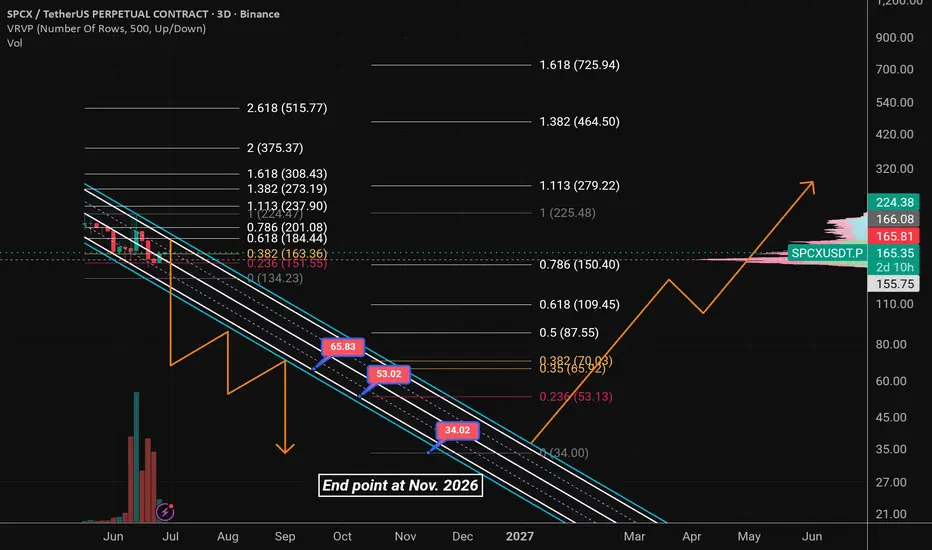
Characterizing SpaceX’s Mid-Term Market Model&Price TrajectoryFirst, we have identified a market-making model for SpaceX characterized by an overlapping descending channel.
The corrective phase likely began recently near the $182 level; while short-term rebounds may occur—triggered by key "hidden" Fibonacci levels—during a multi-month decline; the descending channel itself is likely to conclude at one of three critical price points..
Our ideal scenario is for the stock to exit the descending channel after November 2026 and transition into a new ascending channel market-making model—a trajectory that is highly likely to define SpaceX's long-term price path over the coming years.
good luck.
NASDAQ:SPCX
$SPCX Not a scam. The rip-off of the century.BINANCE:SPCXUSDT.P
Friends, when I called the SPCX IPO a scam of the century a month ago — I was wrong. It's not just a scam. It's the rip-off of the century.
What do we see? Price in downtrend since June. IMA (Integrated Market Analysis) confirms: retail and 🐋WhalePOS (mid/small whale positions) are massively long, while 🐋WhaleMAX (large whale positions) — massively short. And there it is: the classic cascade liquidation setup — many small bets in weak hands against dominant shorts.
IMA signals CVD sliding lower, sellers dominate, longs pay shorts. Long liquidations hit every single day. Downside risk persists until 🐋large accounts start cutting shorts or step decisively into long.
But even this market can be used to your advantage. Don't catch knives — wait for the real reversal. Shorting at the bottom is a rookie move.
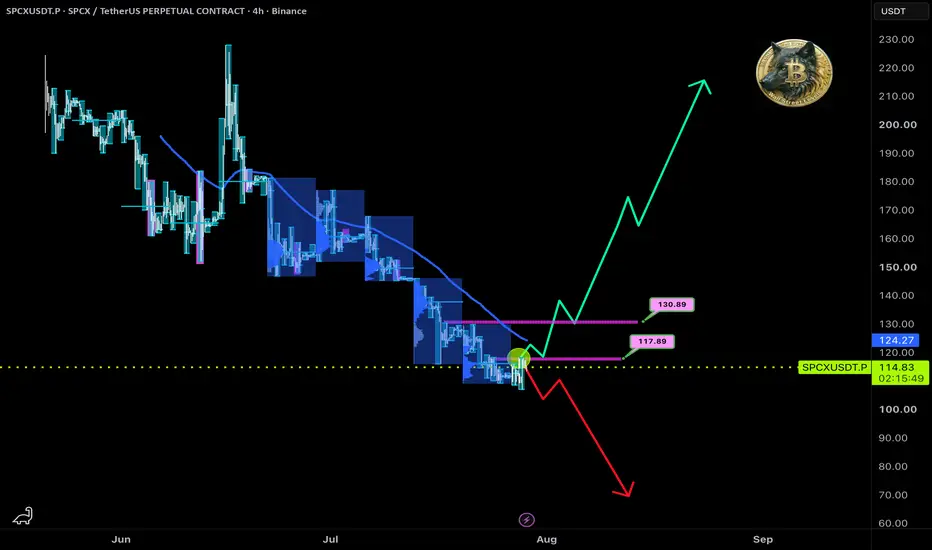
First trend shift signal by today's structure = break of 118. Confirmation = hold above 130. Until then, any bounce is noise and manipulation.
🟡 Signal: break 118 with volume + 🐋large accounts entering long
🟡 Confirmation: hold above 130 + 🐋large accounts increasing long exposure
🟡 Invalid: drop back down without 🐋large accounts
Analysis from me — execution from you 👍
Analysis powered by IMA (Integrated Market Analysis)
$SPCX Crash or Manipulation of the Century?BINANCE:SPCXUSDT.P
As I noted in the June 26 review: the IPO of the century turned into the manipulation of the century.
NASDAQ:SPCX dropped from $228 to $143 (−38%) after IPO. All support levels broken, no trading history below $135. On the chart — a picture that looks like a collapse.
But if you look deeper, through the Integrated Market Analysis (IMA) system, a different story emerges.
What the data says, in plain terms:
• 🐋 Whales aren't exiting: According to IMA, positions of the largest players have been stable since June 30. Despite the drop, they're not selling — meaning they either believe in a recovery, or are quietly accumulating.
• 👥 Retail and mid-tier traders are leaving: The number of mid-level top-trader accounts is shrinking. Small players are cutting losses and exiting — classic "washout" behavior.
• 🔄 Washout scenario: When weak hands exit and strong hands hold — it often precedes a sharp bounce. Not a guarantee, but a pattern worth watching.
My plan:
• 🟡 Watching the 📊 IVZ level at $147: a breakout above this level + rising whale position in IMA = first signal of a reversal
• 🟡 Breakout and hold above 📊 IVZ $153 with stable whale positioning = confirmation: large players have built their position
• 🟡 Important to note: in moments of obvious manipulation and limited trading history, the risk of false moves remains high
In situations like this, it's more important not to guess the bottom — but to wait for institutional capital to show its hand.
Analysis from me — execution from you 🚀
Platform guidelines restrict sharing proprietary indicators, so I display only the 📊 IVZ algorithm output — institutional interest zones.
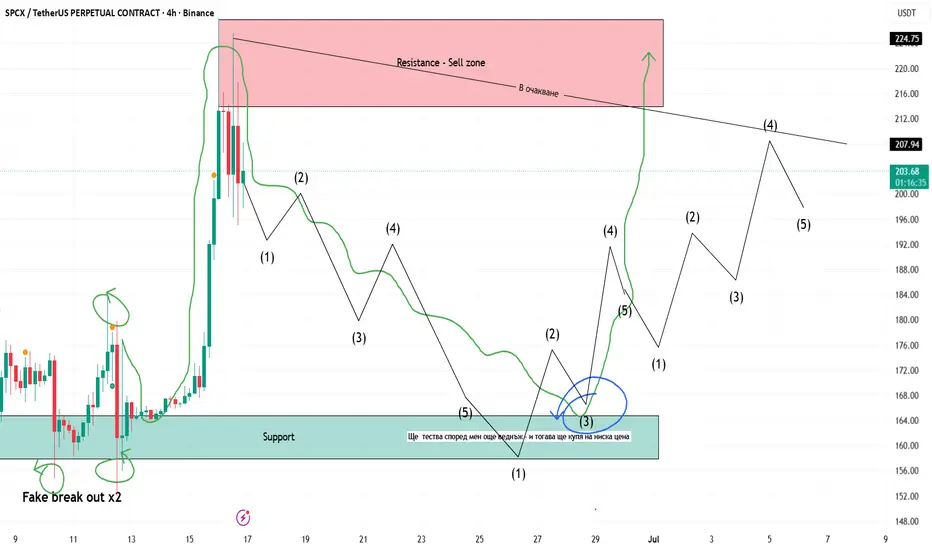
SPCX is heading to the moon (4H)Before anything else, please note that this is a BUY/LONG setup, not a SELL/SHORT setup.
A double combination correction appears to be nearing completion. The second corrective structure looks like a contracting triangle, which is expected to complete soon.
We are looking for BUY/LONG entries within the highlighted entry zone. Try to build your position using DCA (Dollar-Cost Averaging).
The targets are marked on the chart. Be sure to take partial profits at the first target, then move your stop loss to break-even.
A daily candle close below the invalidation level will invalidate this setup and the overall analysis.
If you have a coin or altcoin you want analyzed, first hit the like button and then comment its name so I can review it for you.
Do you also think SPCX is bullish?
#SPCX Classic playbook!BINANCE:SPCXUSDT.P
A few days of growth plus hype in the news cycle — and now retail is trapped: bought the highs while the big player quietly takes profits.
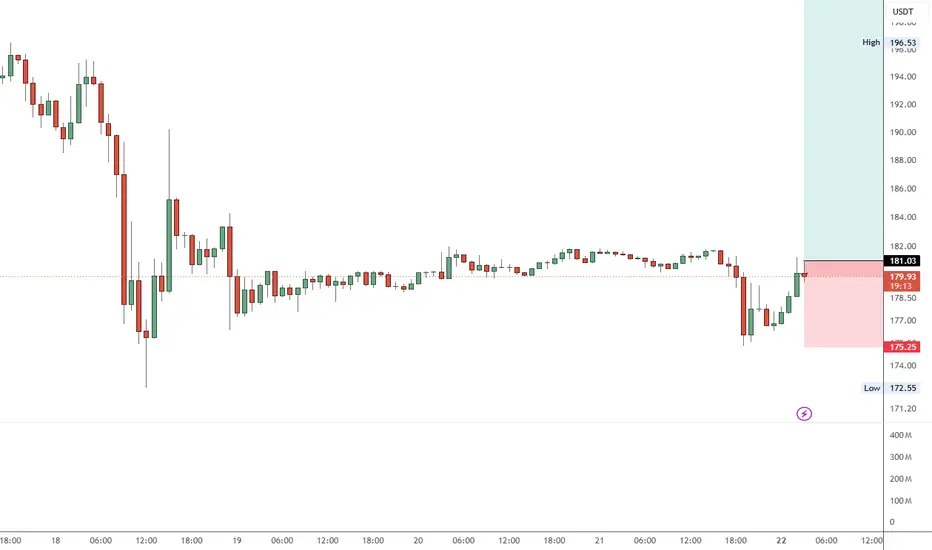
If we don't see the same trick from Elon Musk as with the TRUMP token, then the $179–$169 range would be a solid entry zone for a position.
If large investors don't step in to buy this level — we won't see the bottom anytime soon!
What's your take: bounce at $179 or straight to the bottom?
🎁 SUBSCRIBE — get a free analysis of any coin as a gift!
Analysis from me — execution from you 🚀
Note: TradingView restricts publishing closed indicators, so I only share the output from my 📊 IVZ algorithm — zones where institutional capital shows interest.
Something big could be launching soon for SpaceXSpaceX has pulled back after a strong rally from the lows and is now consolidating above the key $190 support zone.
This sideways price action could be healthy accumulation before the next leg higher. If buyers continue to defend $190, there is potential for the first major trend continuation move after this consolidation phase.
The stock remains in price discovery mode, which means volatility and opportunity can both increase significantly.
Bullish scenario:
• Support at $190 holds
• Momentum builds during consolidation
• Breakout above $220 could trigger a new expansion phase
Bearish scenario:
• Loss of $190 support could open the door for a move back toward the $160 range
For now, the trend remains strong as long as $190 holds. A clean breakout above $220 could put the sky back in play.
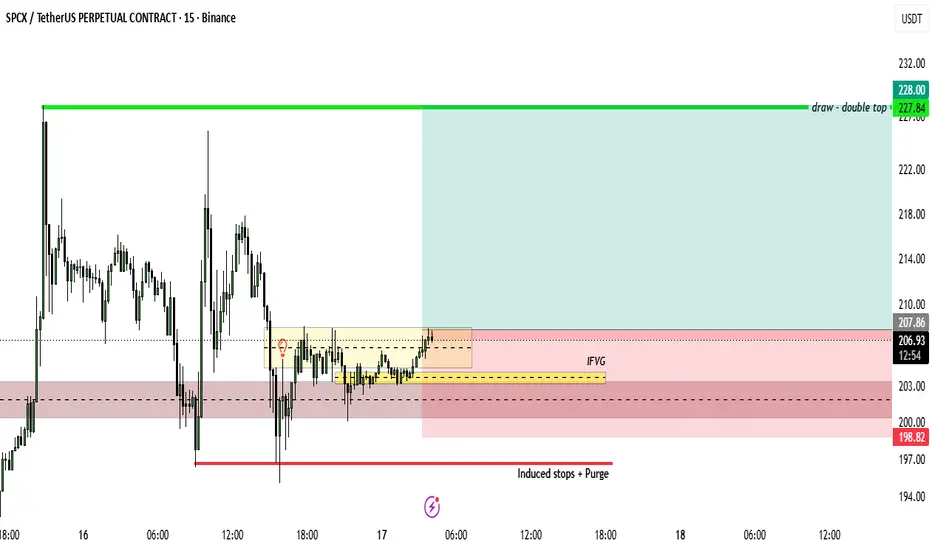
Bullish Idea SpaceX - SPCX1. Price has tapped into the Daily OB
2. We do have a shift in structure (light bulb icon)
3. We have double top draws as the target
4. The bearish drop from all time high is the drop that usually occurs after price hitting all time highs - there is always a high probability price may revert back to all time highs
5. We have IFVGs - price closing above them
$SPCX to $250?NASDAQ:SPCX looking interesting on the 4-hour timeframe.
Expecting something along these lines if we can continue holding the $190s as support. The recent breakout looks clean, and as long as that level stays intact, I think this has room to expand higher.
A sustained hold above $180 could open the door for a move into the $250–270 area over the coming sessions.
Invalidation: clean acceptance below $180.
SPCX is not SpaceX equity.SPCX on Hyperliquid: Is the Market Repricing SpaceX, or Just Repricing Risk?
SPCX is currently down roughly 30% from its Hyperliquid perp listing high.
At first glance, the simple interpretation is:
“Retail is already rejecting the SpaceX IPO valuation.”
But that may be too shallow.
SPCX is not SpaceX equity.
It does not represent ownership, voting rights, governance, balance sheet exposure, or a direct claim on future cash flows.
It is a synthetic perpetual market built around expected SpaceX valuation.
That makes it less of a pure fundamental asset and more of a real-time sentiment instrument.
In other words:
SPCX may not be telling us what SpaceX is worth.
It may be telling us how much speculative appetite exists for one of the most hyped private-market stories in the world.
And that distinction matters.
The Key Question
If SPCX is falling while Bitcoin, Nasdaq, AI names, and other high-beta trades are also under pressure, then the move may say less about SpaceX specifically and more about a broader risk-off / deleveraging regime.
This is why we should be careful with the sentence:
“The market just told you what the IPO is worth.”
Maybe.
But maybe the market is simply telling us that pre-IPO hype, synthetic exposure, and crowded risk positioning were too stretched.
The deeper question is:
What is SPCX actually tracking?
SpaceX fair value
Retail access premium
IPO hype premium
Crypto risk appetite
Broader liquidity conditions
My base case is that SPCX currently behaves more like a high-beta sentiment proxy than a clean valuation model.
That does not make it useless.
Actually, it may make it more useful.
Because synthetic markets often price emotion before traditional markets can react.
Why It Matters
If SPCX keeps falling while broader risk assets remain weak, it may confirm that speculative capital is being pulled back from the most crowded narratives.
But if SPCX stabilizes before the actual IPO, it could also mean that the speculative flush happened early, before Wall Street price discovery even begins.
That would create a very different setup.
So for me, the key is not whether SPCX is “right” or “wrong.”
The key is whether it acts as a leading indicator of SpaceX IPO sentiment…
or just another victim of the broader liquidity unwind.
Right now, the chart is not only about SpaceX.
It is about how much risk the market is still willing to underwrite.