
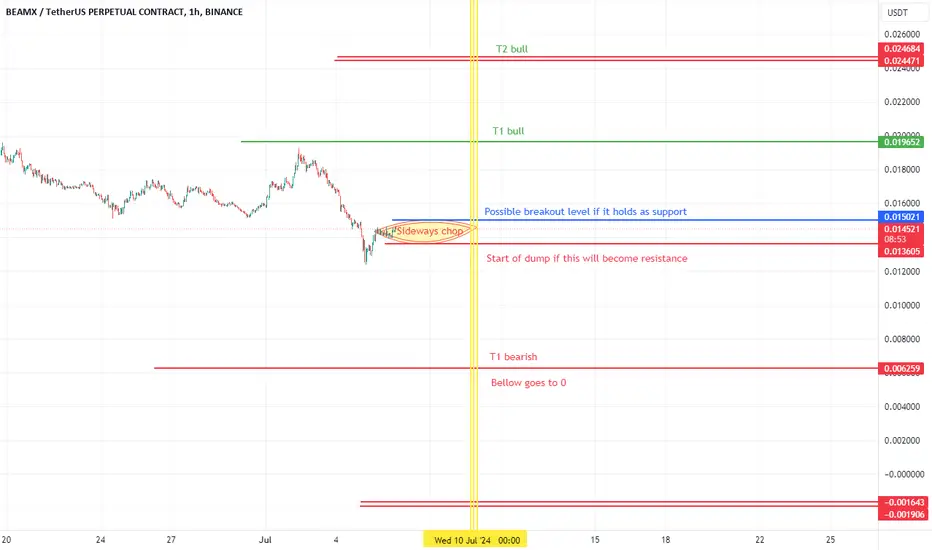
Beamx chart Price is contained in the yellow sideways cell, that acts as a chop zone. Once the price leaves that area and breaks the blue level it has a chance of going bull to T1. If the price breaks under the yellow cell, the higher chances are that the price will go to T1 bear.
This is done using an experimental method that I developed based on Da Vinci.
This is not financial advice.
This is done using an experimental method that I developed based on Da Vinci.
This is not financial advice.

Exención de responsabilidad
La información y las publicaciones no constituyen, ni deben considerarse como, asesoramiento o recomendaciones financieras, de inversión, de trading u otro tipo, proporcionadas o respaldadas por TradingView. Obtenga más información en Condiciones de uso.
Exención de responsabilidad
La información y las publicaciones no constituyen, ni deben considerarse como, asesoramiento o recomendaciones financieras, de inversión, de trading u otro tipo, proporcionadas o respaldadas por TradingView. Obtenga más información en Condiciones de uso.