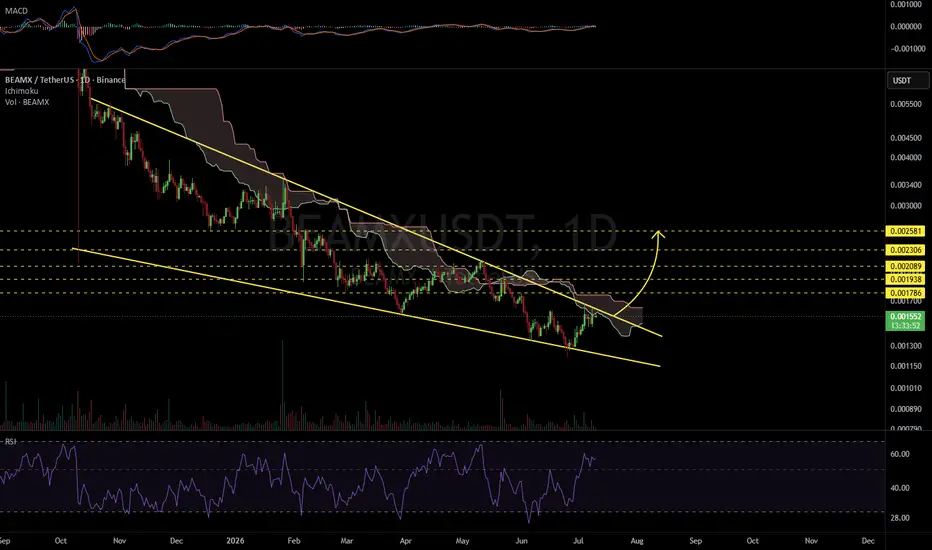
BEAMXUSDT 1D#BEAMX is moving inside a falling wedge pattern on the daily chart.
In case of a breakout above the wedge resistance and the Ichimoku cloud, the potential upside targets are:
🎯 $0.001786
🎯 $0.001938
🎯 $0.002089
🎯 $0.002306
🎯 $0.002581
⚠️ Always remember to use a tight stop-loss and maintain prope
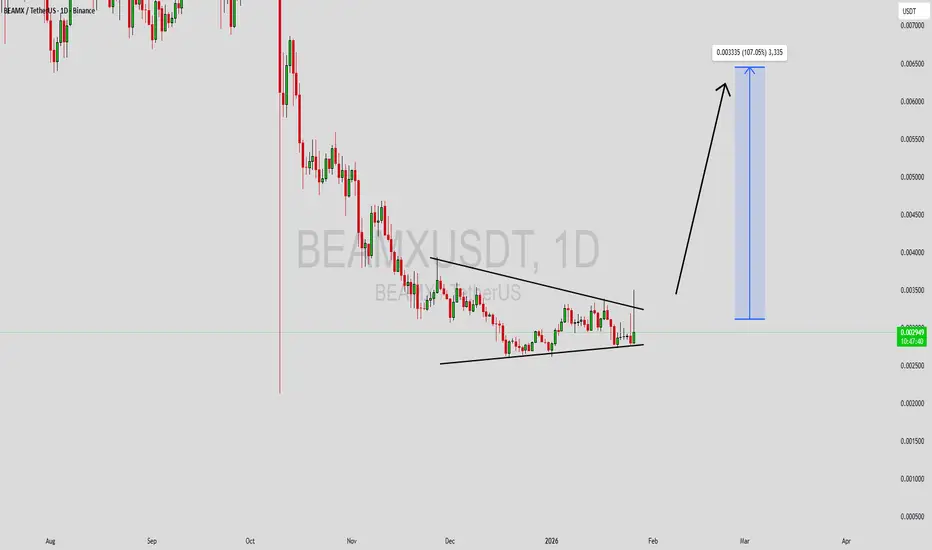
BEAMXUSDT Forming Falling WedgeBEAMXUSDT is forming a clear falling wedge pattern, a classic bullish wave signal that often indicates an upcoming breakout. The price has been consolidating within a narrowing range, suggesting that selling pressure is weakening while buyers are beginning to regain control. With consistent volume c
BEAMXUSDT 1D#BEAMX is facing a resistance cluster that includes the trendline, the daily SMA50, and the Ichimoku cloud. Volume has increased strongly, and RSI suggests a potential breakout. Keep a close eye on it. If a breakout occurs, the potential upside targets are:
🎯 $0.003590
🎯 $0.004204
🎯 $0.004700
🎯 $0.
BEAMXUSDT Forming Falling WedgeBEAMXUSDT is forming a clear falling wedge pattern, a classic bullish reversal signal that often indicates an upcoming breakout. The price has been consolidating within a narrowing range after the recent down move, suggesting that selling pressure is gradually weakening while buyers are starting to
BEAMX Analysis (4H)Market makers, in this weak and low-volatility market, are hunting for liquidity. Bullish momentum on this asset is very weak, and the previous trend is bearish, which causes most traders to look for sell/short positions.
However, there are signs on the chart indicating a potential stop hunt for se
BEAM is showing strength as it finds its bottomBEAM is ranging sideways and has shown that selling pressure has diminished, indicating that sellers are likely exhausted. The good news is that the recent recovery was strong and is now looking for a breakout. In addition, momentum and trend oscillators are suggesting a continuation up as it enters
$BEAMX Breakout bullish symmetrical pattern in Daily time frame
**Execute the trade**
Once the breakout is confirmed, there are two primary entry strategies:
**Aggressive entry**: Enter a long position immediately after a candle closes above the upper trendline.
**Conservative entry:** Wait for a retest of the broken trendline, which now acts as a support le
BEAMXUSDT 1D#BEAMX is moving within a symmetrical triangle. Consider buying at the current price and near the support levels of $0.007523 and $0.007035. If it breaks out above the triangle resistance, the targets are:
🎯 $0.008218
🎯 $0.008780
🎯 $0.009342
🎯 $0.010141
🎯 $0.011160
⚠️ Always remember to use a tigh
See all ideas
Summarizing what the indicators are suggesting.
Oscillators
Neutral
SellBuy
Strong sellStrong buy
Strong sellSellNeutralBuyStrong buy
Oscillators
Neutral
SellBuy
Strong sellStrong buy
Strong sellSellNeutralBuyStrong buy
Summary
Neutral
SellBuy
Strong sellStrong buy
Strong sellSellNeutralBuyStrong buy
Summary
Neutral
SellBuy
Strong sellStrong buy
Strong sellSellNeutralBuyStrong buy
Summary
Neutral
SellBuy
Strong sellStrong buy
Strong sellSellNeutralBuyStrong buy
Moving Averages
Neutral
SellBuy
Strong sellStrong buy
Strong sellSellNeutralBuyStrong buy
Moving Averages
Neutral
SellBuy
Strong sellStrong buy
Strong sellSellNeutralBuyStrong buy
Displays a symbol's price movements over previous years to identify recurring trends.