
Pair Rotation with Z‑Score Dislocation — A Process‑First “Wait Until It’s Worth It” Workflow
Most traders treat pair ideas like a constant signal generator: “tell me when to rotate, every time, on every wiggle.” In practice, that approach usually creates churn. Fees, slippage, sudden correlation shifts, and trend persistence can turn a “statistically interesting” spread move into a sequence of low-quality decisions.
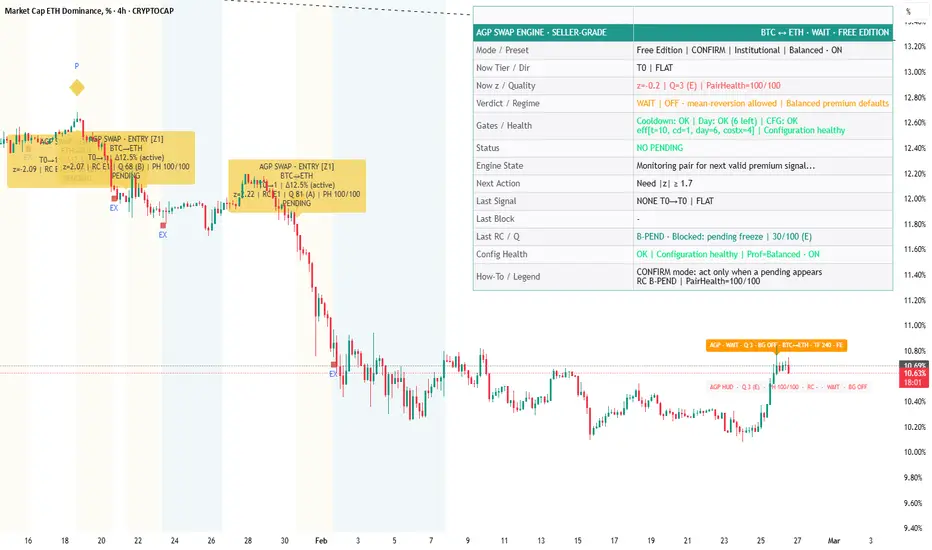
AG Pro Swap Engine - Pair Rotation (Z-Score) [Free Edition] is built around a different mindset: decision support with state visibility. Instead of forcing trades, it tracks relative dislocation between two assets and then pushes that information through filters, health checks, cooldown logic, and an explicit decision layer. The end result is not just a number (Z-score), but a structured “what is the engine seeing right now, and why is it (not) actionable?” readout.
1) The core concept: normalized dislocation, not absolute price
When you compare Asset A vs Asset B, you’re not asking “is A going up?” You’re asking “is A moving unusually relative to B?” That’s where a normalized Z-score style framework becomes useful:
- Positive dislocation: A is stretched versus B (relative outperformance).
- Negative dislocation: A is depressed versus B (relative underperformance).
- Near neutral: no meaningful relative imbalance; the best action is often “do nothing.”
Normalization matters because it lets you compare relative conditions across different price levels and volatility regimes. But it still needs context: Z-score alone can stay extended for longer than you expect during strong trends or structural regime shifts. This is exactly why the engine layers constraints on top.
2) Engine timeframe: separate “signal computation” from “execution chart”
A common pitfall is mixing the timeframe you trade with the timeframe you measure the pair relationship. This engine allows you to select an Engine timeframe. Practically:
- Higher engine timeframe (e.g., 4H/1D) tends to produce fewer, more stable dislocation regimes.
- Lower engine timeframe (e.g., 15m/1H) increases responsiveness but can amplify noise.
You can keep your chart timeframe for execution and readability, while letting the engine do the heavy lifting on a timeframe that fits your personality and the market’s volatility.
3) Decision states are the real product
What makes this “engine-like” is state. Instead of a single “BUY/SELL” label, you can see whether the engine is:
- Monitoring: conditions are being tracked, but nothing is strong enough yet.
- Pending: a condition is forming, but still needs confirmation.
- Blocked: something in quality, health, cooldown, or configuration prevents action.
- Eligible / actionable: the filtered setup is considered valid under your rules.
The practical benefit is psychological and operational: you are less likely to “interpret random movement as opportunity” when the script explicitly tells you why it is not ready.
4) Quality filtering and pair health: protecting against bad environments
Pair ideas break most often in these situations:
- Correlation breakdown (assets stop behaving as a pair).
- Trend persistence (spread stays extreme because the market is re-pricing a narrative).
- Structurally unstable phases (news shocks, liquidity holes, fast regime flips).
This engine includes pair health checks and quality context so the decision layer can be more selective. Even if the Z-score looks interesting, a “healthy pair” and “acceptable quality” environment matters. If the script shows blocked states during these regimes, that’s not a bug — that is the intended behavior of a disciplined decision-support tool.
5) Cooldown and cost-aware behavior: reducing churn
Rotations are not free. Even if you don’t explicitly model fees and slippage, you can still reduce churn by applying behavioral constraints:
- After a rotation event, enforce a cooldown window.
- Avoid flipping back and forth in noisy mean-reversion.
- Respect “cost friction” by reducing decision frequency.
Cooldown logic is a simple concept, but it’s a major contributor to real-world usability. It also makes your workflow auditable: you can explain why you did NOT take a second signal immediately after the first.
6) How I’d use it in practice (example workflow)
Step A — Choose a meaningful pair
Pick Asset A and Asset B that you believe have a legitimate relationship (sector pair, correlated majors, product-category pair, etc.). Random pairs can generate interesting Z-scores that are not tradable.
Step B — Set the engine timeframe
Start higher than you think. Many traders discover that a slower engine timeframe produces clearer states and fewer “micro-traps.”
Step C — Enable the visibility tools
Use the HUD/panel to track:
- Current dislocation regime
- Engine state (monitoring/pending/blocked)
- Health/context flags
- Configuration health (so you know you didn’t accidentally misconfigure the logic)
Step D — Treat the output as a decision checklist, not an order ticket
If it’s blocked, read the reason. If it’s monitoring, accept that waiting is a valid outcome. If it’s actionable, you still validate with your own execution rules (trend context, liquidity conditions, risk limits).
7) Limitations (important)
This indicator does not know your portfolio, your position sizing, your exchange fees, your slippage, your latency, your tax constraints, or your execution mechanics. It is a chart-based analytical aid and should be used as part of a broader trading process. Pair rotation logic can underperform during strong trend persistence, correlation breakdowns, or structurally unstable phases.
Risk disclosure:
Educational and analytical use only. Not financial advice. Always validate independently and use risk management.
Most traders treat pair ideas like a constant signal generator: “tell me when to rotate, every time, on every wiggle.” In practice, that approach usually creates churn. Fees, slippage, sudden correlation shifts, and trend persistence can turn a “statistically interesting” spread move into a sequence of low-quality decisions.
AG Pro Swap Engine - Pair Rotation (Z-Score) [Free Edition] is built around a different mindset: decision support with state visibility. Instead of forcing trades, it tracks relative dislocation between two assets and then pushes that information through filters, health checks, cooldown logic, and an explicit decision layer. The end result is not just a number (Z-score), but a structured “what is the engine seeing right now, and why is it (not) actionable?” readout.
1) The core concept: normalized dislocation, not absolute price
When you compare Asset A vs Asset B, you’re not asking “is A going up?” You’re asking “is A moving unusually relative to B?” That’s where a normalized Z-score style framework becomes useful:
- Positive dislocation: A is stretched versus B (relative outperformance).
- Negative dislocation: A is depressed versus B (relative underperformance).
- Near neutral: no meaningful relative imbalance; the best action is often “do nothing.”
Normalization matters because it lets you compare relative conditions across different price levels and volatility regimes. But it still needs context: Z-score alone can stay extended for longer than you expect during strong trends or structural regime shifts. This is exactly why the engine layers constraints on top.
2) Engine timeframe: separate “signal computation” from “execution chart”
A common pitfall is mixing the timeframe you trade with the timeframe you measure the pair relationship. This engine allows you to select an Engine timeframe. Practically:
- Higher engine timeframe (e.g., 4H/1D) tends to produce fewer, more stable dislocation regimes.
- Lower engine timeframe (e.g., 15m/1H) increases responsiveness but can amplify noise.
You can keep your chart timeframe for execution and readability, while letting the engine do the heavy lifting on a timeframe that fits your personality and the market’s volatility.
3) Decision states are the real product
What makes this “engine-like” is state. Instead of a single “BUY/SELL” label, you can see whether the engine is:
- Monitoring: conditions are being tracked, but nothing is strong enough yet.
- Pending: a condition is forming, but still needs confirmation.
- Blocked: something in quality, health, cooldown, or configuration prevents action.
- Eligible / actionable: the filtered setup is considered valid under your rules.
The practical benefit is psychological and operational: you are less likely to “interpret random movement as opportunity” when the script explicitly tells you why it is not ready.
4) Quality filtering and pair health: protecting against bad environments
Pair ideas break most often in these situations:
- Correlation breakdown (assets stop behaving as a pair).
- Trend persistence (spread stays extreme because the market is re-pricing a narrative).
- Structurally unstable phases (news shocks, liquidity holes, fast regime flips).
This engine includes pair health checks and quality context so the decision layer can be more selective. Even if the Z-score looks interesting, a “healthy pair” and “acceptable quality” environment matters. If the script shows blocked states during these regimes, that’s not a bug — that is the intended behavior of a disciplined decision-support tool.
5) Cooldown and cost-aware behavior: reducing churn
Rotations are not free. Even if you don’t explicitly model fees and slippage, you can still reduce churn by applying behavioral constraints:
- After a rotation event, enforce a cooldown window.
- Avoid flipping back and forth in noisy mean-reversion.
- Respect “cost friction” by reducing decision frequency.
Cooldown logic is a simple concept, but it’s a major contributor to real-world usability. It also makes your workflow auditable: you can explain why you did NOT take a second signal immediately after the first.
6) How I’d use it in practice (example workflow)
Step A — Choose a meaningful pair
Pick Asset A and Asset B that you believe have a legitimate relationship (sector pair, correlated majors, product-category pair, etc.). Random pairs can generate interesting Z-scores that are not tradable.
Step B — Set the engine timeframe
Start higher than you think. Many traders discover that a slower engine timeframe produces clearer states and fewer “micro-traps.”
Step C — Enable the visibility tools
Use the HUD/panel to track:
- Current dislocation regime
- Engine state (monitoring/pending/blocked)
- Health/context flags
- Configuration health (so you know you didn’t accidentally misconfigure the logic)
Step D — Treat the output as a decision checklist, not an order ticket
If it’s blocked, read the reason. If it’s monitoring, accept that waiting is a valid outcome. If it’s actionable, you still validate with your own execution rules (trend context, liquidity conditions, risk limits).
7) Limitations (important)
This indicator does not know your portfolio, your position sizing, your exchange fees, your slippage, your latency, your tax constraints, or your execution mechanics. It is a chart-based analytical aid and should be used as part of a broader trading process. Pair rotation logic can underperform during strong trend persistence, correlation breakdowns, or structurally unstable phases.
Risk disclosure:
Educational and analytical use only. Not financial advice. Always validate independently and use risk management.

🧠 Trading Suite - Flagship Workflow
tradingview.com/script/XJmX3p98-Trading-Suite-AGPro-Series/
🔷 Crypto Setup Planner - Multi-Symbol Planner
tradingview.com/script/LgVRo7Ql-Crypto-Setup-Planner-AGPro-Series/
tradingview.com/script/XJmX3p98-Trading-Suite-AGPro-Series/
🔷 Crypto Setup Planner - Multi-Symbol Planner
tradingview.com/script/LgVRo7Ql-Crypto-Setup-Planner-AGPro-Series/
Exención de responsabilidad
La información y las publicaciones no constituyen, ni deben considerarse como, asesoramiento o recomendaciones financieras, de inversión, de trading u otro tipo, proporcionadas o respaldadas por TradingView. Obtenga más información en Condiciones de uso.
🧠 Trading Suite - Flagship Workflow
tradingview.com/script/XJmX3p98-Trading-Suite-AGPro-Series/
🔷 Crypto Setup Planner - Multi-Symbol Planner
tradingview.com/script/LgVRo7Ql-Crypto-Setup-Planner-AGPro-Series/
tradingview.com/script/XJmX3p98-Trading-Suite-AGPro-Series/
🔷 Crypto Setup Planner - Multi-Symbol Planner
tradingview.com/script/LgVRo7Ql-Crypto-Setup-Planner-AGPro-Series/
Exención de responsabilidad
La información y las publicaciones no constituyen, ni deben considerarse como, asesoramiento o recomendaciones financieras, de inversión, de trading u otro tipo, proporcionadas o respaldadas por TradingView. Obtenga más información en Condiciones de uso.