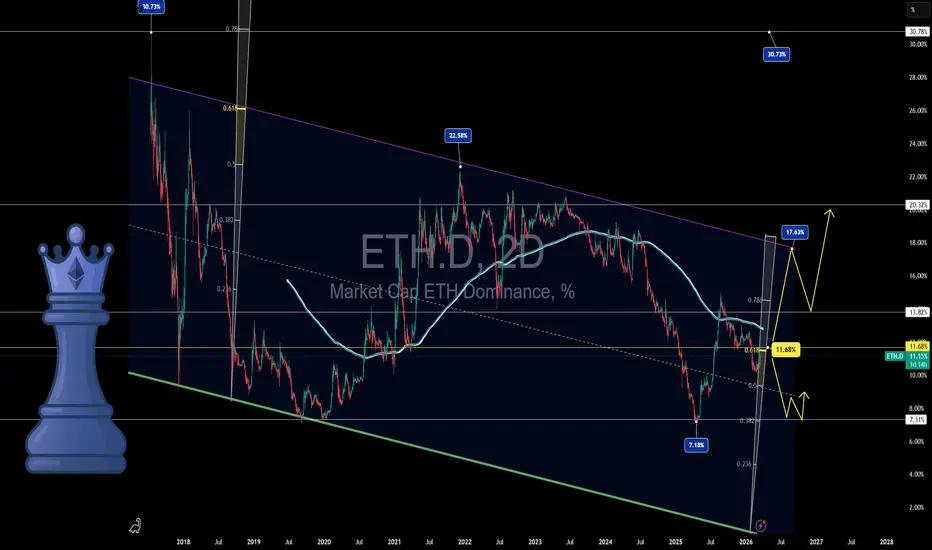
Ethereum dominance expected to rise. LONG ETHEREUMIn this chart, I am measuring ethereum market cap dominance % and comparing it to Bitcoin market cap dominance which are almost always inversely proportionate to each other. I am measure the cycles of both ethereum dominance using the BLUE SINE WAVES and the Bitcoin dominance using the red SINE
Market Cap ETH Dominance, %
No trades
No trades
Key data points
Previous close
—
Open
—
Day's range
–
Details
Coin
Born only a few years ago in 2015, Ethereum has grown into an established blockchain with an even more established native coin. Some might think it's all just hype, but the chart we've prepared here says otherwise — it displays Ethereum's dominance over the whole crypto market (the ratio of ETH market cap to the cumulative crypto market cap). If the line goes up, ETH is rising in value against other coins, and it might be a sign for you to reconsider your portfolio decisions. If it goes down, well, up to you what to do with that.
Mini Ethereum Season? ETH Dominance Is Following the PlanMini Ethereum Season? ETH Dominance Is Following the Plan 👑📈
Part 1:
A few weeks ago, I published my analysis on Ethereum Dominance, outlining why I believed ETH was approaching a major turning point while most of the market remained focused on Bitcoin.
Today, the chart is continuing to respect
Ethereum Dominance (Analysis + fundamentals)Ethereum Dominance: Is ETH About to Take Market Share? 👑💎
Before we analyze the chart, let's first understand what Ethereum Dominance (ETH.D) actually measures.
Many traders confuse it with Ethereum's price—but they're very different.
Ethereum Dominance is the percentage of the entire cryptocur
Can Ethereum grow?👋 **Hello everyone!**
📊 As you can see on the chart, **Ethereum Dominance (ETH.D)** has reached a significant demand zone, which could be an early sign of a potential bullish move. 🟢
📉 After a strong upward impulse, the price entered a **descending channel**. In our view, this structure looks more
Ethereum Dominance Drops as Altcoins Surge (1D)From the point where we placed the green arrow on the chart, Ethereum Dominance started a bullish Wave A. The point marked with the red arrow indicates the end of Wave A and the beginning of Wave B.
Wave B appears to be a combined corrective structure: a diametric + zigzag. We expect it to drop at
Ethereum Dominance — The Queen at a Major S/R LevelEthereum Dominance — The Queen at a Major S/R Level 👑📊
The Queen of Crypto is waking up again…
From the 7.18% lows (called back in April 2025 🎯), Ethereum dominance has pushed up toward 11.4% — a clean, structured move.
But now comes the real test:
➡️ 11.68% — Major S/R Level
This lev
See all ideas
Summarizing what the indicators are suggesting.
Oscillators
Neutral
SellBuy
Strong sellStrong buy
Strong sellSellNeutralBuyStrong buy
Oscillators
Neutral
SellBuy
Strong sellStrong buy
Strong sellSellNeutralBuyStrong buy
Summary
Neutral
SellBuy
Strong sellStrong buy
Strong sellSellNeutralBuyStrong buy
Summary
Neutral
SellBuy
Strong sellStrong buy
Strong sellSellNeutralBuyStrong buy
Summary
Neutral
SellBuy
Strong sellStrong buy
Strong sellSellNeutralBuyStrong buy
Moving Averages
Neutral
SellBuy
Strong sellStrong buy
Strong sellSellNeutralBuyStrong buy
Moving Averages
Neutral
SellBuy
Strong sellStrong buy
Strong sellSellNeutralBuyStrong buy
Displays a symbol's value movements over previous years to identify recurring trends.
Frequently asked questions
Dominance is a coin's market cap relative to the total crypto market. It's expressed as a percentage and measured in US dollars. Ethereum dominance fluctuates over time, reflecting shifts in investor interest across the crypto market.
To observe relationships between cryptocurrencies and identify market leaders, explore the crypto market dominance charts and gain further insights from the crypto market cap charts.
A coin's dominance matters because it shows where capital is concentrated in the crypto market. Unlike price alone, dominance shows whether a coin is gaining or losing market share relative to others, helping traders identify its strength and shifts in investor sentiment.
Traders follow this metric to spot capital flows and changes in market conditions. Rising or falling dominance can signal when leadership is shifting between major coins and altcoins, supporting better timing in making informed decisions.
To find out what causes Ethereum dominance changes, read the latest crypto news and explore the community trading ideas.
Traders follow this metric to spot capital flows and changes in market conditions. Rising or falling dominance can signal when leadership is shifting between major coins and altcoins, supporting better timing in making informed decisions.
To find out what causes Ethereum dominance changes, read the latest crypto news and explore the community trading ideas.
A decline in Ethereum dominance may be caused by capital outflows or other coins gaining momentum. As a single metric, it does not indicate a potential price decline or growth. But when combined with other indicators, it can provide valuable insights into potential trend changes and a coin's performance.
For a broader view of the market, explore the Crypto Coins Heatmap and read the community's crypto trading ideas.
Dominance helps traders understand market structure and capital flows, adding valuable context beyond price signals alone.
By tracking dominance, traders can see where capital and overall market sentiment are moving. A good starting point is analyzing the ETH dominance chart. You can apply technical analysis tools such as indicators, drawing tools, and chart patterns to monitor its behavior and anticipate potential market shifts.
Dominance can also help identify broader trends. For example, BTC dominance has historically declined during certain market cycles, often coinciding with increased growth in altcoins. To spot and analyze such opportunities, you can use our crypto dominance charts.
By tracking dominance, traders can see where capital and overall market sentiment are moving. A good starting point is analyzing the ETH dominance chart. You can apply technical analysis tools such as indicators, drawing tools, and chart patterns to monitor its behavior and anticipate potential market shifts.
Dominance can also help identify broader trends. For example, BTC dominance has historically declined during certain market cycles, often coinciding with increased growth in altcoins. To spot and analyze such opportunities, you can use our crypto dominance charts.
Ethereum dominance = Ethereum market cap / total crypto market cap × 100%
Explore large-cap cryptocurrencies and discover more in the Crypto Coins Screener.
A rising dominance of a coin means its relative value in the crypto market is increasing compared to other coins. Even during market declines, some cryptocurrencies may gain market share in percentage terms, as they become more attractive to investors at lower prices than other coins.
Traders and investors closely monitor these changes in relative values, as they indicate shifts in the market. You can see how coins' caps relate to each other on the crypto dominance chart. To track factors that influence the market, follow the latest news.
There are several factors that can drive a rise or decline in Ethereum dominance:
- Smart money flows: Institutional investors can bring substantial capital into the market, driving rapid asset growth. Conversely, large sell-offs may contribute to bearish sentiment
- Promising technology: Coins with strong real-world use cases tend to attract capital, while newer or more efficient alternatives can draw market share away from older projects
- Regulation: Looser regulatory conditions often support market growth, while stricter rules can reduce liquidity and limit participation
- Market sentiment: In rising markets, optimism and momentum can increase demand across assets, encouraging investors to buy and pushing prices higher
To see what other traders expect from the market, explore ETH dominance trading ideas and follow real-time crypto news.
- Smart money flows: Institutional investors can bring substantial capital into the market, driving rapid asset growth. Conversely, large sell-offs may contribute to bearish sentiment
- Promising technology: Coins with strong real-world use cases tend to attract capital, while newer or more efficient alternatives can draw market share away from older projects
- Regulation: Looser regulatory conditions often support market growth, while stricter rules can reduce liquidity and limit participation
- Market sentiment: In rising markets, optimism and momentum can increase demand across assets, encouraging investors to buy and pushing prices higher
To see what other traders expect from the market, explore ETH dominance trading ideas and follow real-time crypto news.